Audiera Price Forecast: BEAT Soars 40% in a Week, Bulls Targeting $4.68 Resistance

cryptonews.ruPublished on 2026-07-29Last updated on 2026-07-29

Abstract

Audiera (BEAT) has shown renewed strength, surging 36.79% in 24 hours and over 40% for the week to trade around $3.65. This recovery follows a sharp correction from June's peak above $11.40. Technical indicators have improved, with the 20-day EMA ($2.91) above the 50-day EMA ($2.65), signaling regained buyer control. Key resistance is at $4.68, aligned with the 38.2% Fibonacci level. A break above could target $5.97 and $7.26, with the $9.10-$11.44 zone representing major previous highs. Support lies at $3.08 (23.6% Fib) and the 20-day EMA at $2.91. A drop below $2.91 could lead to a deeper pullback. Derivatives data shows open interest stabilizing at around $81.87 million, down from over $350 million in June, indicating a more balanced market with less excessive leverage. Recent spot flows show modest net inflows, suggesting renewed accumulation. The short-term outlook depends on bulls defending the $2.91-$3.08 support area while building momentum toward the $4.68 resistance. A confirmed breakout above this level would signal a stronger recovery, while failure could lead to consolidation near current supports.

Audiera ($BEAT) is showing renewed strength following a sharp correction after its June peak above $11.40. The token recently gained momentum, rising 36.79% in the last 24 hours and 40.28% over the past seven days. Currently, $BEAT is trading around $3.65, with a market cap of approximately $1.13 billion.

The recent recovery reflects improving market sentiment as buyers return after weeks of consolidation. Furthermore, technical indicators suggest that $BEAT has regained strength, although traders remain cautious about short-term volatility and key resistance levels ahead.

Technical Forecast for $BEAT Shows Improved Bullish Structure

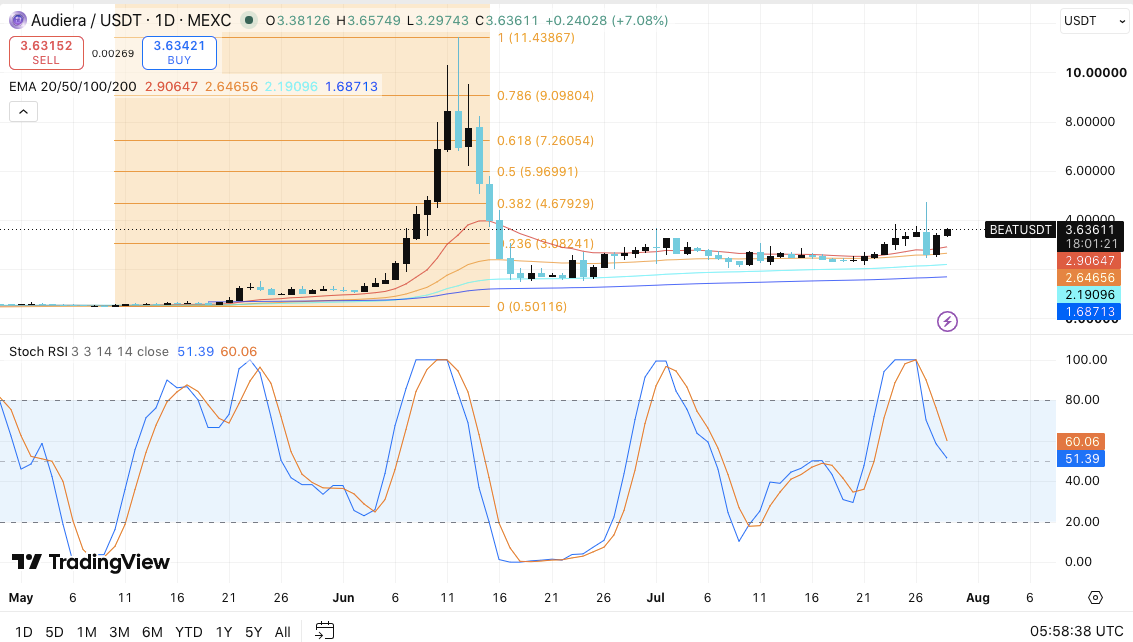
The daily chart of $BEAT/USDT shows a gradual recovery phase after the previous decline. The token is currently trading above its major exponential moving averages, signaling improved medium-term strength.

The 20-day EMA at $2.91 has risen above the 50-day EMA at $2.65. Moreover, both averages remain above the 100-day EMA at $2.19 and the 200-day EMA at $1.69.
Audiera Price Dynamics (Source: Trading View)

This moving average alignment indicates that buyers have regained control. However, $BEAT still needs sustained buying pressure to confirm a full trend reversal. The first major resistance lies at $4.68, which coincides with the 38.2% Fibonacci retracement level. A breakout above this zone could open the path to $5.97 and $7.26.

Furthermore, the $7.26 level represents a significant test for the bulls, as it could confirm a stronger recovery. If momentum is sustained, $BEAT could eventually challenge the resistance zone between $9.10 and $11.44. This area contains previous highs and could attract increased selling activity.

Support Levels and Market Momentum

The short-term outlook for $BEAT largely depends on whether buyers can defend key support areas. The $3.08 level, associated with the 23.6% Fibonacci retracement, remains the first support zone. Additionally, the 20-day EMA at $2.91 provides another layer of defense for the current bullish setup.

A drop below $2.91 could weaken market confidence and expose the token to further decline. Consequently, traders may view the 50-day EMA at $2.65 as the next crucial defensive level.

The Stochastic RSI has started to decline from overbought territory. This suggests that short-term momentum may weaken following the recent rally. Therefore, $BEAT may undergo consolidation before attempting another upward move.

Derivatives Activity Stabilizes After June Volatility

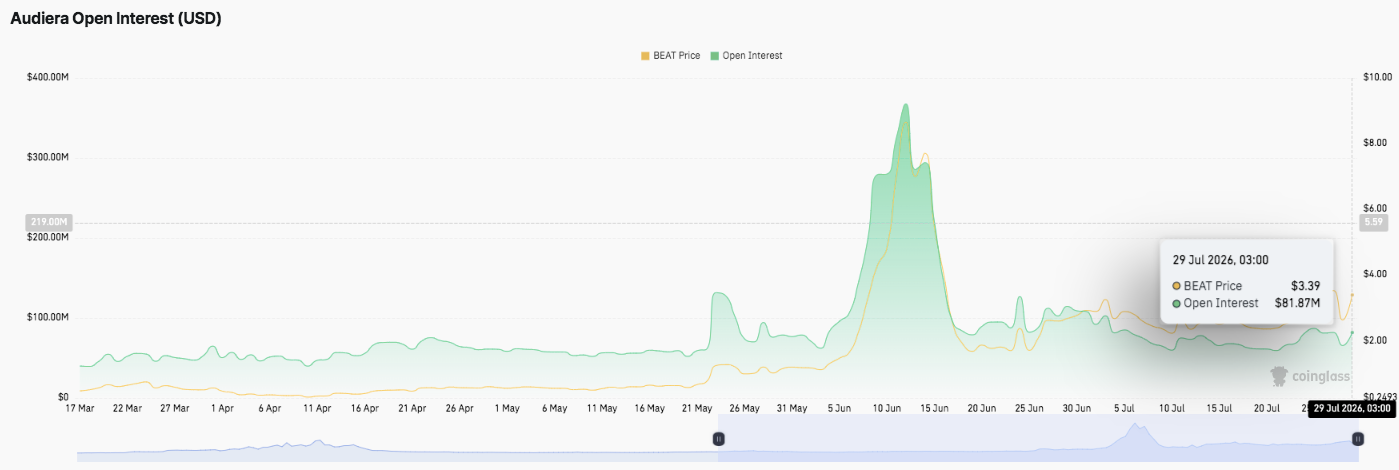
Audiera's open interest data shows significant shifts in trader positioning over recent months. During the rally in early June, open interest surged above $350 million as leveraged traders increased their exposure. This rise reflected strong speculative interest during $BEAT's explosive price movement.
Source: CoinGlass

However, open interest sharply declined following the market reversal. The drop indicates widespread position unwinding and reduced leverage among derivative traders. Since mid-June, open interest has stabilized between $60 million and $120 million.

The latest figure is around $81.87 million, while $BEAT trades around $3.39. This points to a more balanced derivatives market without excessive leverage buildup. Importantly, stable open interest could provide a healthier foundation for future price movements.

Spot Flows Indicate Renewed Investor Interest
Source: CoinGlass

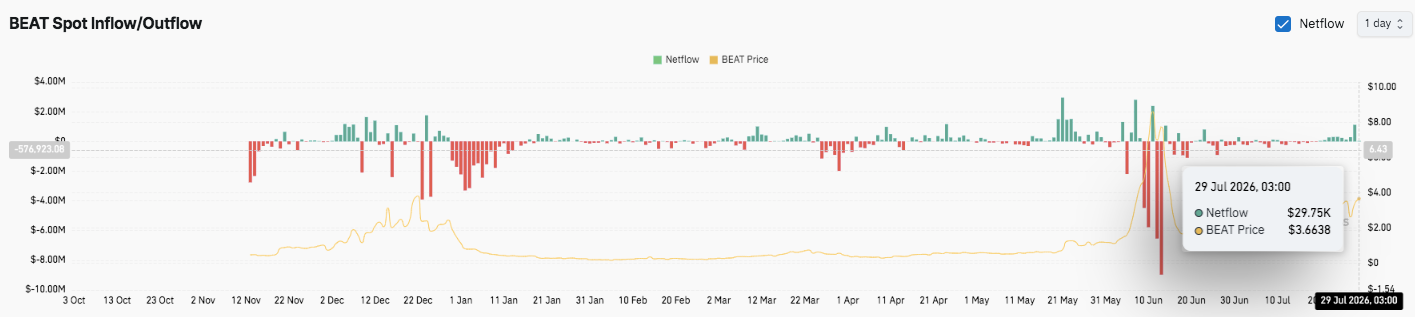
$BEAT's spot inflow and outflow data reveal mixed but improving investor activity. Previous periods recorded significant outflows, indicating profit-taking after the strong rally. Additionally, several large spikes in inflows and outflows occurred during volatile trading sessions in June.

Recently, market activity has become more balanced, with net flows turning slightly positive. The latest data shows an inflow of approximately $29.75 thousand, suggesting renewed accumulation among investors.

Audiera Price Technical Overview

Key levels remain clearly defined for Audiera ($BEAT) as the token attempts to extend its recovery following the June correction.

Upside Levels: $4.68 remains the immediate resistance zone, followed by $5.97 and $7.26, which align with key Fibonacci retracement levels. A decisive breakout above $7.26 could reinforce bullish momentum and open the path to $9.10 and the previous high zone around $11.44.

Downside Levels: $3.08 represents the first major support zone, followed by the 20-day EMA at $2.91 and the 50-day EMA at $2.65. A deeper correction could reveal a broader support area between the 100-day EMA at $2.19 and the 200-day EMA at $1.69.

Resistance Ceiling: The $4.68 level remains a critical barrier for the bulls. A successful daily close above this zone would confirm intensifying buy-side pressure and increase the likelihood of a sustained recovery. However, failure to overcome this resistance could lead to consolidation around current support levels.

Will the Audiera Price Rise?

Audiera's near-term direction hinges on whether buyers can maintain support above the $2.91-$3.08 area while building momentum towards the $4.68 resistance. The recent recovery, improved EMA structure, and balanced derivatives activity point to a gradual improvement in market sentiment. Additionally, modestly positive spot flows suggest renewed investor interest after the June sell-off.

If bullish momentum strengthens and trading volume increases, $BEAT could challenge $5.97 and $7.26 before targeting higher resistance near $9.10. However, losing the $2.91 support would weaken the recovery and increase the risk of a pullback to $2.65 or lower. For now, $BEAT remains in a crucial recovery phase, and technical confirmation coupled with sustained buyer participation will likely determine the next major move.

end-content

Trending Cryptos

Related Questions

QWhat are the current price and recent weekly performance of Audiera (BEAT) according to the article?

AThe current price is around $3.65. Over the past week, it has risen by 40.28%.

QWhat is the immediate key resistance level that BEAT needs to overcome to continue its bullish momentum?

AThe immediate key resistance level is at $4.68, which coincides with the 38.2% Fibonacci retracement level.

QWhat do the Moving Average alignments suggest about the market structure for BEAT?

AThe 20-day EMA ($2.91) is above the 50-day EMA ($2.65), and both are above the 100-day and 200-day EMAs. This alignment indicates that buyers have regained control, signaling an improving medium-term bullish structure.

QHow has the Open Interest for BEAT derivatives changed since June, and what does the current level suggest?

AOpen Interest spiked above $350 million during the June rally but sharply declined afterward. It has since stabilized around $60–120 million, with the latest figure at approximately $81.87 million. This suggests a more balanced derivatives market with less excessive leverage, providing a healthier foundation for future price moves.

QWhat are the two critical short-term support levels for BEAT mentioned in the technical analysis?

AThe first key support level is at $3.08, associated with the 23.6% Fibonacci level. The second is the 20-day Exponential Moving Average at $2.91. A break below $2.91 could weaken market confidence.

Related Reads

Solana Price Forecast for August 2026: Can $19 Million from Morgan Stanley and 330,000 Korean Merchants Break SOL's Triangle?

**Solana Price Forecast for August 2026: Key Catalysts and Technical Setup** As of July 31, Solana (SOL) trades at $73.59, consolidating within a triangle pattern formed between its May peak (~$98) and June low (~$60.29). A decisive breakout from this pattern is anticipated. Key resistance levels are clustered around $74.79 (0.382 Fib), $75.33 (20-day EMA), $76.01 (50-day EMA), and a critical zone near $79 (0.5 Fib & 100-day EMA). Support lies at $73.42, $69.25 (0.236 Fib), and the June low of $60.29. Two major institutional catalysts emerged recently: 1. **Morgan Stanley's MSOL ETF:** Launched July 28, it saw $19.06 million in inflows on its second day—the largest single-day inflow for any US SOL ETF since mid-May. 2. **KSNET Partnership:** The Solana Foundation signed an MoU with South Korean payment processor KSNET (serving 330,000 merchants) to explore integrating Solana Pay for domestic and AI-powered transactions. Historically, August has been volatile for SOL, marked by extreme gains in 2020 and 2021 but otherwise weak performance. The forecast for August 2026 is bifurcated: * **Bullish Case:** An upside triangle breakout, sustained MSOL inflows, and positive momentum from the KSNET news could propel SOL toward the $79 resistance cluster, especially if the CLARITY Act is passed by August 8. * **Bearish Case:** A downside break below $73.42, fading excitement around the new ETF, and stalled regulatory progress could see SOL retest support near $69.25, exacerbated by macro risks.

cryptonews.ru30m ago

Solana Price Forecast for August 2026: Can $19 Million from Morgan Stanley and 330,000 Korean Merchants Break SOL's Triangle?

cryptonews.ru30m ago

Trading

Spot

Hot Articles

How to Buy BEAT

Welcome to HTX.com! We've made purchasing Audiera (BEAT) simple and convenient. Follow our step-by-step guide to embark on your crypto journey.Step 1: Create Your HTX AccountUse your email or phone number to sign up for a free account on HTX. Experience a hassle-free registration journey and unlock all features.Get My AccountStep 2: Go to Buy Crypto and Choose Your Payment MethodCredit/Debit Card: Use your Visa or Mastercard to buy Audiera (BEAT) instantly.Balance: Use funds from your HTX account balance to trade seamlessly.Third Parties: We've added popular payment methods such as Google Pay and Apple Pay to enhance convenience.P2P: Trade directly with other users on HTX.Over-the-Counter (OTC): We offer tailor-made services and competitive exchange rates for traders.Step 3: Store Your Audiera (BEAT)After purchasing your Audiera (BEAT), store it in your HTX account. Alternatively, you can send it elsewhere via blockchain transfer or use it to trade other cryptocurrencies.Step 4: Trade Audiera (BEAT)Easily trade Audiera (BEAT) on HTX's spot market. Simply access your account, select your trading pair, execute your trades, and monitor in real-time. We offer a user-friendly experience for both beginners and seasoned traders.

3.3k Total ViewsPublished 2026.01.22Updated 2026.06.02

How to Buy BEAT

Discussions

Welcome to the HTX Community. Here, you can stay informed about the latest platform developments and gain access to professional market insights. Users' opinions on the price of BEAT (BEAT) are presented below.

活动图片