Analyzing RENDER’s 11% surge: Is the momentum sustainable?

ambcryptoPubblicato 2026-04-03Pubblicato ultima volta 2026-04-03

Introduzione

Render (RENDER) surged 11.23% to $1.91, reaching a three-week high, with trading volume rising 48% to $81.5 million. Derivatives data showed strong bullish sentiment, as Open Interest increased by 21% to $60 million and the Long/Short Ratio rose to 1.28, indicating dominant long positions. However, spot netflow turned positive at $460k, suggesting increased selling pressure as profit-taking resumed. Technical indicators like the RSI at 64 and positive DMI signal strong upward momentum, but if profit-taking intensifies, RENDER could retrace to the $1.6 support level. Breaking the $2 resistance is possible if bullish conditions persist.

Render [RENDER] continued with its bullish streak, breaking out of the recent downtrend and summiting a three-week high of $1.92.

As of this writing, RENDER traded at $1.91, up 11.23% on the daily charts, adding to its 6% weekly gains. Over the same period, the altcoin’s volume rose 48% to $81.5 million, reflecting increased market participation.

RENDER speculators take hold of the market

While the market continued to suffer from reduced liquidity, RENDER has shown solid strength, consistent with active market participation.

On the derivatives side in particular, RENDER has experienced sustained demand for Futures positions. CoinGlass data showed that altcoin Open Interest rose 21% to $60 million, while derivatives volume climbed 35% to $128 million.

Source: CoinGlass

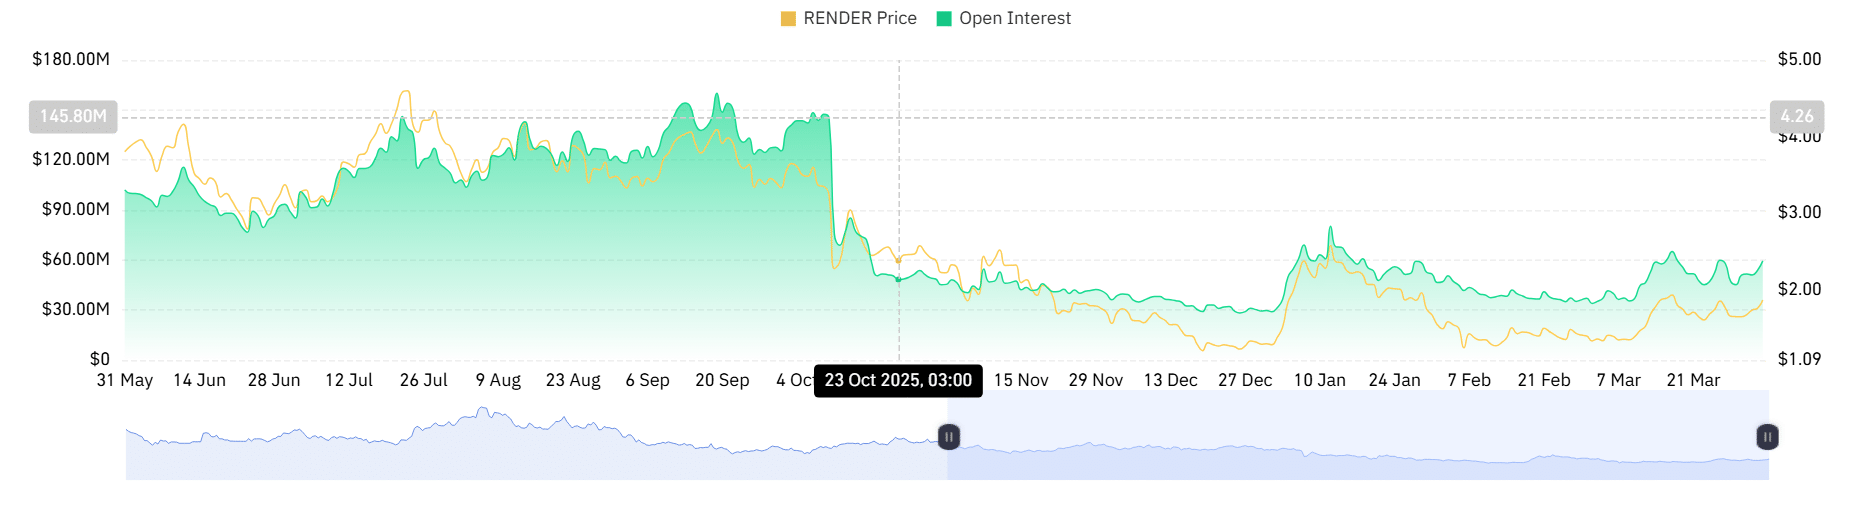
Such a jump in OI and Volume showed increased Futures market participation and steady capital inflows. In fact, over $9 million flowed into the futures positions over the past eight hours as of the 3rd of April.

Meanwhile, the altcoin’s Long/Short Ratio rose to 1.28, signaling a higher demand for long positions. As such, longs accounted for 56%, while shorts accounted for 43% of the total Futures positions.

Source: Coinalyze

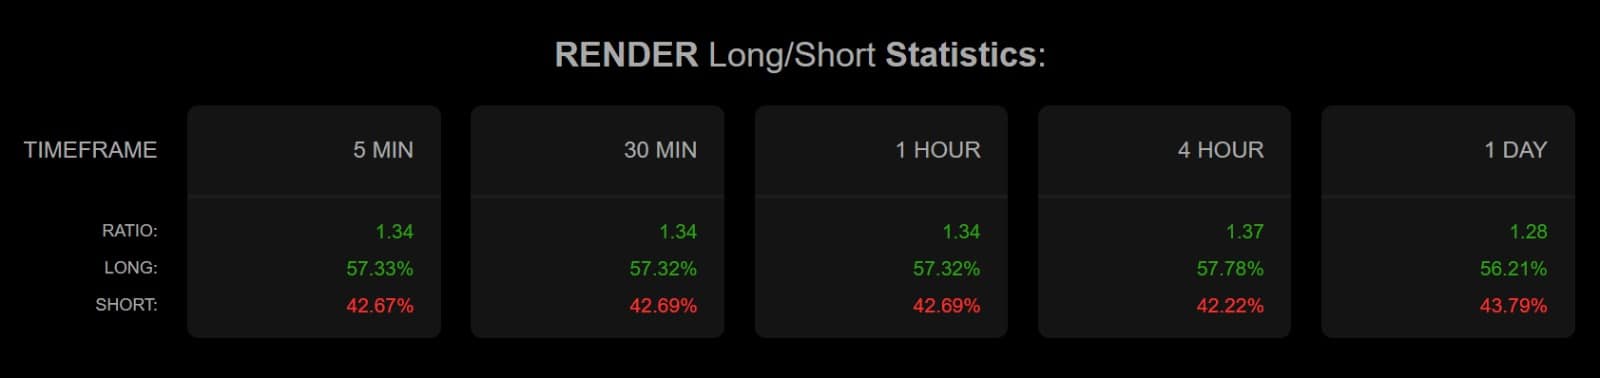
When longs dominate, it suggests that most participants were bullish and aggressively positioned for more gains.

Profit takers return to the market

With RENDER reaching a three-week high, holders who have been underwater rushed to cash out.

Looking at exchange activity, Spot Netflow turned positive after being negative for two consecutive days. At press time, Netflow was $460k, a significant reversal from -$507 the previous day.

Source: CoinGlass

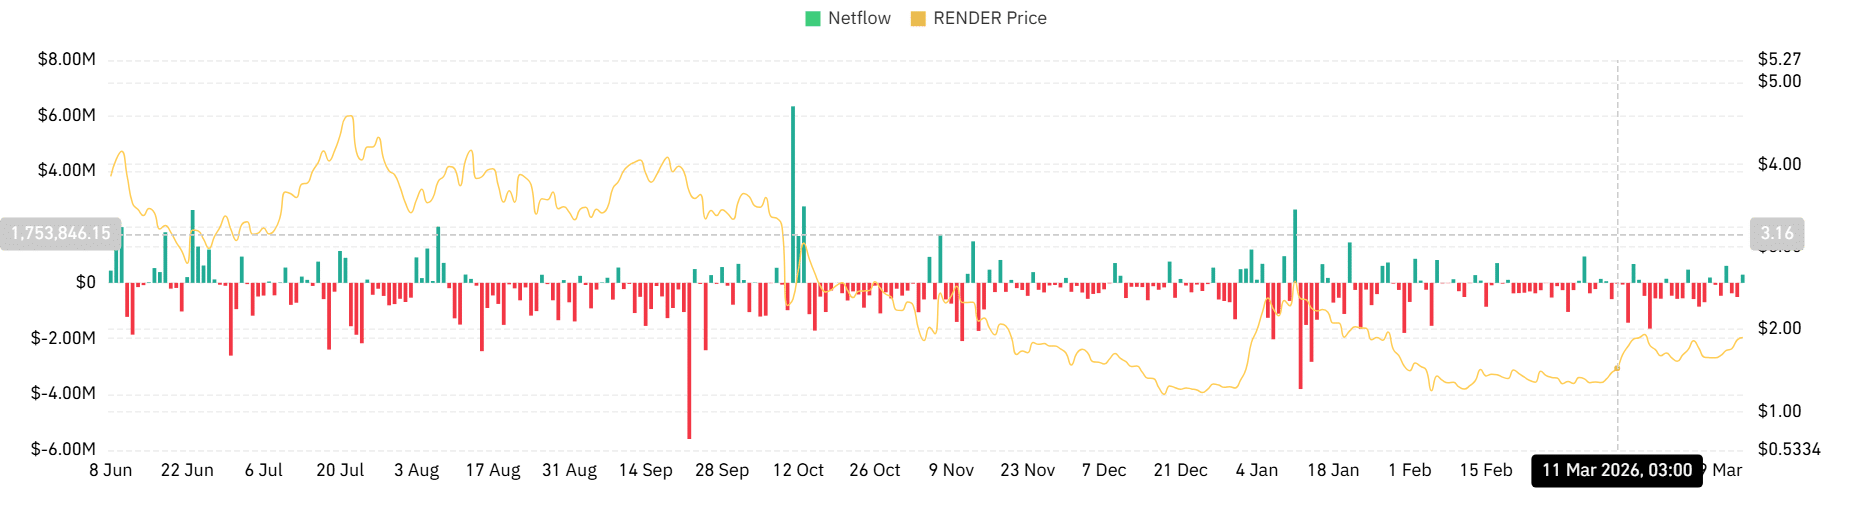
A positive netflow implied that the market saw more sellers than buyers. Such a shift in market behavior has historically weakened the market and led to pullbacks. Thus, extended profit realization could threaten recent gains and cause another slip.

Can the upside momentum hold?

RENDER has recorded a sustained week-long bullish momentum since it held the $1.6 support level. Buyers continually stepped in and defended higher price levels.

The altcoin’s Relative Strength Index (RSI) rose to 64, signaling strong upside momentum and buyer control of the market.

At the same time, the positive index of the Directional Movement Index (DMI) climbed to 27 while the negative index fell to 11. The rise in these two momentum indicators indicated strong upside momentum and confirmed the trend’s strength.

Source: Tradingview

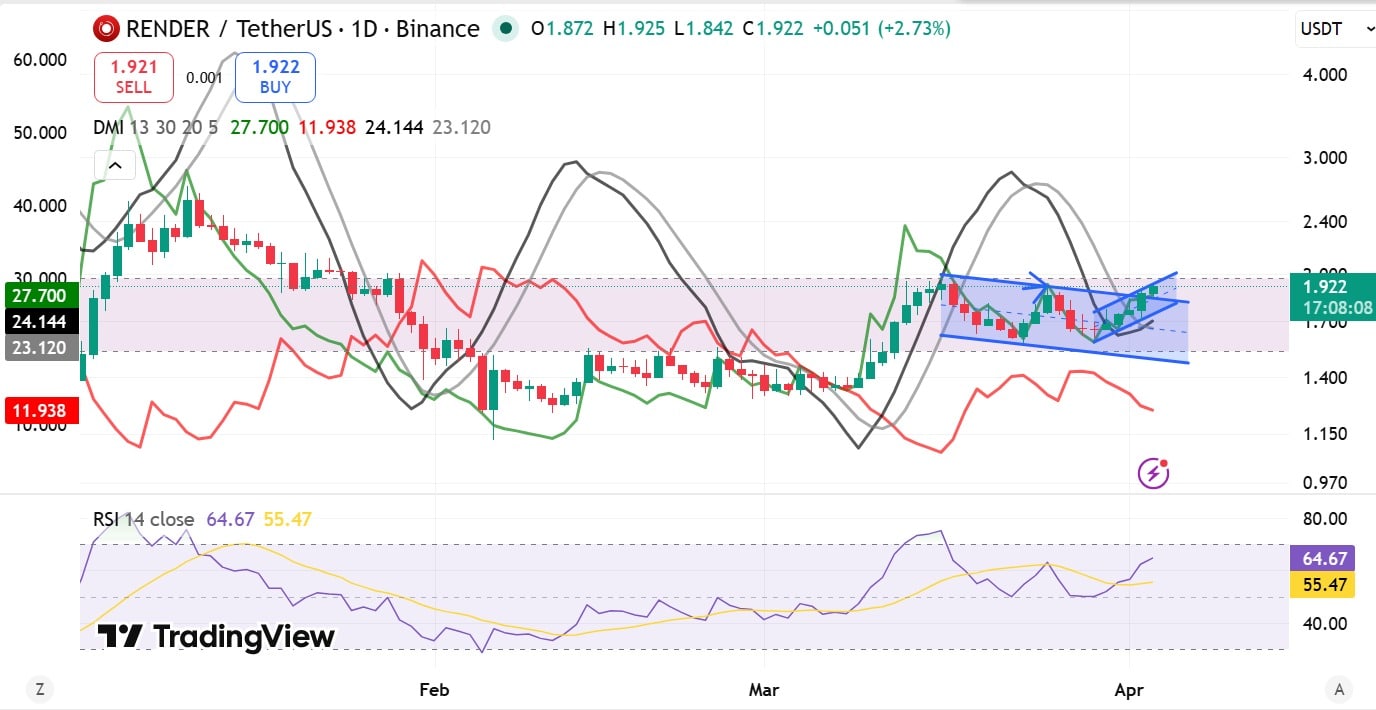
Therefore, the two signals indicate a potential continuation of the market demand trend. While profit takers remain active, their positioning is still not strong enough.

If the prevailing market conditions hold, RENDER could flip its immediate resistance at $2. However, if profit-taking accelerates and overwhelms demand, the altcoin could retrace to $1.6.


Final Summary

  • RENDER surges 11%, touching a three-week high of $1.92 amid sustained demand.
  • RENDER has shown strong upside momentum amid sustained short-term demand, but profit-takers’ return risks capping market gains.

Domande pertinenti

QWhat was the price of RENDER and its percentage gain as mentioned in the article?

ARENDER traded at $1.91, up 11.23% on the daily charts.

QWhat does the Long/Short Ratio of 1.28 for RENDER indicate about market sentiment?

AA Long/Short Ratio of 1.28 signals a higher demand for long positions, with longs accounting for 56% of total Futures positions, indicating that most participants were bullish and positioned for more gains.

QWhat does a positive Spot Netflow value imply for the RENDER market?

AA positive Spot Netflow value of $460k implies that there were more sellers than buyers, which historically weakens the market and can lead to pullbacks due to profit realization.

QWhat key support level did RENDER hold to maintain its week-long bullish momentum?

ARENDER held the $1.6 support level, which allowed buyers to continually step in and defend higher price levels, sustaining the bullish momentum.

QAccording to the article, what are the two potential price scenarios for RENDER depending on market conditions?

AIf prevailing market conditions hold, RENDER could flip its immediate resistance at $2. However, if profit-taking accelerates and overwhelms demand, it could retrace to $1.6.

Letture associate

The Trillion-Yuan Market Cap 'Yi Zhong Tian': Who is the True Value King?

The article analyzes the three leading Chinese optical module companies, collectively nicknamed "Yi Zhong Tian": Xinyisheng, Zhongji Innolight, and TFC Optical Communication. It evaluates their "cost-performance" not by current stock price, but through three lenses: PEG ratio (growth vs. valuation), earnings quality, and premium/discount for certainty. Xinyisheng shows the most attractive PEG ratio and high profitability, but its valuation reflects discounts for risks like high customer concentration and reliance on overseas markets. Zhongji Innolight, the most expensive, commands a premium for its market leadership, dominant share in key products like 800G/1.6T modules, and higher earnings certainty, though it faces geopolitical risks. TFC Optical, as an upstream component supplier ("water seller"), has the highest gross margin and bets on the long-term CPO/NPO architecture trend, but trades at a high valuation with more stable, less explosive growth. The core argument is that while these companies dominate module assembly, the true profit pool and technological moat lie upstream in laser and switch chips, currently controlled by U.S. firms like Lumentum and Coherent. The long-term "cost-performance" for these Chinese leaders hinges on whether the domestic industry, exemplified by companies like Yuanjie Technology, can successfully move up the value chain into high-power laser chips. Otherwise, their high growth may remain confined to the lower-margin assembly segment.

marsbit2 min fa

The Trillion-Yuan Market Cap 'Yi Zhong Tian': Who is the True Value King?

marsbit2 min fa

Has the Crypto Market Bottomed? Here's What Institutions Think

The crypto market is in a period of significant debate, with leading institutions offering differing views on whether a bottom has been reached. Three prominent firms have published detailed analyses: * **Galaxy Digital** argues Bitcoin has **not yet bottomed**. Their analysis of 13 historical indicators across six dimensions (valuation, profit-taking, miner pressure, etc.) shows only four are fully met. They project a potential bottom range between $30k and $54k. * **NYDIG** states a bottom is **possible but not likely**. While metrics are close to historic bear market extremes, they note the absence of a classic panic-selling event. They also suggest increased institutional adoption may have structurally altered the market cycle, potentially leading to a shallower downturn. * **Standard Chartered Bank** asserts the **bottom has already occurred** at around $59k. They cite two key factors: potential US-Iran diplomatic progress and the anticipated SpaceX IPO, which they believe absorbed capital and caused ETF selling pressure that is now subsiding. They forecast a year-end price target of $100k. Despite the surface-level disagreement, the reports share critical common ground more valuable for long-term investors: 1. All three believe the market bottom will form **within this year**. 2. All agree the current price is **closer to the bottom than to previous highs**. 3. All maintain a **bullish long-term outlook** for Bitcoin and a new cycle. The core takeaway is that while the exact bottom price ($40k, $50k, or $60k) is debated, the consensus is that a bottom is imminent. For long-term holders, the primary focus should not be pinpointing the absolute low, but on the future potential for prices to reach $100k, $200k, or higher. The fundamental thesis for Bitcoin—sovereign debt accumulation, inflation, declining trust in centralized institutions, global digitization, and improved accessibility—remains intact and is arguably strengthening. The overall landscape is viewed as more favorable than in previous crypto winters.

marsbit13 min fa

Has the Crypto Market Bottomed? Here's What Institutions Think

marsbit13 min fa

The 'Chip' Challenge and Breakthroughs in China's Optical Industry Chain

China's Photonics Industry: Bottlenecks and Breakthroughs In the global AI race, computing chips dominate the narrative, but the underlying bottleneck increasingly defining the scale of AI clusters is light—or more specifically, optical connectivity. Optical modules, which translate electrical signals to light and vice versa, are crucial for connecting thousands of GPUs in AI data centers, preventing data congestion and ensuring efficient model training. High-speed modules (800G, 1.6T) are now standard, with performance hinging on advanced DSP (Digital Signal Processor) chips. This is where a critical dependency lies. Two US giants—Marvell and Broadcom—collectively dominate over 90% of the high-end DSP chip market. Chinese optical module leaders like Zhongji Innolight and Eoptolink rely on these chips to manufacture modules for overseas AI customers, primarily in North America. While this creates a supply chain vulnerability, complete decoupling is difficult. Marvell derives over half its revenue from Greater China, and the US firms depend on Chinese partners for chip packaging and optical components. The risk from laser chips (e.g., from Lumentum), another key component, is considered more manageable due to multiple global suppliers and faster progress in domestic alternatives from companies like YOFC and Accelink. To mitigate risks, China's industry is pursuing a multi-pronged strategy: diversifying supply chains and locking in long-term orders; fostering a domestic market ecosystem to adopt homegrown DSPs from firms like Huawei HiSilicon and CETC; accelerating R&D in high-speed DSPs and advanced packaging; and investing in next-gen technologies like silicon photonics and Co-Packaged Optics (CPO) to reduce reliance on discrete DSPs. The ultimate solution lies not in short-term博弈 but in persistent advancement of domestic high-end chip R&D and manufacturing. While challenges remain in performance, certification, and ecosystem building, China's vast domestic market and manufacturing base provide a crucial buffer, buying time for the industry to achieve greater technological independence.

marsbit26 min fa

The 'Chip' Challenge and Breakthroughs in China's Optical Industry Chain

marsbit26 min fa

Behind SpaceX's $2 Trillion Market Cap: Why Does Musk Always Have the Next Move Planned?

On June 12th, SpaceX debuted on the Nasdaq, reaching a valuation that briefly touched $2 trillion. This marked the culmination of a 24-year journey from its founding in 2002, driven by Elon Musk's frustration at the high cost of buying rockets. The company's path was defined by early failures, with its first three Falcon 1 launches ending in explosions before a successful 2008 flight opened the era of commercial spaceflight. Key to its model was a fixed-price NASA contract, incentivizing cost reduction. SpaceX mastered rocket reusability, first achieving a Falcon 9 landing in 2015, which drastically cut launch costs. This enabled its profitable Starlink satellite internet constellation, envisioned years before reusability was proven, to create an internal market for frequent launches. Similarly, the next-generation Starship rocket was in development long before its first flight, with its business case evolving from Mars colonization to supporting the emerging concept of in-orbit data centers for AI—a story now central to its valuation. The company's recent IPO, a reversal of its long-standing "no IPO" stance, is funding this ambitious "space-based compute" vision. While major tech players like Google, Blue Origin, and others are investing heavily, significant technical and cost hurdles remain. Ultimately, SpaceX's history is one of creating its own demand: first with Starlink and now with space-based AI compute, betting that its next rocket will enable its next giant market.

marsbit29 min fa

Behind SpaceX's $2 Trillion Market Cap: Why Does Musk Always Have the Next Move Planned?

marsbit29 min fa

Trading

Spot
Futures

Articoli Popolari

Come comprare RENDER

Benvenuto in HTX.com! Abbiamo reso l'acquisto di RenderToken (RENDER) semplice e conveniente. Segui la nostra guida passo passo per intraprendere il tuo viaggio nel mondo delle criptovalute.Step 1: Crea il tuo Account HTXUsa la tua email o numero di telefono per registrarti il tuo account gratuito su HTX. Vivi un'esperienza facile e sblocca tutte le funzionalità,Crea il mio accountStep 2: Vai in Acquista crypto e seleziona il tuo metodo di pagamentoCarta di credito/debito: utilizza la tua Visa o Mastercard per acquistare immediatamente RenderTokenRENDER.Bilancio: Usa i fondi dal bilancio del tuo account HTX per fare trading senza problemi.Terze parti: abbiamo aggiunto metodi di pagamento molto utilizzati come Google Pay e Apple Pay per maggiore comodità.P2P: Fai trading direttamente con altri utenti HTX.Over-the-Counter (OTC): Offriamo servizi su misura e tassi di cambio competitivi per i trader.Step 3: Conserva RenderToken (RENDER)Dopo aver acquistato RenderToken (RENDER), conserva nel tuo account HTX. In alternativa, puoi inviare tramite trasferimento blockchain o scambiare per altre criptovalute.Step 4: Scambia RenderToken (RENDER)Scambia facilmente RenderToken (RENDER) nel mercato spot di HTX. Accedi al tuo account, seleziona la tua coppia di trading, esegui le tue operazioni e monitora in tempo reale. Offriamo un'esperienza user-friendly sia per chi ha appena iniziato che per i trader più esperti.

226 Totale visualizzazioniPubblicato il 2024.12.11Aggiornato il 2026.06.02

Come comprare RENDER

Discussioni

Benvenuto nella Community HTX. Qui puoi rimanere informato sugli ultimi sviluppi della piattaforma e accedere ad approfondimenti esperti sul mercato. Le opinioni degli utenti sul prezzo di RENDER RENDER sono presentate come di seguito.

活动图片