Monad surges 15% – But resistance now decides MON’s next move

ambcryptoPublished on 2026-03-26Last updated on 2026-03-26

Abstract

Monad (MON) surged 15% with trading volume up over 75%, pushing the price toward a key resistance level around $0.0248. The token rebounded from recent lows near $0.02039, showing signs of accumulation and buyer interest. The RSI at 61.38 indicates sustained bullish momentum without being overbought. However, exchange inflows of $684K suggest potential selling pressure as price tests resistance. Binance top traders maintain a strong long bias (57.01% long positions), supporting upside potential but increasing vulnerability to a reversal. A break above $0.0248 could target $0.0300, while failure may lead to a pullback toward support.

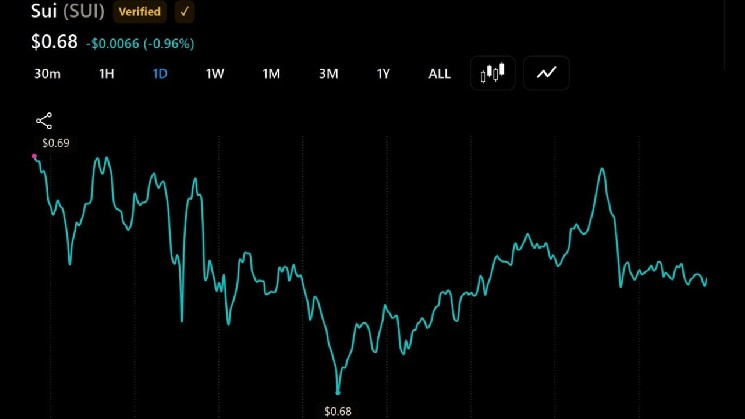
Monad [MON] has surged 15% while trading volume spiked over 75%, reflecting strong participation as price advanced toward resistance. Monad traded around $0.02512 after rebounding from recent lows, showing clear upward intent.

This move follows a steady recovery from consolidation near $0.02039, where buyers repeatedly stepped in. As a result, price action now reflects strengthening demand rather than random spikes.

However, the advance now meets a key reaction zone, where prior selling pressure has emerged. This positioning creates a critical moment, as rising activity aligns with MON testing resistance.

The current structure suggests strength, yet the reaction at this zone would define whether continuation holds or stalls.

Can MON break above this supply zone?

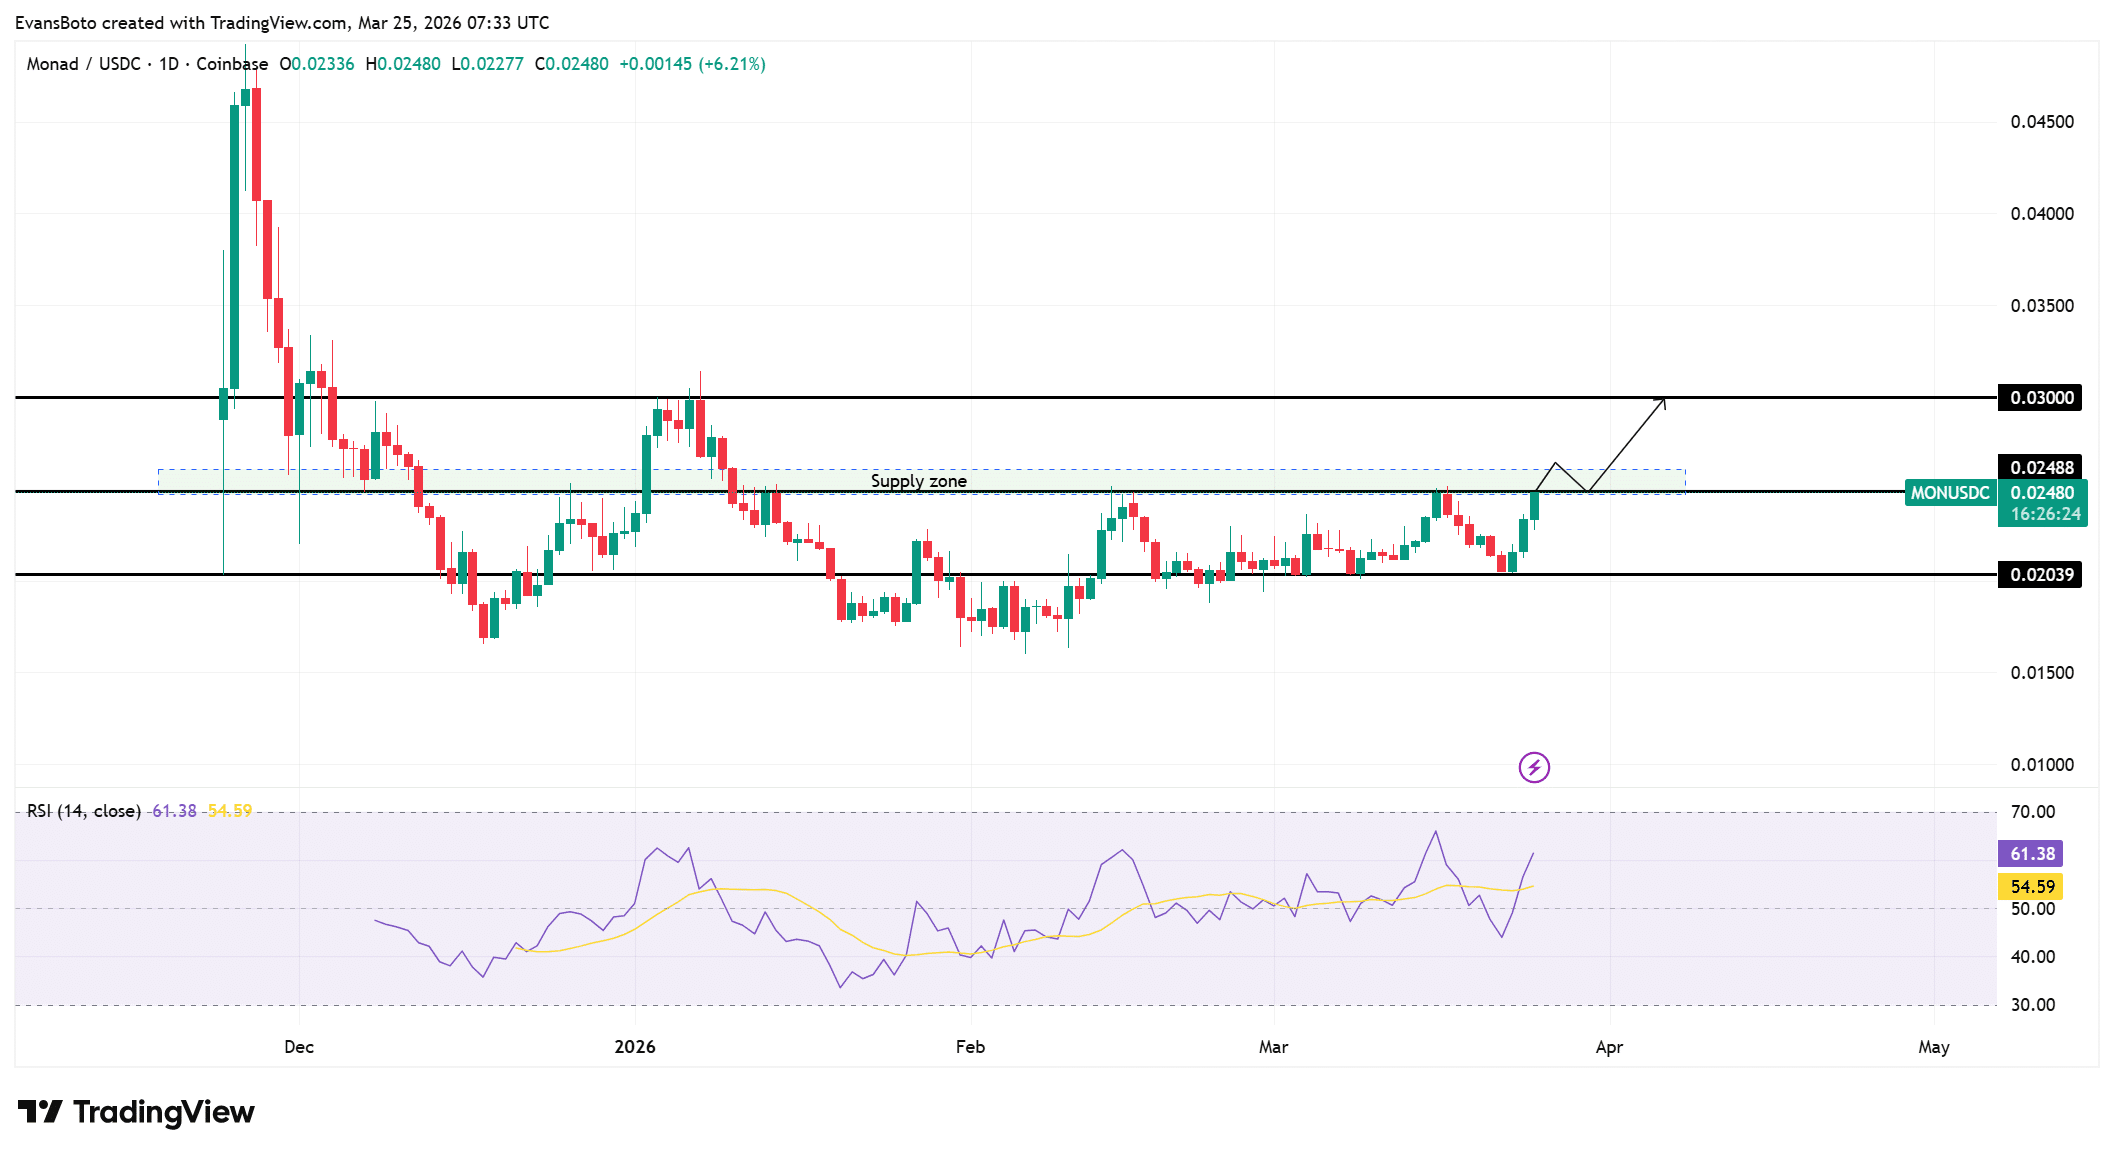
MON has reclaimed the $0.02039 support and continues printing higher lows, signaling controlled accumulation.

It now presses directly into the $0.0248 supply zone, where rejection has previously occurred. This structure shows compression beneath resistance, which often precedes expansion if buyers sustain pressure.

However, repeated tests without a breakout could weaken buyers. A clean move above $0.0248 would expose the $0.0300 level, which stands as the next visible resistance.

Until that happens, price remains inside a contested zone. The way price behaves here matters more than the move itself.

Sustained closes above this zone would confirm strength, while hesitation could invite renewed selling pressure from this level.

The RSI was around 61.38 at the time of writing, holding firmly above the midline and reflecting sustained buyer control.

It has maintained this position after gradually climbing from lower levels, showing structured strength rather than sharp spikes.

This behavior suggests buyers continue to support price during minor pullbacks. However, RSI remains below overbought territory, which leaves room for further upside attempts.

Source: TradingView

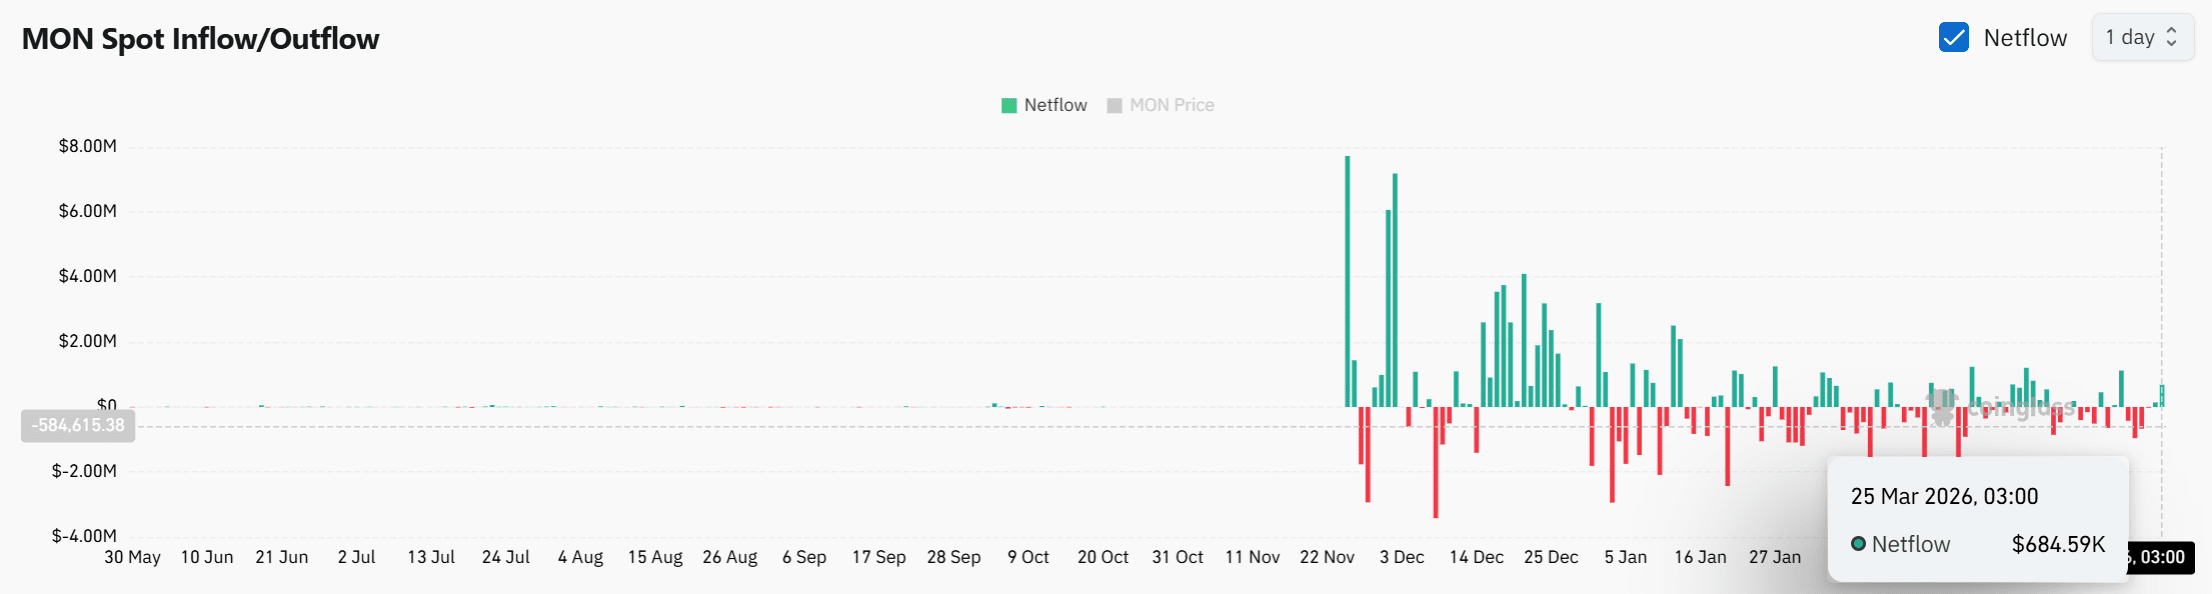
Exchange inflows rise as netflows turn positive

Recent netflow data shows a +$684K inflow, indicating tokens are moving back onto exchanges. This shift introduces a different dynamic compared to earlier phases, where outflows dominated.

As price approaches resistance, rising inflows suggest participants may prepare to distribute holdings.

This behavior often appears near key levels where traders reassess positions. However, inflows alone do not confirm selling pressure unless sustained over time.

The timing of this inflow matters, as it coincides with price testing supply. If inflows continue rising, sell-side availability would increase.

If they stabilize, the impact may remain limited. At present, netflows reflect a cautious shift rather than outright distribution.

Source: CoinGlass

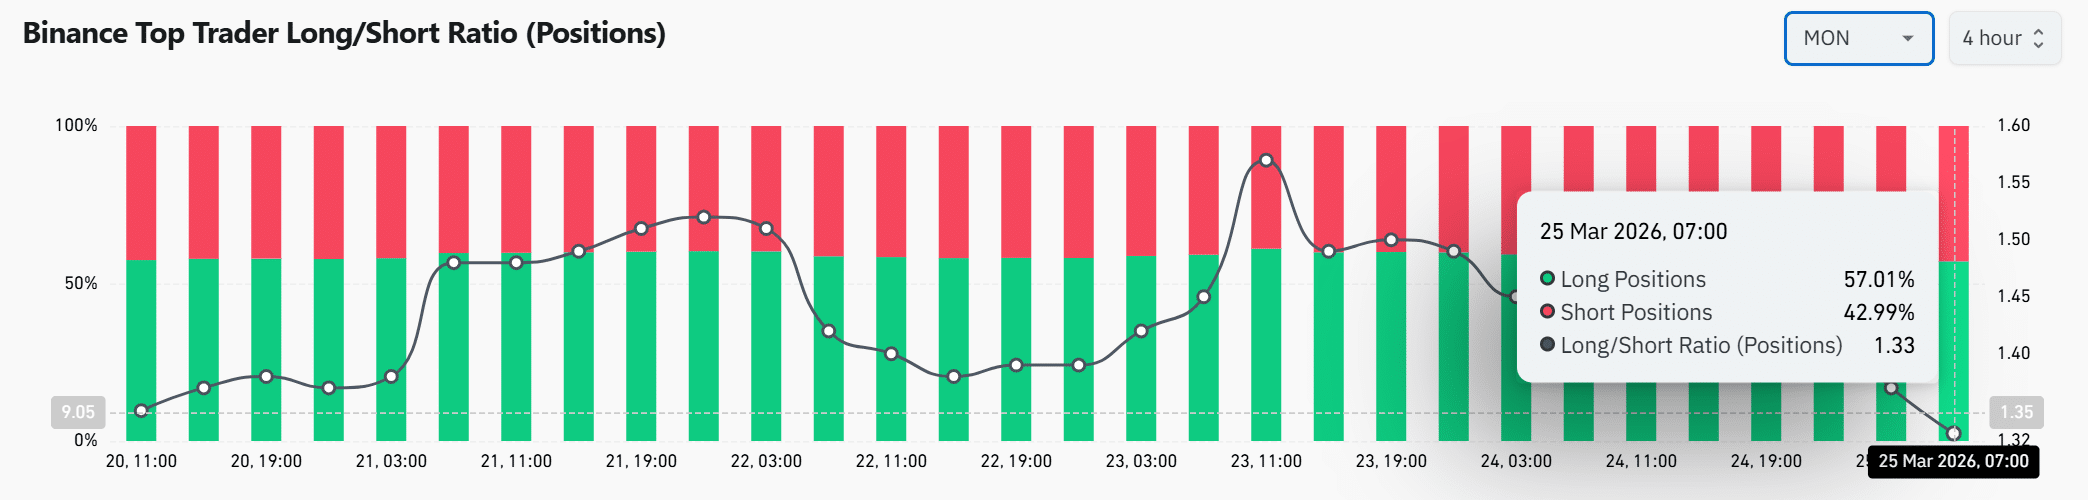
Long bias holds as traders position aggressively

Binance top traders maintain a clear long bias, with long positions at 57.01% and a Long/Short Ratio near 1.33.

This positioning reflects strong directional conviction toward upside continuation. It shows traders continue building exposure even as price tests resistance.

However, elevated long positioning introduces sensitivity to sudden reversals. If price fails to break higher, these positions could unwind quickly. This dynamic creates a leveraged environment where price moves may accelerate in either direction.

The alignment between Spot strength and derivatives positioning supports the current advance.

Still, crowded positioning increases risk if sentiment shifts. At this stage, traders remain confident, yet the setup demands confirmation from price action.

Source: CoinGlass

Can MON sustain this move higher?

MON can sustain this move higher only if it secures acceptance above the $0.0248 supply zone with continued buyer support.

RSI strength and dominant long positioning support continuation. However, rising exchange inflows introduce near-term selling risk.

If buyers maintain control and absorb supply, price would likely advance toward $0.0300; otherwise, rejection would trigger a controlled pullback toward $0.02039 support.


Final Summary

  • Sustained strength above resistance would validate continuation, but rising exchange inflows could disrupt bullish structure near-term.
  • Trader positioning remains heavily long, which could accelerate upside if confirmed or trigger sharp downside if invalidated.

Related Questions

QWhat is the current price of Monad (MON) and what key resistance level is it testing?

AMonad (MON) is currently trading around $0.02512 and is testing the key resistance/supply zone at $0.0248.

QWhat does the recent +$684K netflow indicate for MON's price action near resistance?

AThe recent +$684K netflow indicates that tokens are moving back onto exchanges, which suggests participants may be preparing to distribute their holdings. This introduces potential selling risk as the price tests a key supply zone.

QWhat is the Long/Short Ratio of Binance top traders and what does it signify?

ABinance top traders have a Long/Short Ratio of approximately 1.33, with long positions at 57.01%. This reflects a clear long bias and strong directional conviction toward further price appreciation.

QWhat is the significance of the RSI level at 61.38 for MON's price movement?

AAn RSI of 61.38 indicates sustained buyer control and structured strength, as it is firmly above the midline but not yet in overbought territory. This leaves room for further upside attempts.

QWhat are the two potential price targets mentioned if MON breaks above or gets rejected at the $0.0248 resistance?

AIf MON breaks above the $0.0248 resistance, the next target is the $0.0300 level. If it gets rejected, a controlled pullback toward the $0.02039 support level is likely.

Related Reads

OpenAI's Hyperliquid Pre-IPO Pricing Venture: Why Did It Last Only Half a Year?

The article discusses the rise and fall of Pre-IPO pricing markets on the Hyperliquid blockchain. Trade.xyz, an anonymous team, successfully built the largest pre-market for SpaceX (SPCX) by launching a contract with a clear anchor: the eventual Nasdaq listing price. This provided inherent price stability and validation. In contrast, Ventuals, a team backed by Paradigm, failed despite holding exclusive contracts for highly sought-after companies like OpenAI and Anthropic. Its key mistake was its pricing mechanism. For companies with no near-term IPO date, Ventuals' oracle relied partly on opaque private market transactions and, critically, partly on its own contract's moving average price. This created a self-referential feedback loop where prices were artificially propped up and detached from genuine supply and demand, leading to illiquid markets. Ventuals shut down after nine months, settling positions at final prices of $1,341.80 for OpenAI and $1,618.90 for Anthropic. Ironically, some employees and late-stage investors of these very companies reportedly used these flawed Ventuals prices for valuation reference, highlighting the acute demand for any price signal in illiquid private markets. The article concludes that while demand for pre-IPO trading is real and growing, with players like Coinbase now entering the space, the fundamental challenge remains: without a public listing to provide a definitive price anchor, these markets struggle to establish truly accurate and liquid pricing. The need for a transparent, self-correcting market is the critical lesson from Ventuals' failure.

marsbit14m ago

OpenAI's Hyperliquid Pre-IPO Pricing Venture: Why Did It Last Only Half a Year?

marsbit14m ago

With Daily Active Users Reaching 3-4 Times That of the Industry's Second Place, Which Crack in the Office Agent Market Has Tencent's WorkBuddy Torn Open?

Tencent's AI office assistant, WorkBuddy, has achieved daily active users (DAU) 3-4 times that of the industry's second-place product, primarily driven by non-technical users like HR, operations, and administrative staff. Its rapid growth, starting with a public beta in March 2026, highlights a key strategic divergence from competitors like OpenAI's Codex and Anthropic's Claude Code. Unlike those tools, which originated as developer-focused assistants (in command lines or IDEs) and are now expanding towards office scenarios, WorkBuddy was built from the ground up for non-technical office workers. Its development was user-driven, initiated after腾讯云's team observed non-technical employees using their CodeBuddy coding tool for general tasks. WorkBuddy's design is defined by three core decisions aimed at lowering barriers: 1) Using natural language instead of technical concepts, so users describe their goal without needing to understand prompts or agents. 2) Providing pre-packaged "Skill" templates for common office tasks like data processing, content creation, and research. 3) Natively integrating into existing腾讯 ecosystems like腾讯 Docs and WeChat, making the agent a seamless part of the user's workflow rather than a separate tool. This "scenario encapsulation" approach, prioritizing the shortest path for users to get work done, contrasts with the "underlying capability" focus of Codex and Claude, which offer more flexibility but require more technical setup. Analysts confirm WorkBuddy's leading market position in China by mid-2026, with massive user and request growth following its launch. Recognizing the same trend of surging non-technical adoption, OpenAI and Anthropic are now pivoting their products with features like role-based plugins (Codex) and a simplified desktop interface (Claude Cowork). However, adapting tools built for developers requires significant changes to interaction models and integrations. WorkBuddy currently holds an estimated six-month lead in delivering a complete solution for non-technical office users. Its recently launched enterprise version aims to solidify this advantage. The competition underscores two valid paths: embedding agent capabilities directly into familiar work environments versus building powerful, general-purpose agents that users must learn to access. WorkBuddy's early success demonstrates the effectiveness of the former strategy for mainstream office adoption.

marsbit23m ago

With Daily Active Users Reaching 3-4 Times That of the Industry's Second Place, Which Crack in the Office Agent Market Has Tencent's WorkBuddy Torn Open?

marsbit23m ago

Dalio's Latest Warning: Don't Get Carried Away by AI, Real Returns on US Stocks in the Next 5-10 Years Could Be -5% to -10%

Ray Dalio, founder of Bridgewater Associates, warns investors against excessive concentration in AI stocks. He argues the current market, dominated by a few AI giants, mirrors historical patterns where revolutionary new technologies lead to high risk, volatility, and uncertainty. While acknowledging AI's transformative potential, Dalio emphasizes that most investors fail at this stage of the cycle by over-concentrating in a handful of leading companies. He cites inherent risks: companies cannot accurately forecast investment needs or external shocks (e.g., monetary policy, geopolitics, taxes), face potential disruption from future technologies and international competition (notably from China), and experience significant price swings. Dalio's core advice is diversification, calling it his "Holy Grail of Investing." He presents a mathematical case that a well-diversified portfolio of 15-20 uncorrelated, good bets offers a superior risk-adjusted return compared to a concentrated position. Dalio also offers a cautious outlook, suggesting U.S. stocks may deliver real returns of -5% to -10% over the next 5-10 years based on valuation and bubble indicators. He concludes that in the face of high uncertainty, the prudent strategy is not to avoid betting entirely, but to avoid large, concentrated bets where one lacks sufficient informational edge. Instead, investors should build a strategically balanced, diversified portfolio.

marsbit1h ago

Dalio's Latest Warning: Don't Get Carried Away by AI, Real Returns on US Stocks in the Next 5-10 Years Could Be -5% to -10%

marsbit1h ago

Trading

Spot
Futures

Hot Articles

Discussions

Welcome to the HTX Community. Here, you can stay informed about the latest platform developments and gain access to professional market insights. Users' opinions on the price of S (S) are presented below.

活动图片