Executive Summary
- Bitcoin’s realized cap reaches the $1 Trillion mark for the first time. This is truly a monumental milestone for Bitcoin, highlighting its deep liquidity profile, and growing relevance on the macro stage.
- All altcoin sectors are now outperforming Bitcoin across the last week, led most notably by Ethereum. This has resulted in an Altcoin Market Cap increase of +$216B over the past two weeks.
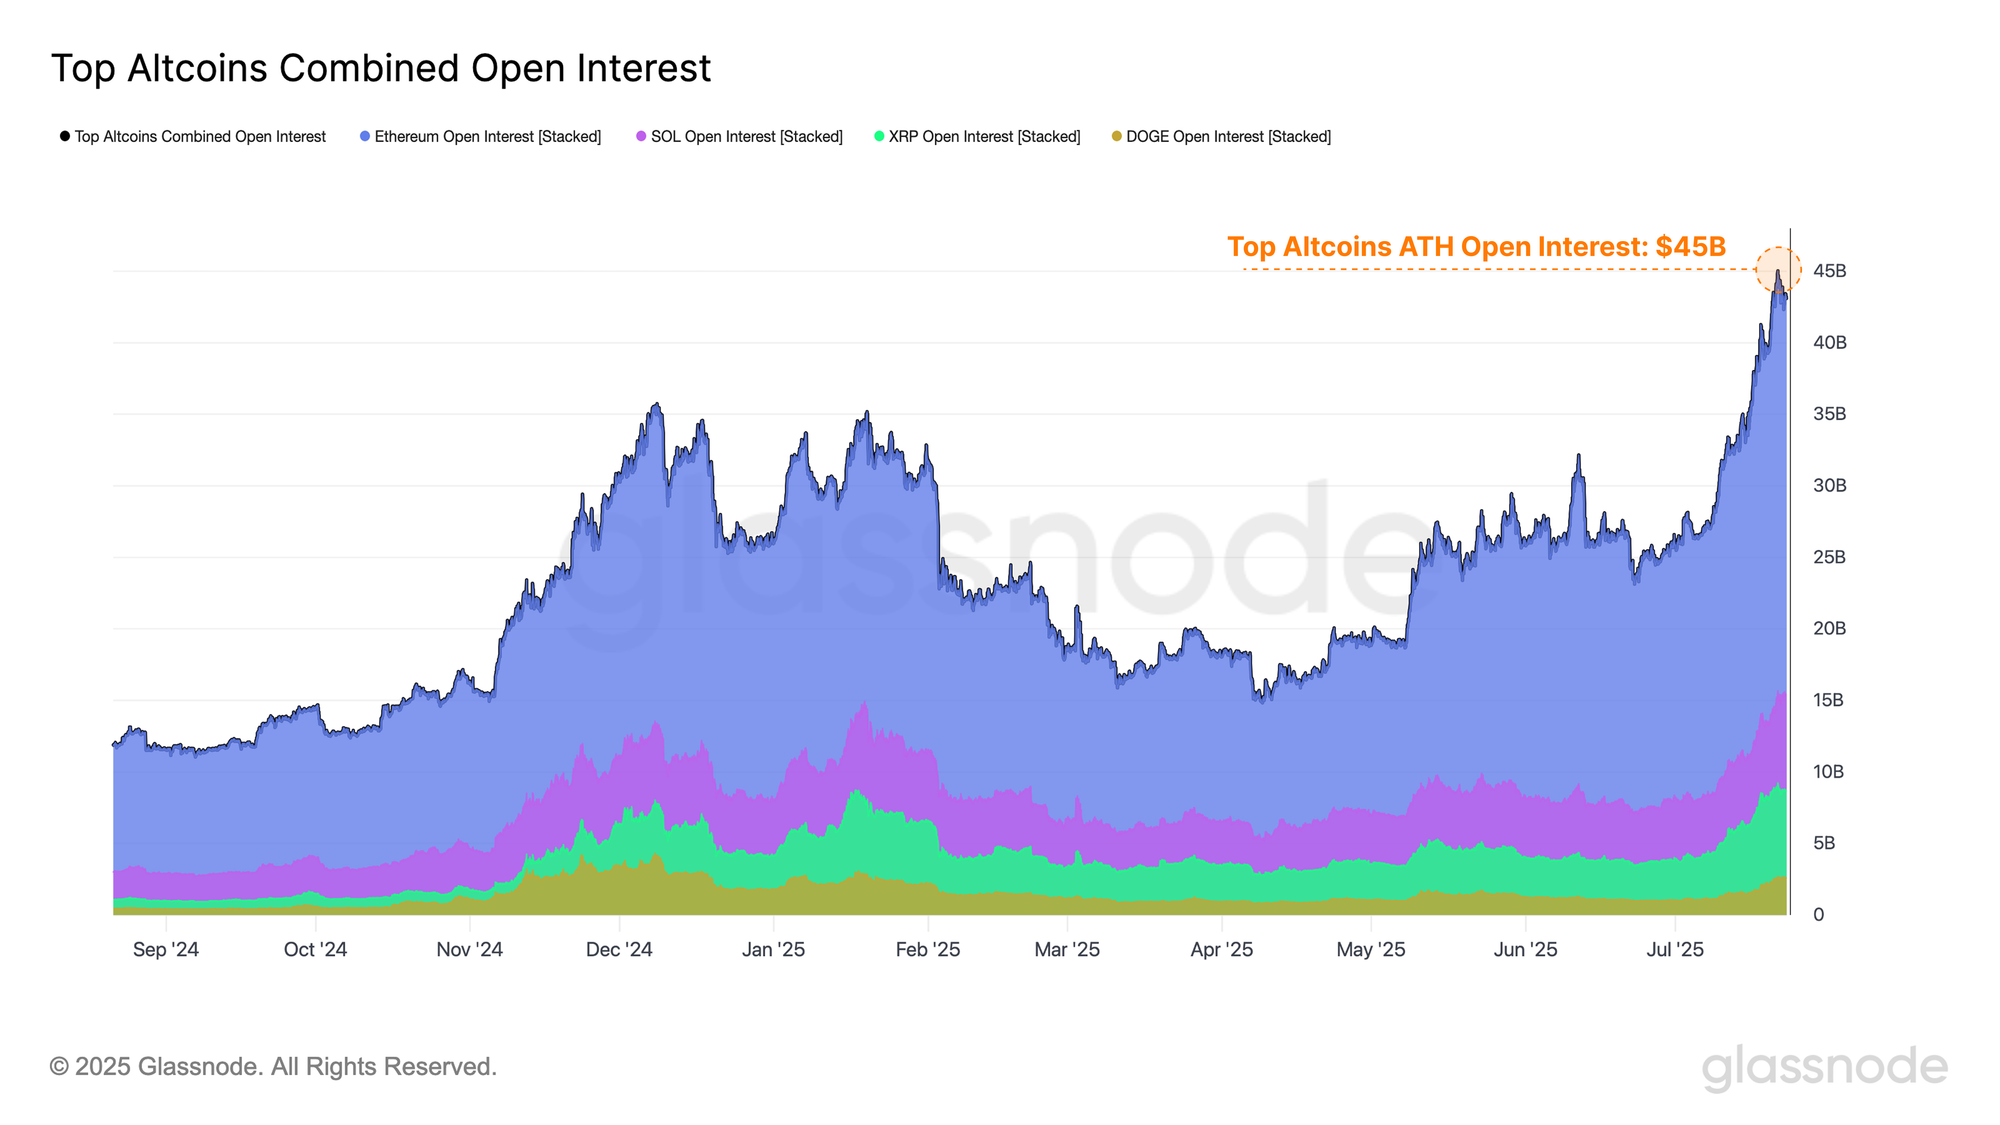
- Open interest across the top altcoins has surged higher from $26B to $44B across the month of July. Elevated leverage tends to amplify both upside and downside volatility, and can contribute to a more reflexive and fragile market environment.
- Ethereum has decisively broken through many key on-chain resistance levels including the Active Investor Price and True Market Mean. However, a substantial uptick in sell-side pressure is expected around the $4.5k region.
A Trillion Dollars
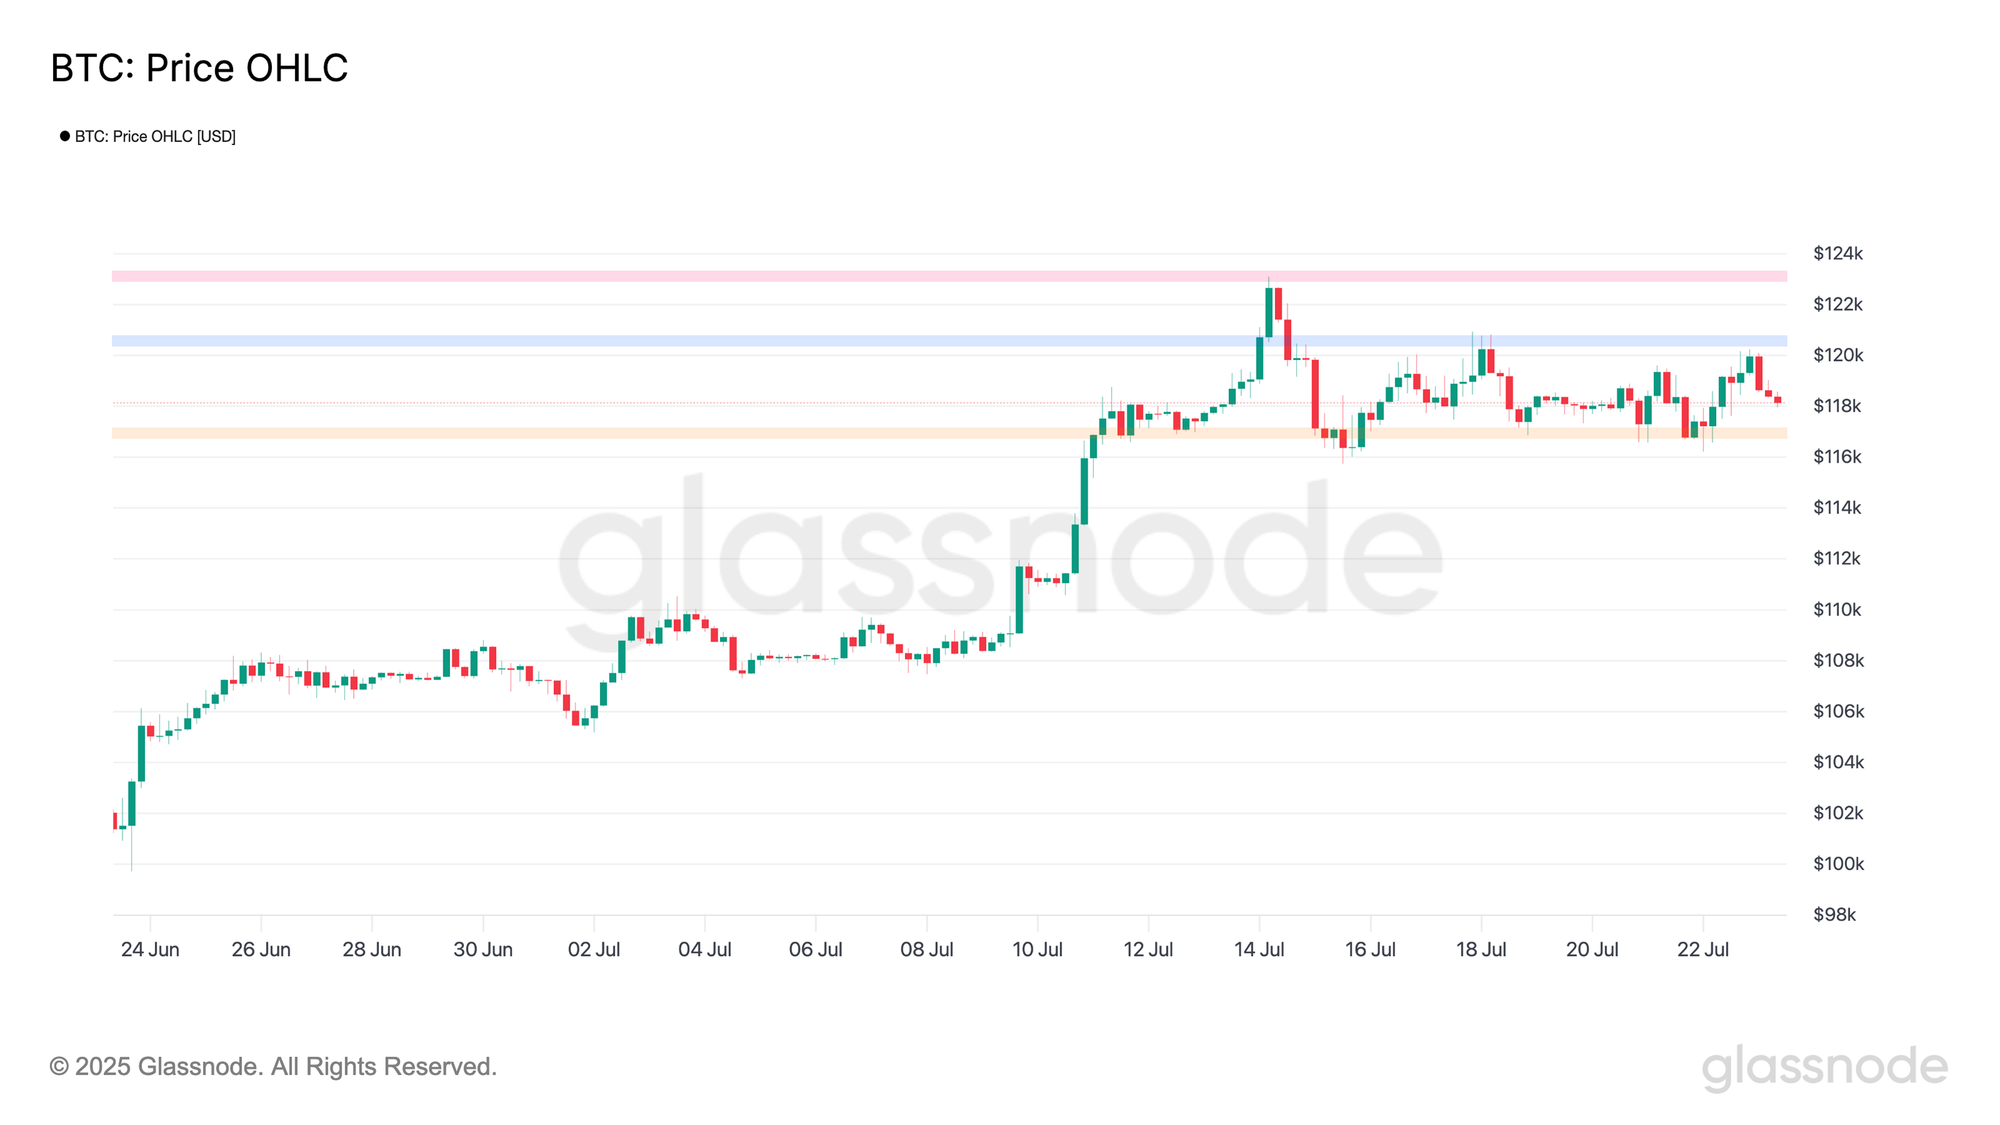
July has been an explosive month for Bitcoin, marked by a surge in upside volatility, with the price rallying from a weekly low of $105.4K to set a new all-time high of $122.7K. Near-term momentum has cooled off later in the week, and the Bitcoin price has been consolidating and coiling just below its ATH since then.
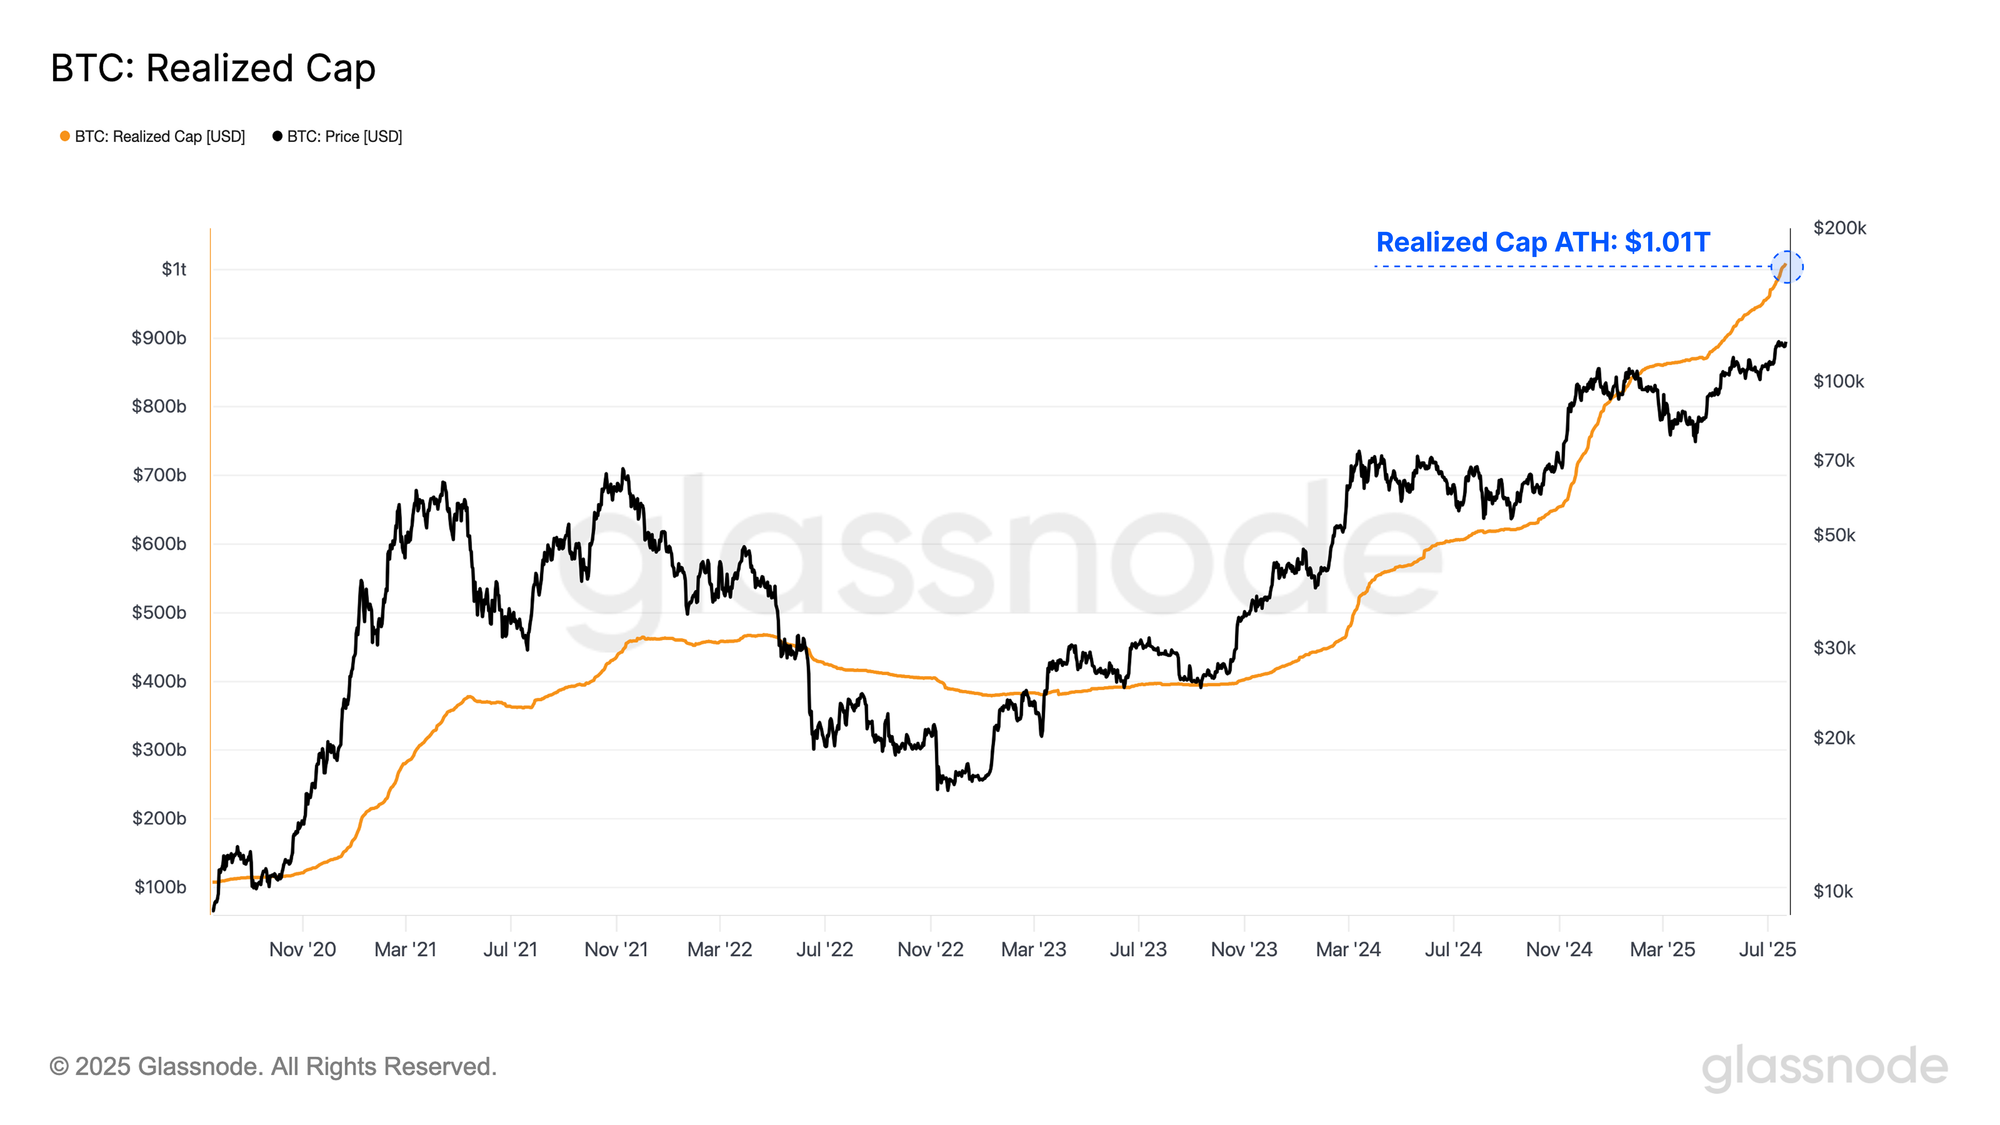
The significant price uptick has motivated a flurry of profit taking from existing holders, and an inflow of fresh demand from buyers. This is cumulatively tracked via the Realized Cap metric, which measures the cumulative USD liquidity stored in the asset.
This recent capital inflow has pushed Bitcoin’s realized cap above the $1 Trillion mark for the first time. This is truly a monumental milestone for Bitcoin, highlighting its deep liquidity profile, and growing relevance on the macro stage. The larger Bitcoin becomes, the more capital can be stored within it, and the larger size can be settled via transactions.
Altcoin Speculation Rises
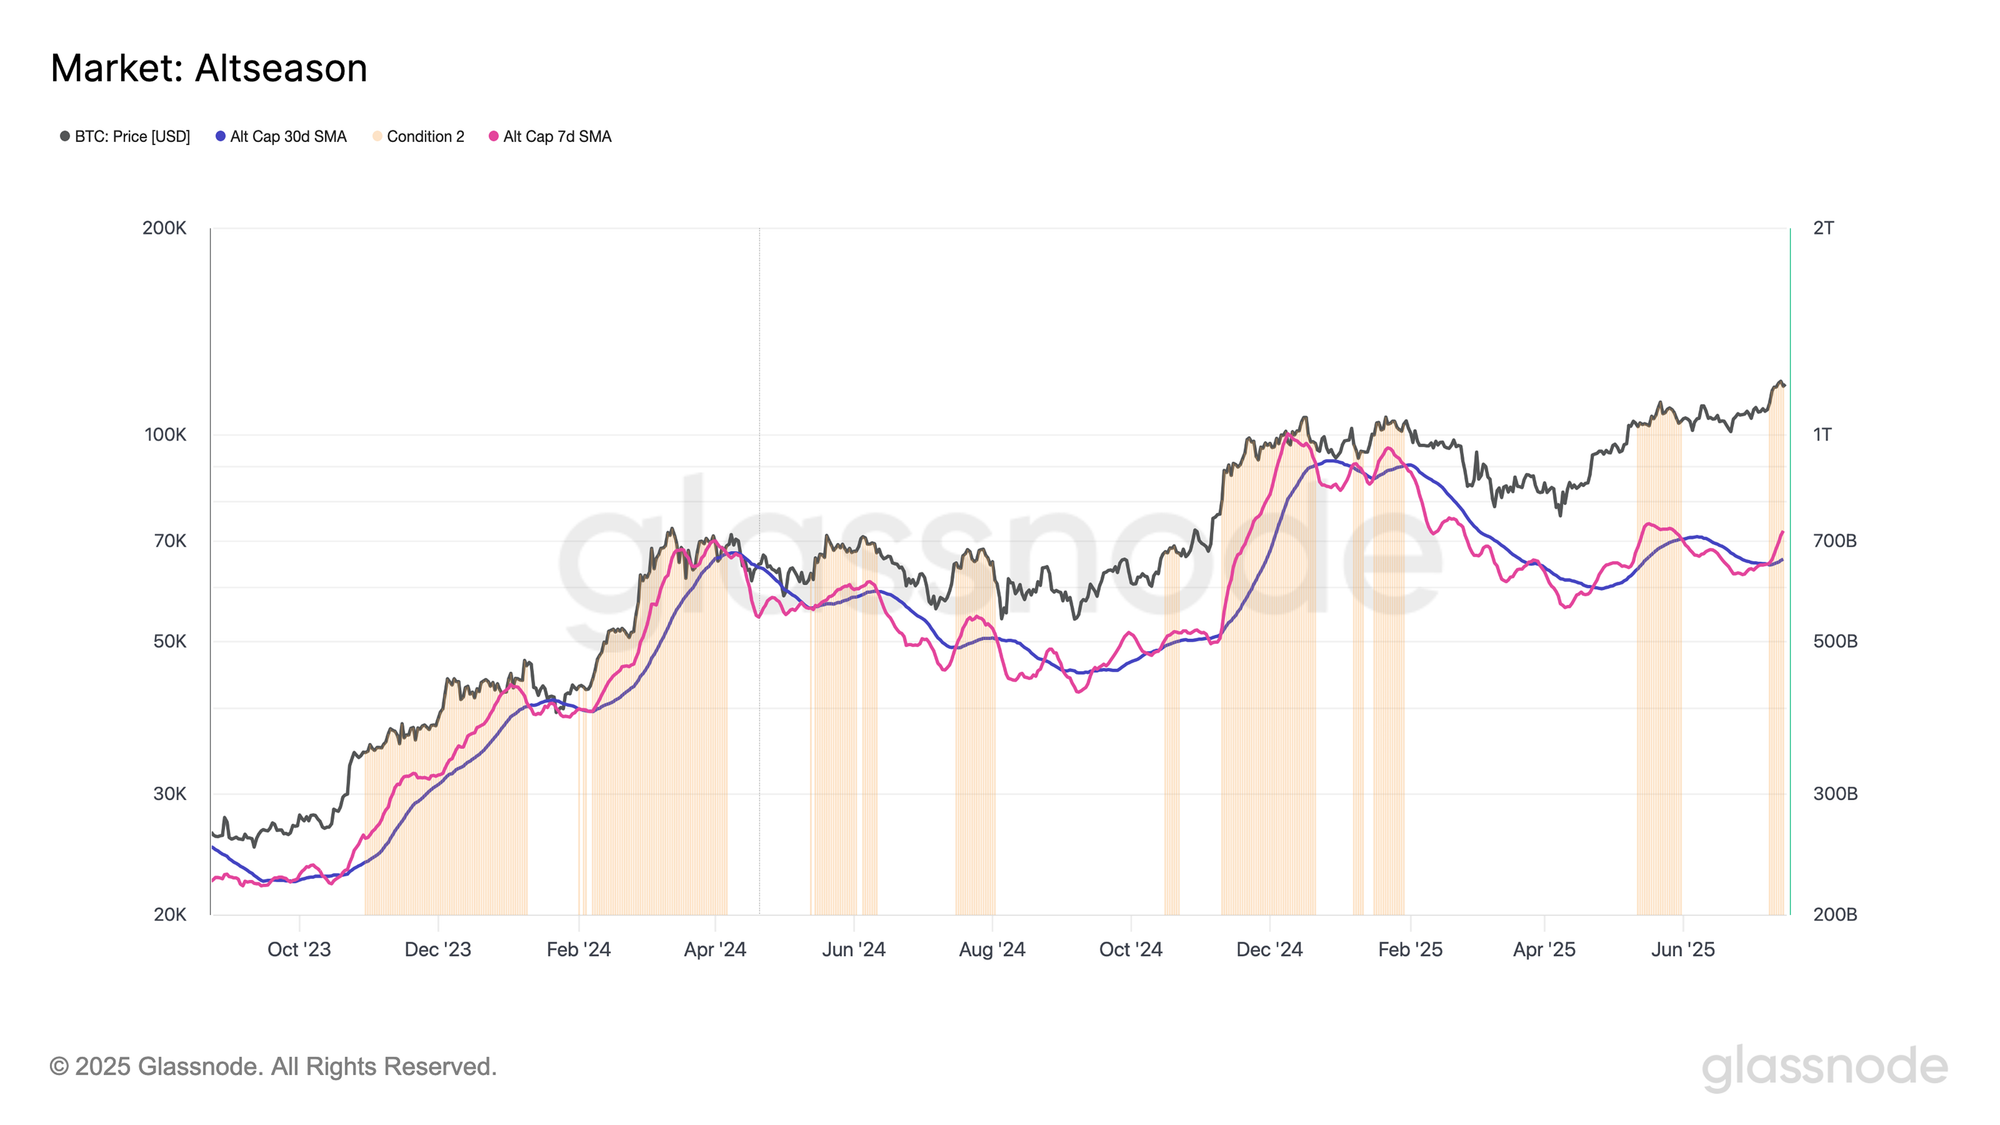
With Bitcoin’s market capitalization continuing to expand, we turn our attention to how the broader digital asset ecosystem is responding to this recent performance. To evaluate this, we employ our Altseason Indicator, which will flag a positive result when the following conditions apply:
- Bitcoin and Ethereum are both consistently absorbing capital inflows on-chain.
- Stablecoin supplies are rising, signaling increased “dry powder” on the sidelines.
- Altcoin Market Cap is showing upward momentum via a fast/slow moving average cross-over.
This framework is designed to capture the dynamics of capital rotation along the risk curve. As Bitcoin and Ethereum draw in capital, and stablecoin liquidity grows, conditions become increasingly favorable for capital to rotate into higher-risk altcoins. When this environment coincides with a momentum crossover in the aggregate Altcoin Market Cap, it indicates that capital is now actively flowing into altcoins and driving valuation expansion.
From the perspective of this model, Altseason conditions first emerged on July 9th and has remained in effect since, suggesting the ongoing redistribution of capital across the broader crypto landscape.
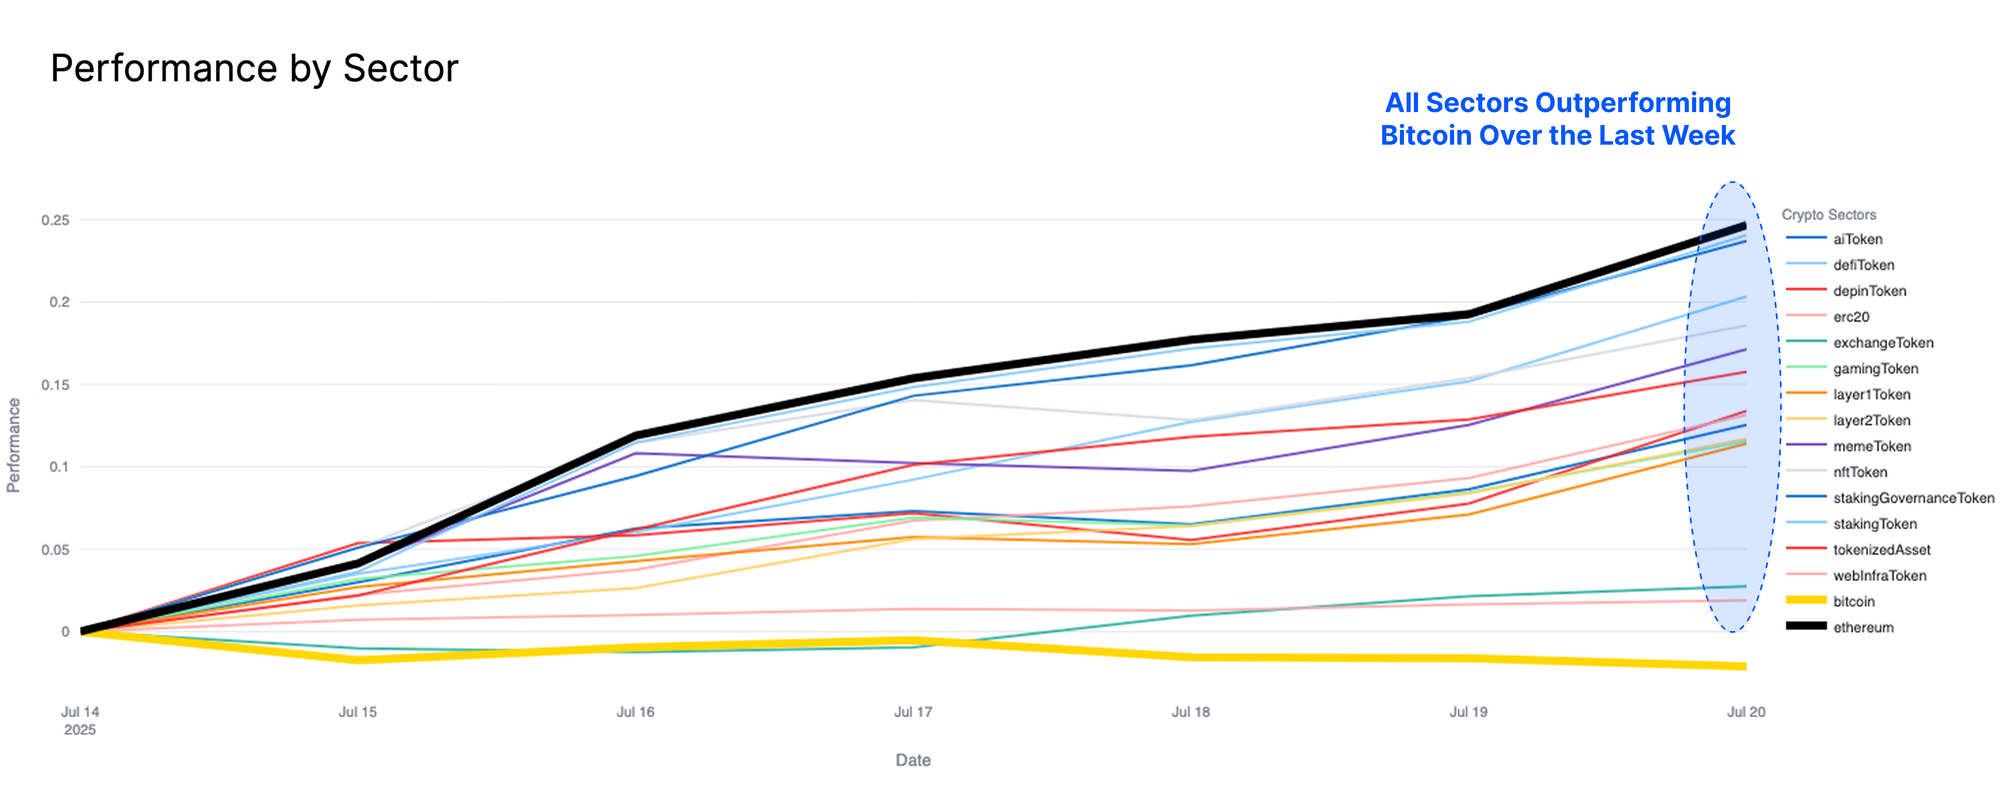
We can validate this observation by analyzing sector-level performance across the digital asset ecosystem over the past week. Bitcoin’s recent consolidation is evident, with price action remaining largely flat over the last week. By contrast, all other digital asset sectors are now outperforming, led most notably by Ethereum. This mechanic is a classic example of capital rotation along the risk-curve.
However, given Bitcoin’s outsized dominance within the ecosystem (over 64% dominance), any sustained weakness in its performance could pose headwinds for the altcoin market, potentially curbing the momentum of this broader rally.
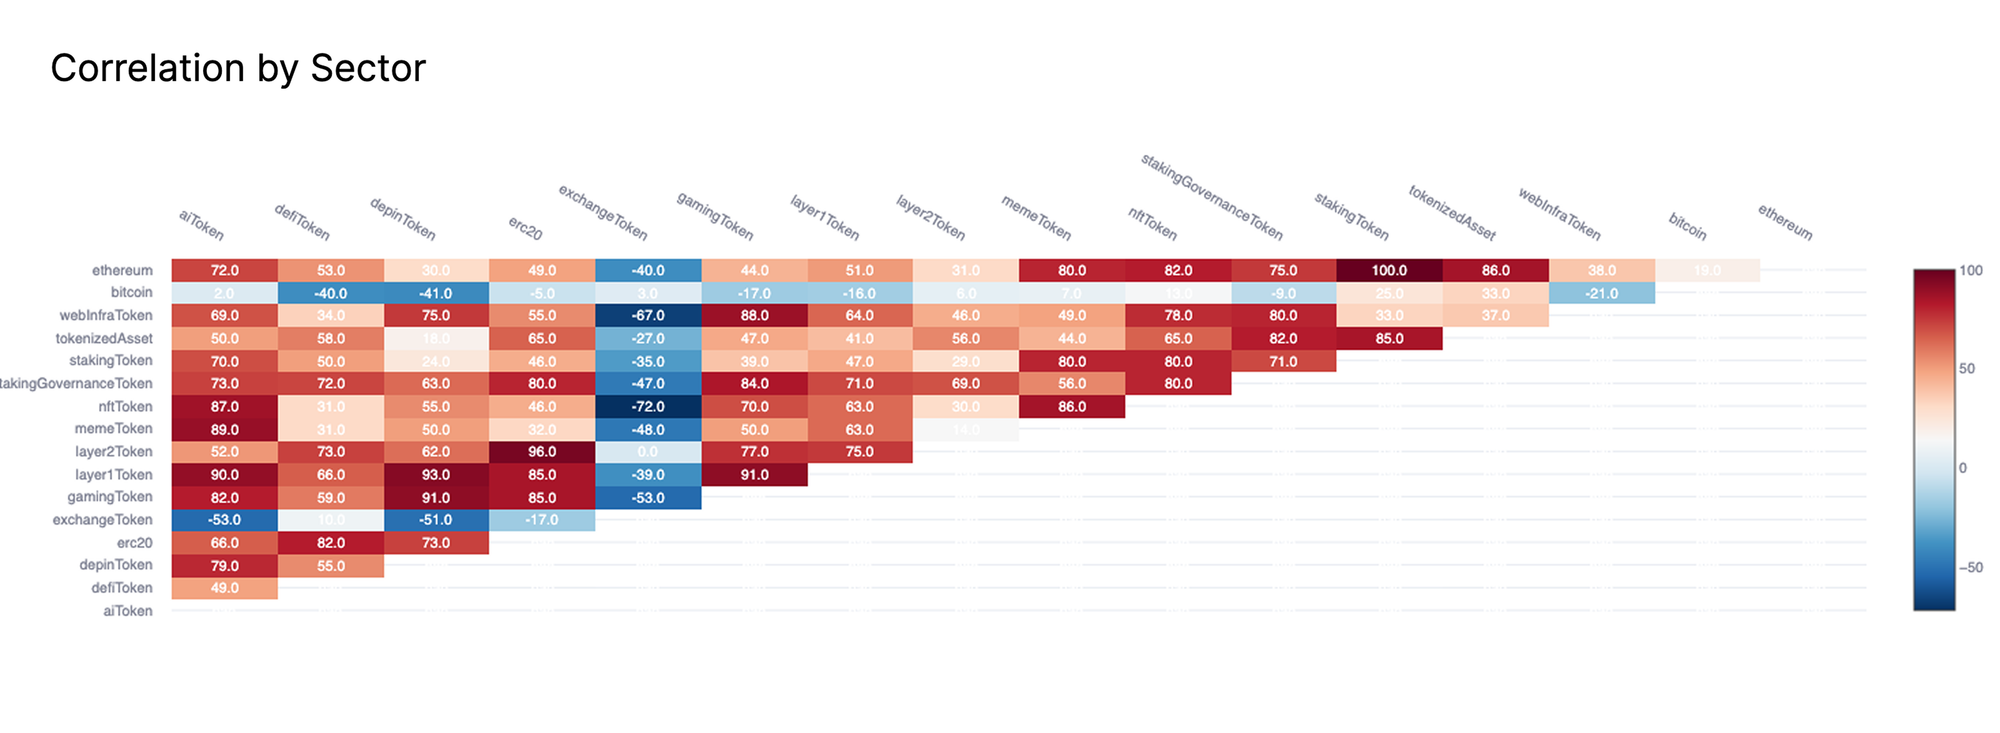
This trend is further reinforced when examining sector correlations. Nearly all altcoin sectors are now moving in close lockstep, reflecting a broad-based rally across the wider market, largely unanchored from any asset-specific fundamentals.
At the same time, correlations between altcoin sectors and Bitcoin have decreased significantly, highlighting a growing divergence in price behavior, and confirming the orthogonal nature of recent price action between Bitcoin and the broader altcoin ecosystem.
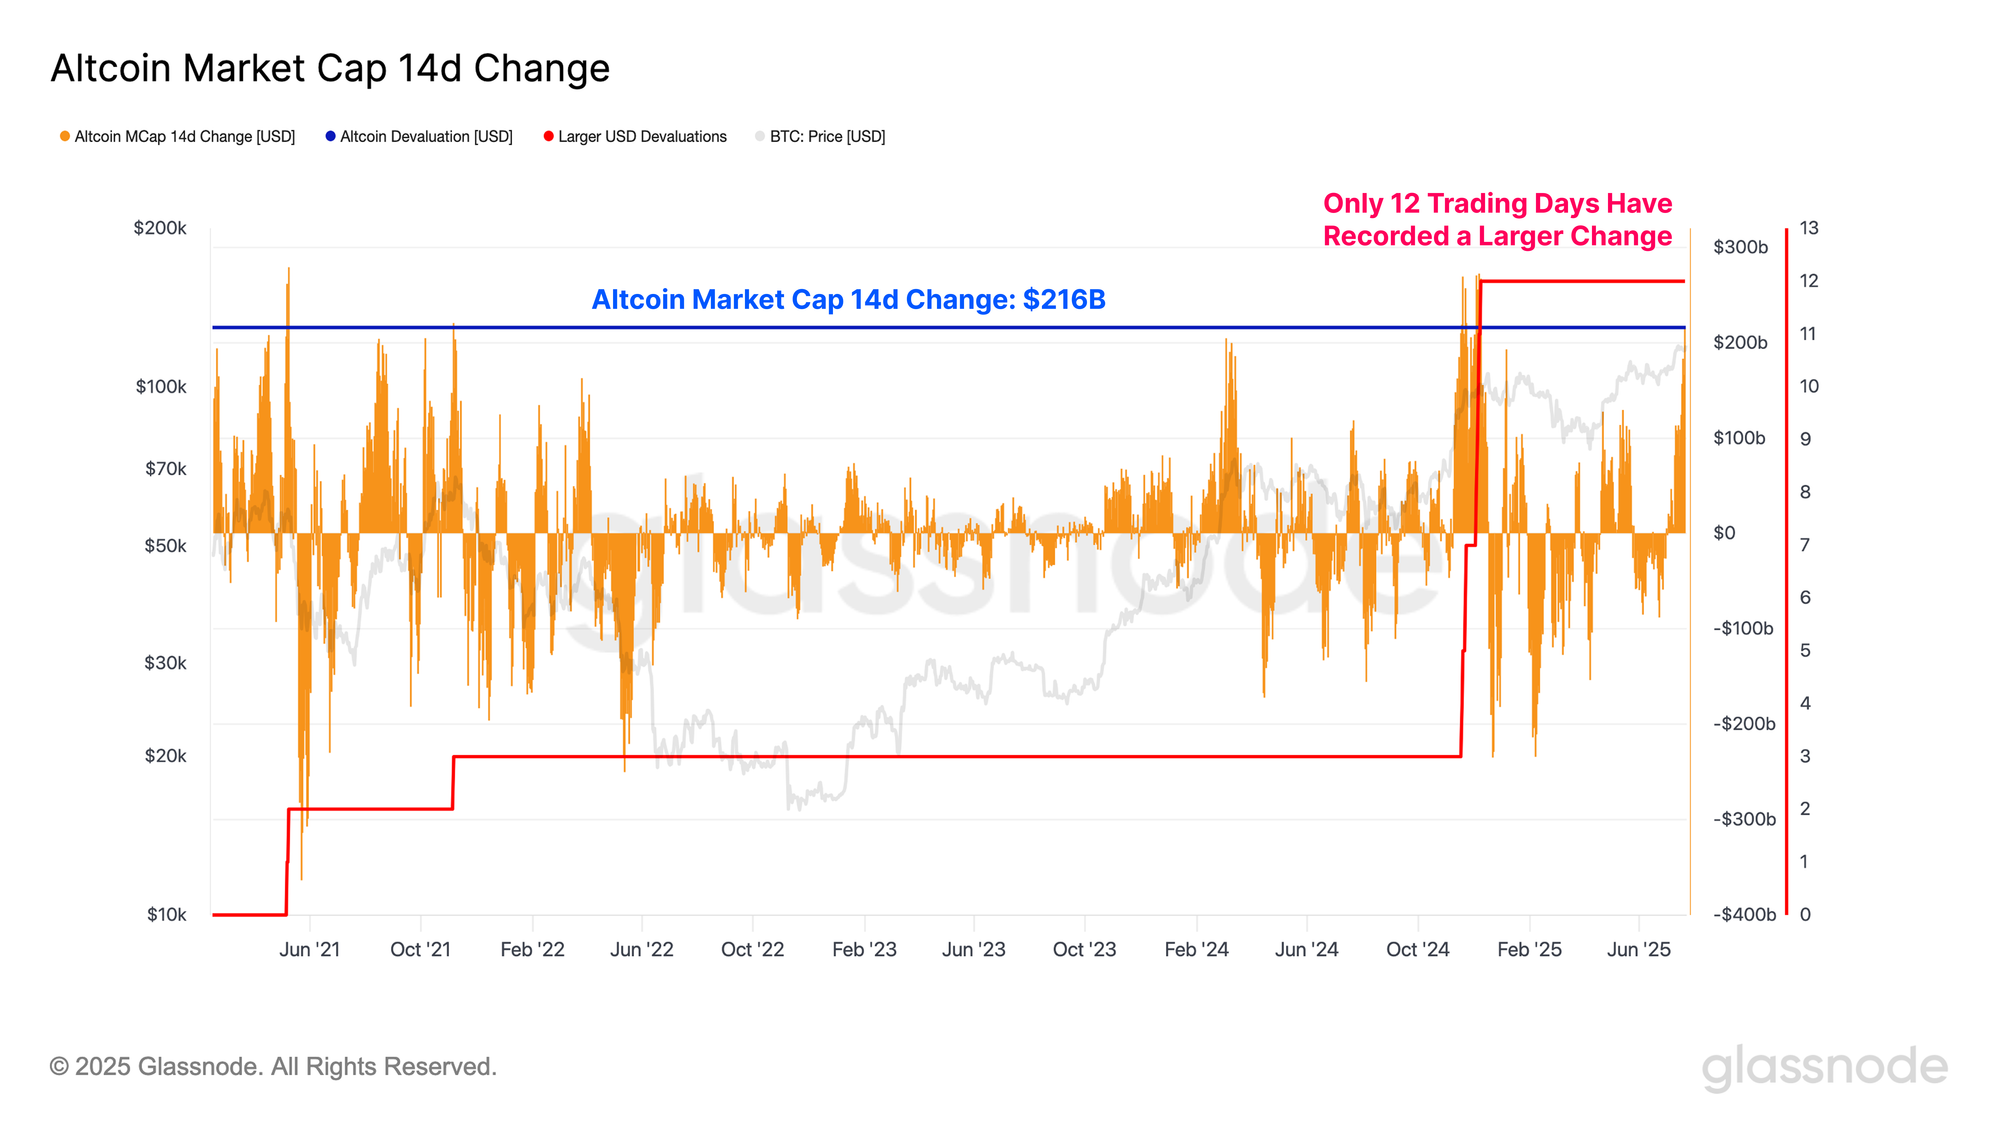
The magnitude of the recent change in the Altcoin Market Cap has been quite significant, and we note a Market Cap increase of +$216B to altcoins over the past two weeks. This is one of the largest USD denominated upswing in the aggregate altcoin market cap, which adds further evidence to the presence of an ongoing altseason impulse.
Derivatives Explode
Now that we’ve established there is a noteworthy uptick in the altcoin market, it becomes prudent to analyze its surrounding derivative markets to assess to further understand the current risk appetite of market participants.
The combined open interest across top altcoins (Ethereum, Solana, XRP, Doge) has experienced a substantial increase from the start of July, growing from $26B to a staggering $44B. This sharp rise in futures leverage reflects a clear acceleration in speculative activity, with traders increasingly opening leveraged positions.
Such conditions point to a degree of froth starting to form in the market, and may leave it more susceptible to sharp volatility. Elevated leverage tends to amplify both upside and downside volatility, and can contribute to a more reflexive and fragile market environment.
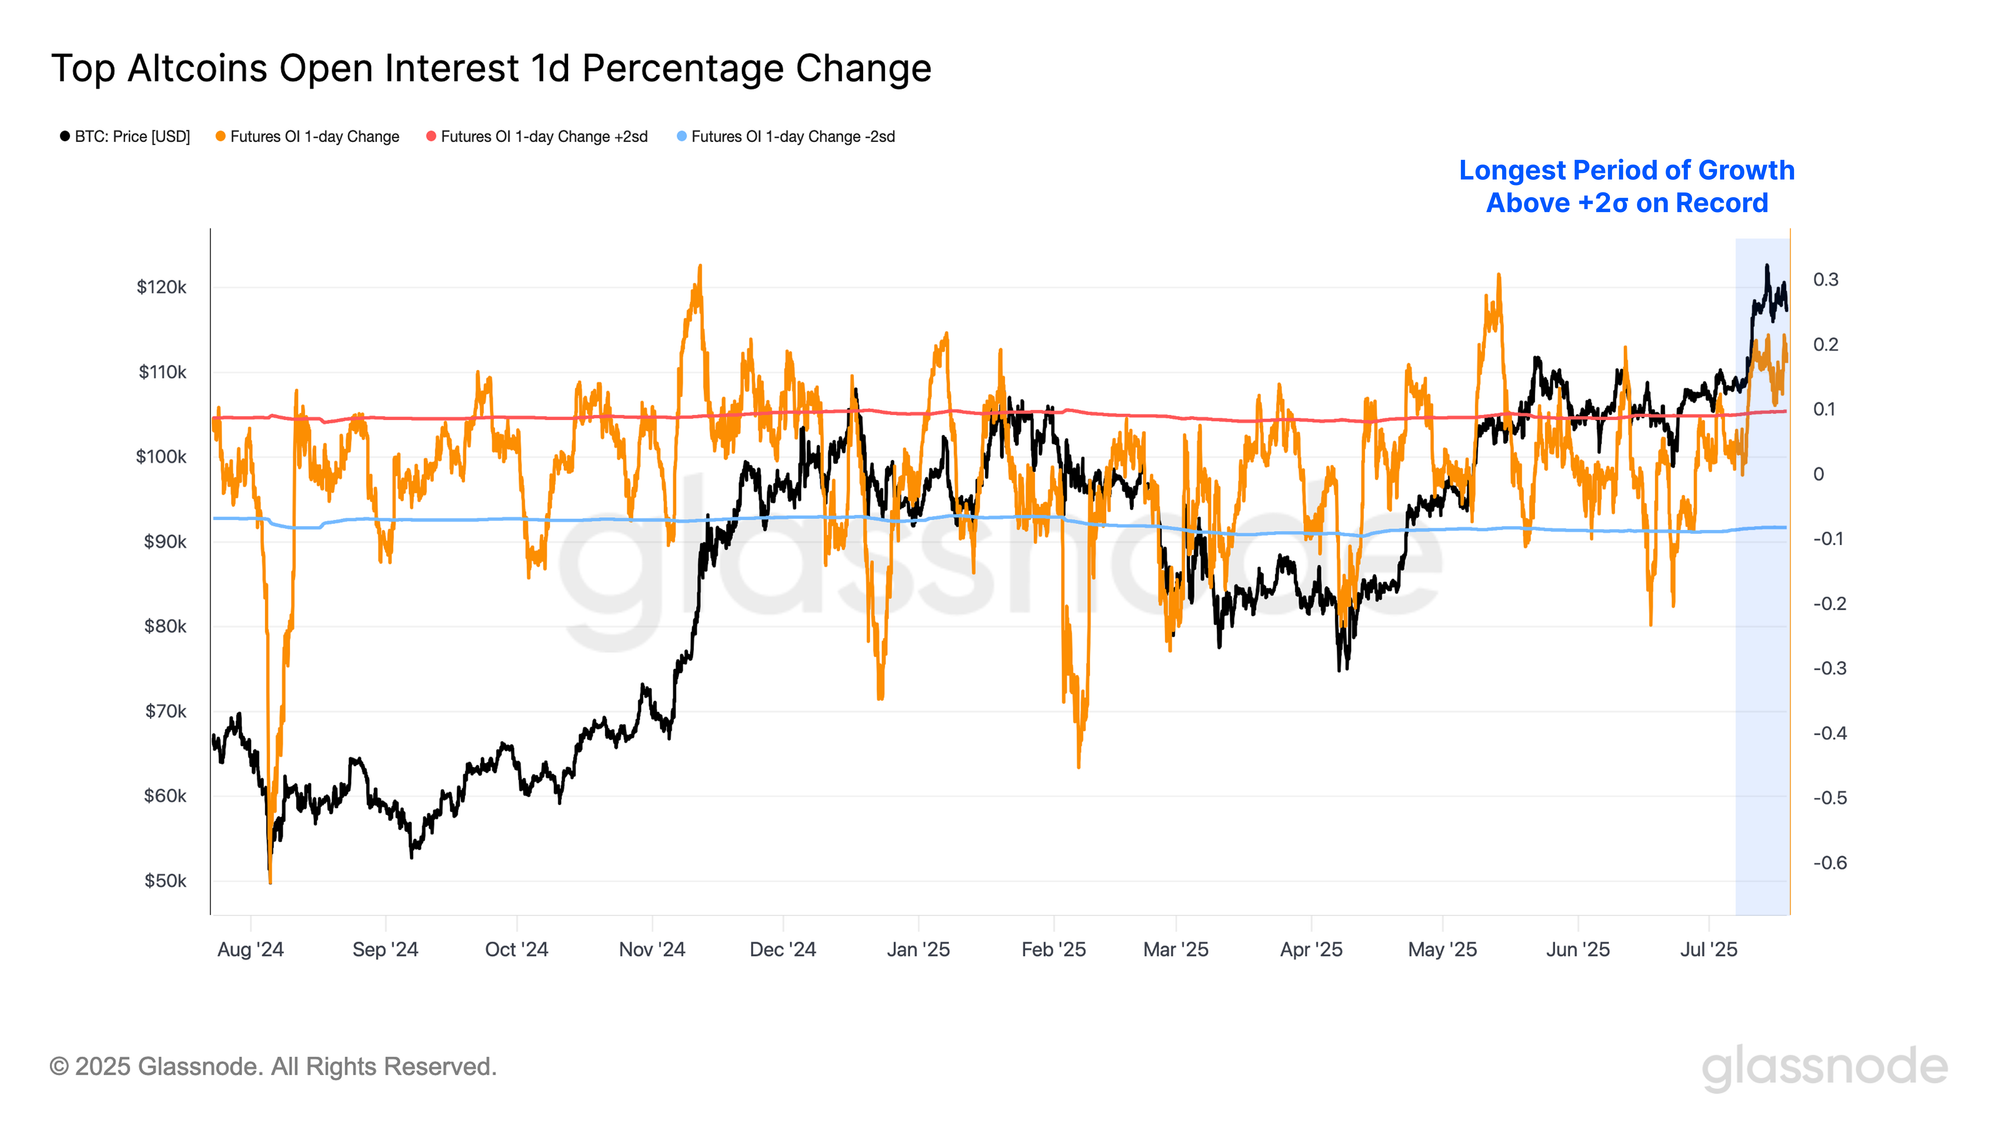
When evaluating this magnitude of aggregate open interest growth, we find that recent daily increases have remained above the +2 standard deviation threshold for more than 12 consecutive days, the longest stretch on record.
This not only emphasizes the significant scale of recent open interest expansion, but also its persistence, potentially signaling a meaningful shift in speculative behavior among market participants.
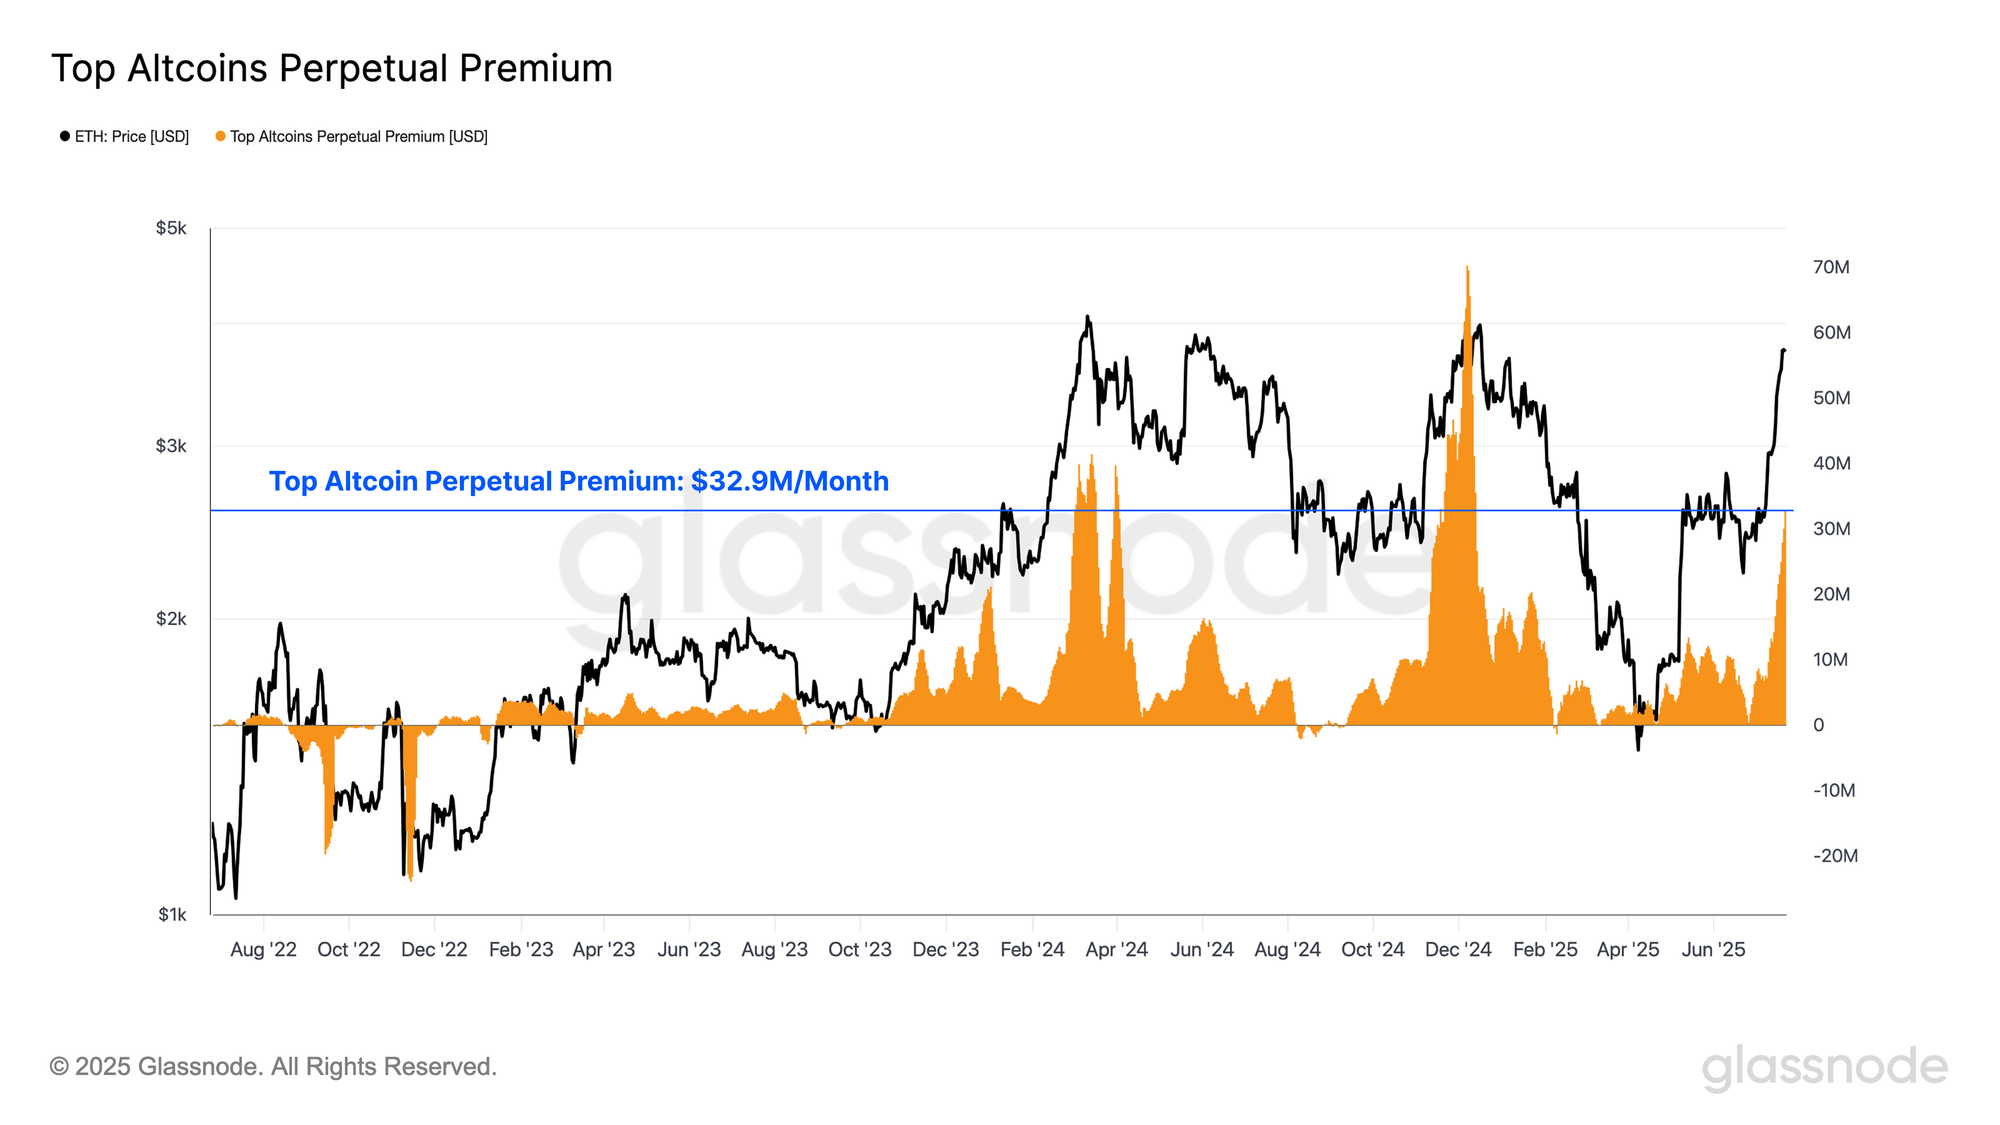
The cumulative monthly funding premium paid by long-side futures contracts over the past 30 days can be a useful gauge for speculative appetite. Here, we look at monthly premium paid across the top altcoin assets, and we find that the total cost of leverage has reached approximately $32.9M/month.
This figure is comparable to the ~$42M/month observed during Bitcoin’s March 2024 all-time high, though it remains below the peak euphoria of ~$70M/month seen around the initial $100K breakout in late 2024.
This elevated funding cost signals that there is a meaningful increase in demand for leveraged long exposure, highlighting that market participants are becoming increasingly optimistic and aggressive in their positioning.
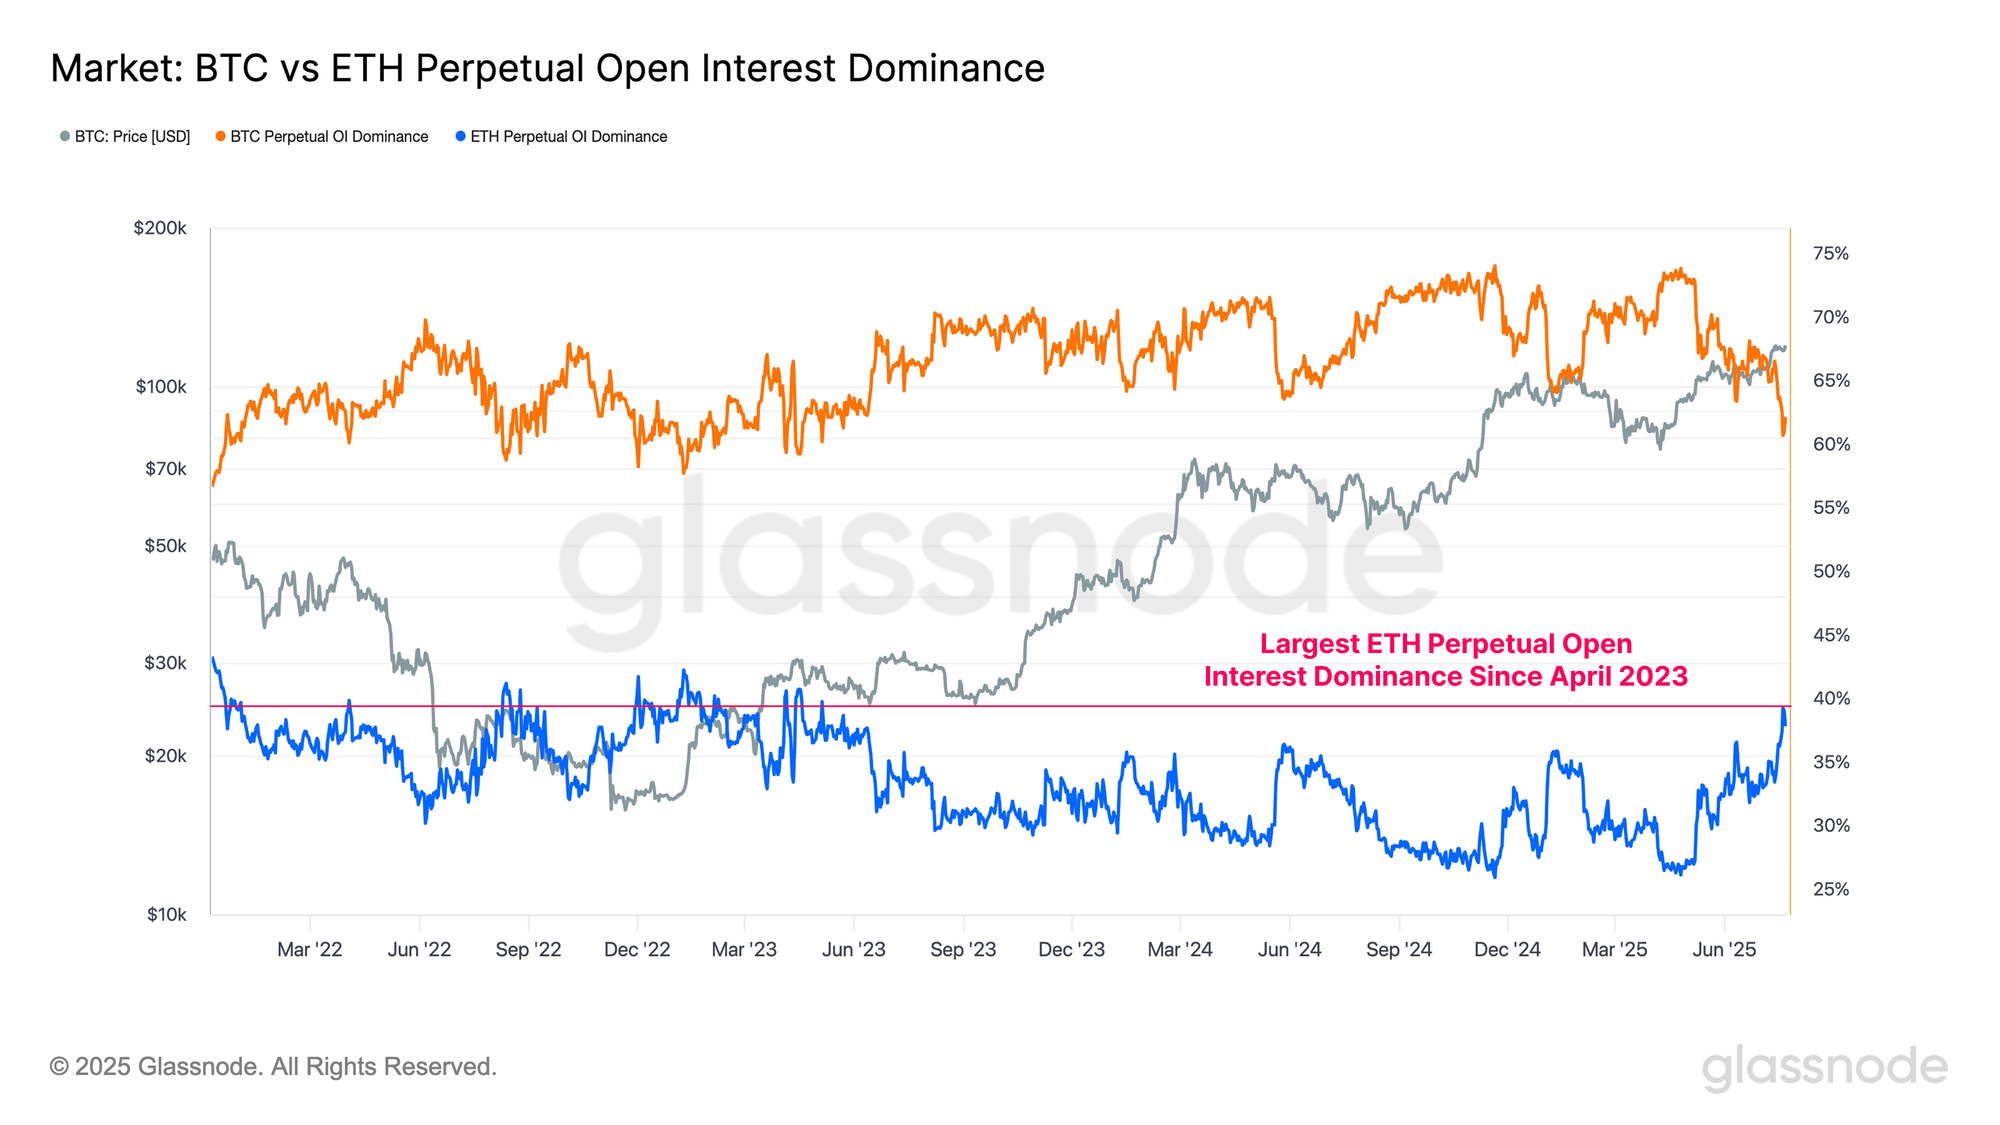
When evaluating open interest dominance, it's clear that leveraged positions in Ethereum have been expanding at a significantly faster pace than those in Bitcoin.
- Bitcoin Open Interest Dominance: 62%
- Ethereum Open Interest Dominance: 38%
Ethereum open interest dominance is now inflecting higher, underscoring a noteworthy rotation in the focus of the market. Capital and speculative activity is increasingly favoring Ethereum over Bitcoin at the margins.
To illustrate the significance of this trend, Ethereum’s open interest dominance has now reached its highest level since April 2023, with only 5% of trading days recording a higher value, and marking it as a notable event and a signal of heightened speculative engagement.
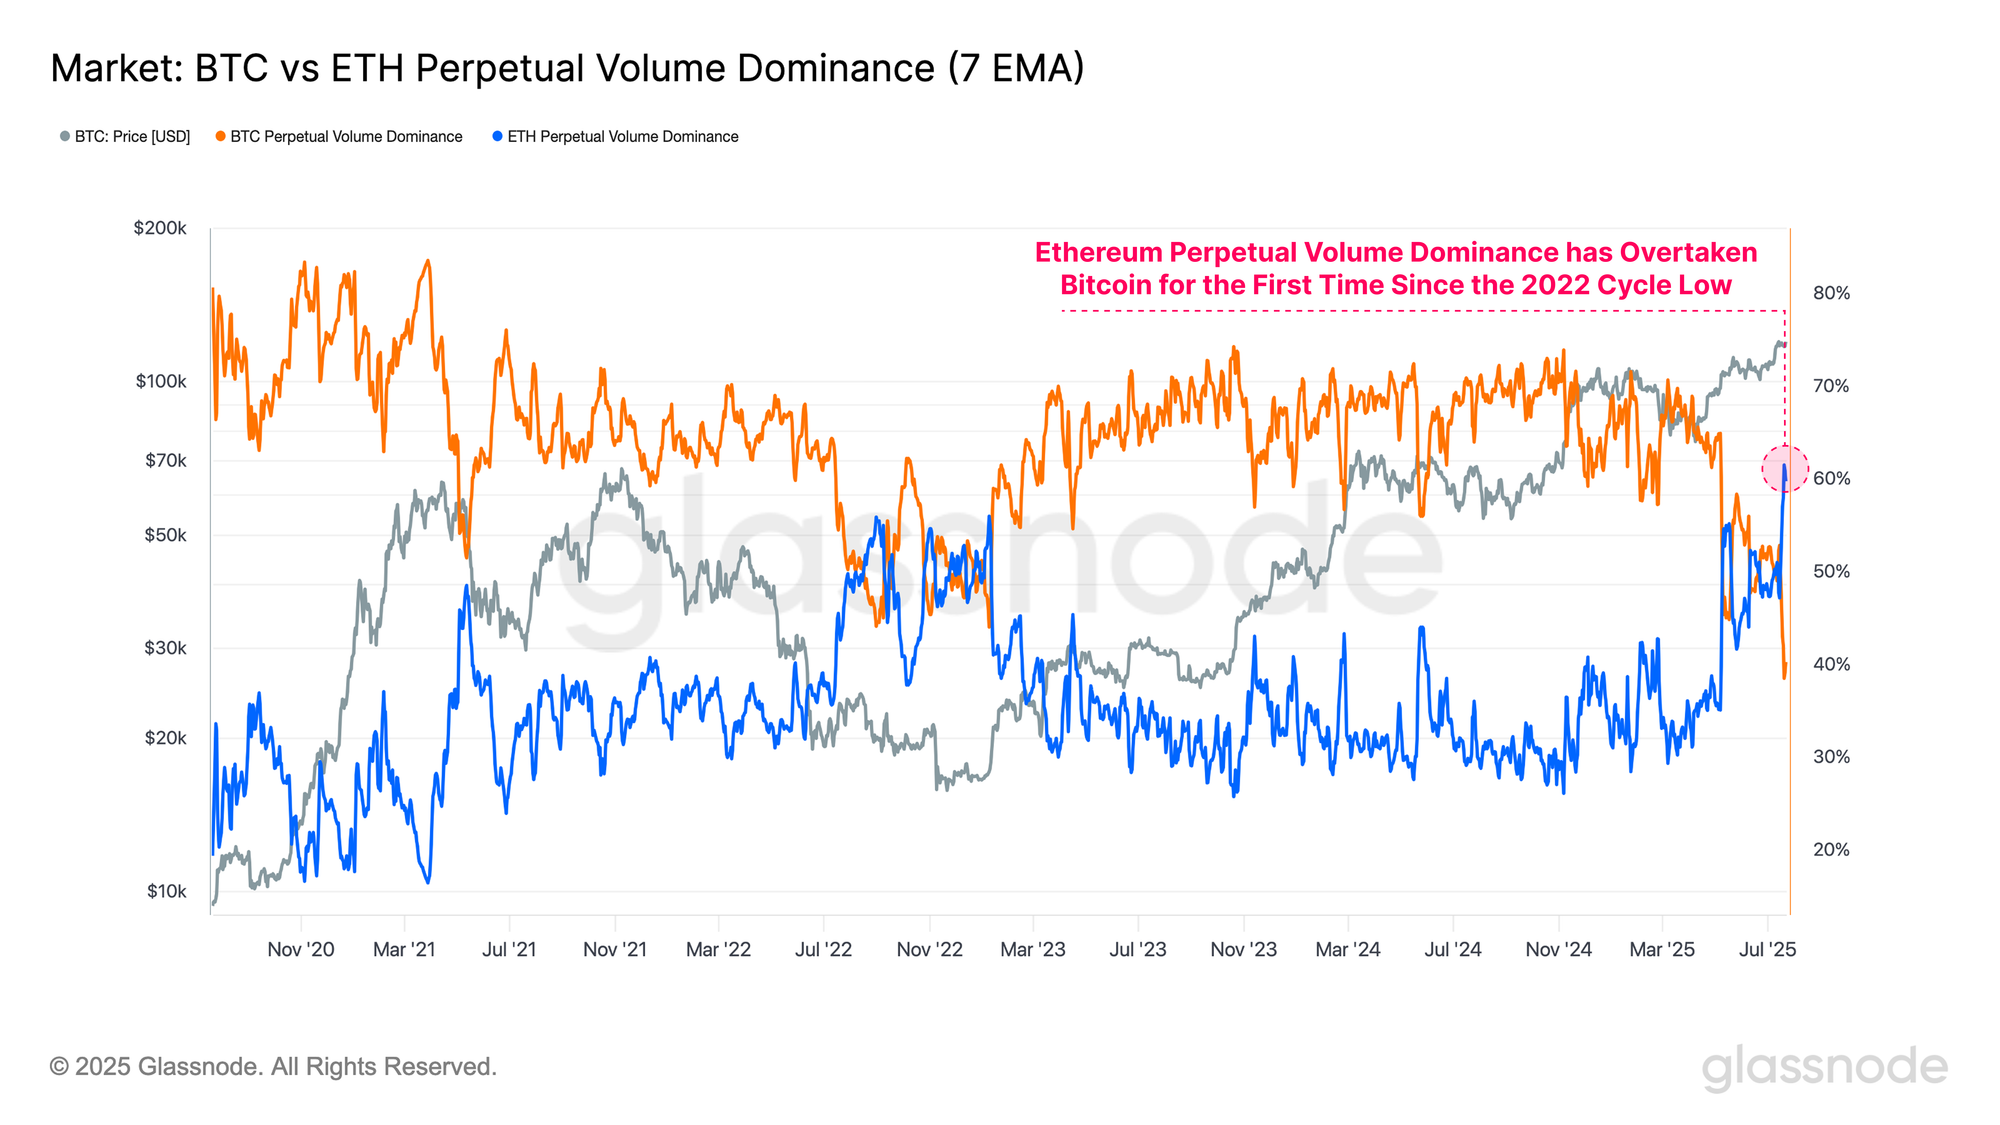
This trend is even more pronounced when assessing the volume dominance between Bitcoin and Ethereum. Interestingly, Ethereum perpetual volume dominance has just overtaken Bitcoin for the first time since the 2022 cycle low, and is the largest volume skew in Ethereum’s favour on record.
Such a meaningful rotation of trade volume further confirms the scale of the rotation towards the altcoin sector, which has struggled for many months to attract speculative interest.
Ethereum Market Navigation
With Ethereum surging in price and leading a wider altcoin rally, we can focus in on Ethereum on-chain data to map out key pricing levels of interest
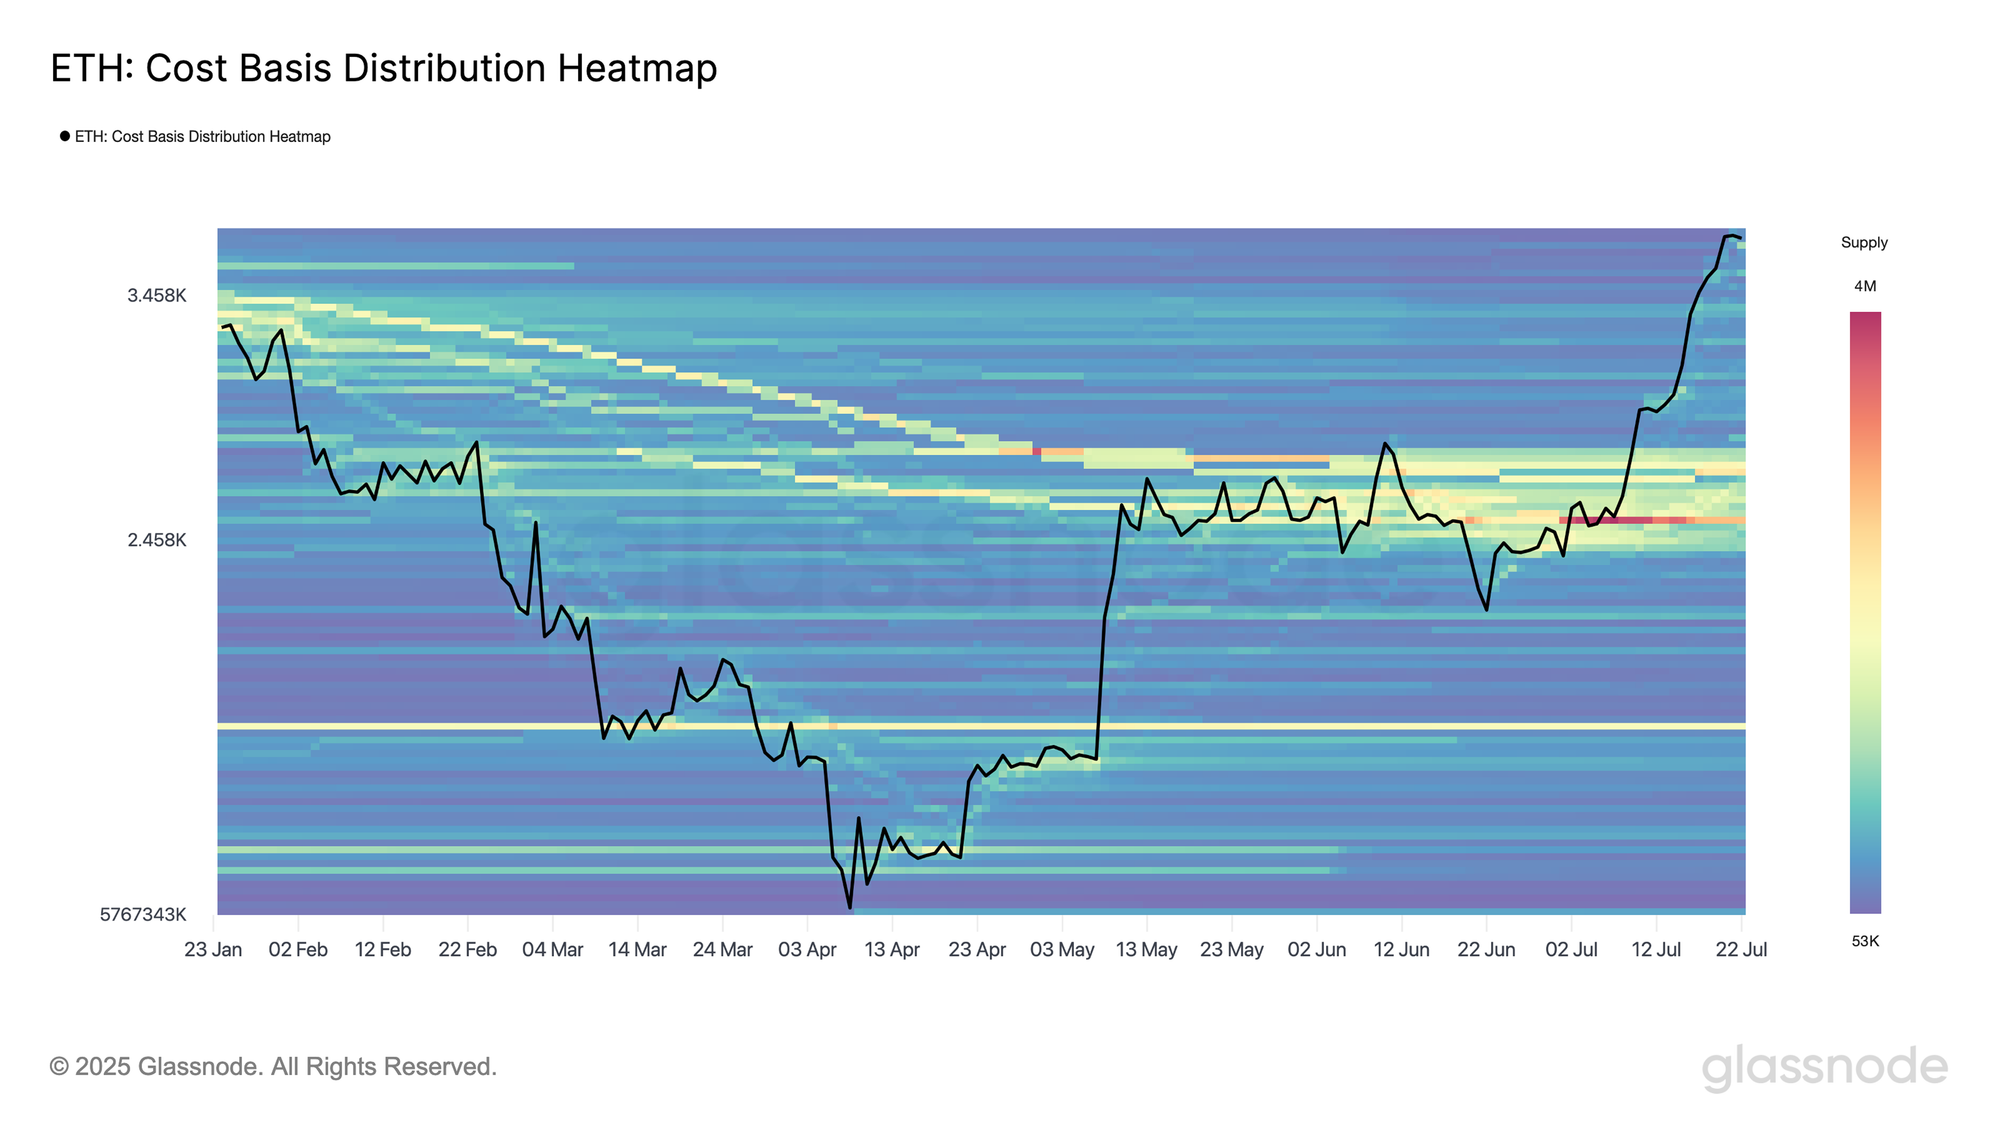
By examining Ethereum’s Cost-Basis Distribution profile, we note that there is a significant concentration of investor cost basis levels around the $2,400-$2,800 level. The price has decisively broken out above this dense cluster of supply, and is now trading in a region with comparatively fewer coins held at these price levels.
Investors who last acquired ETH tokens within the $2,400-$2,800 are now beginning to distribute them, with the $3,800 region emerging as a location where many are opting to take chips off of the table.
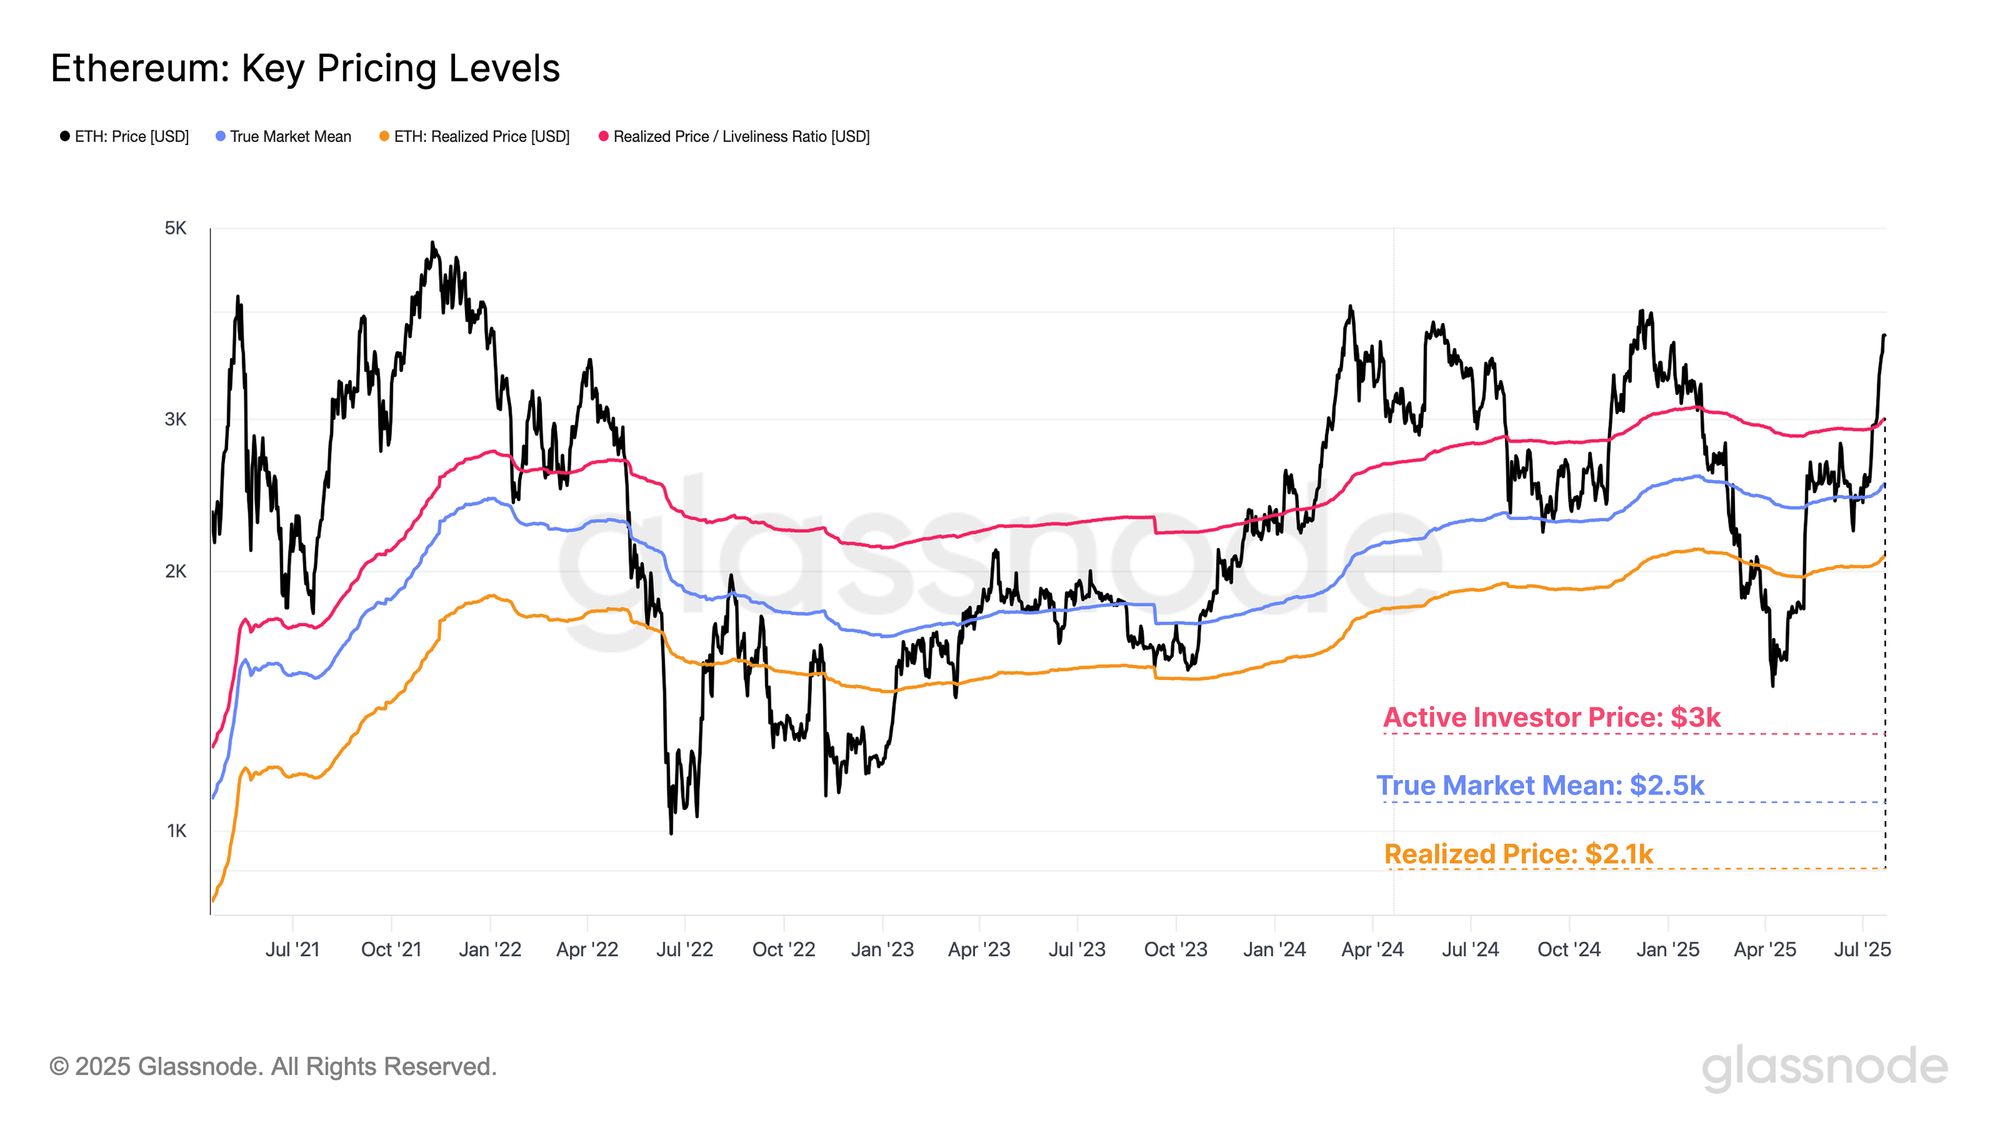
We can find confluence between several on-chain valuation models for Ethereum, and volume profile data. Specifically, the True Market Mean and Active Realized Price provide two adjusted cost-basis models which exclude long-dormant and lost coins. These adjustments offer a clearer picture of the average price paid by economically active investors compared to the realized price, which is the average cost basis per unit of ETH.
- True Market Mean: $2,500
- Active Realized Price: $3,000
- Realized Price: $2,100
Notably, these valuation anchors bound the dense coin distribution seen in the CBD metric above. This alignment bolsters the observation that Ethereum has now broken out of an important psychological price range. It is also likely that this price range would serve as an important level of level of support in the event that price corrects back towards it.
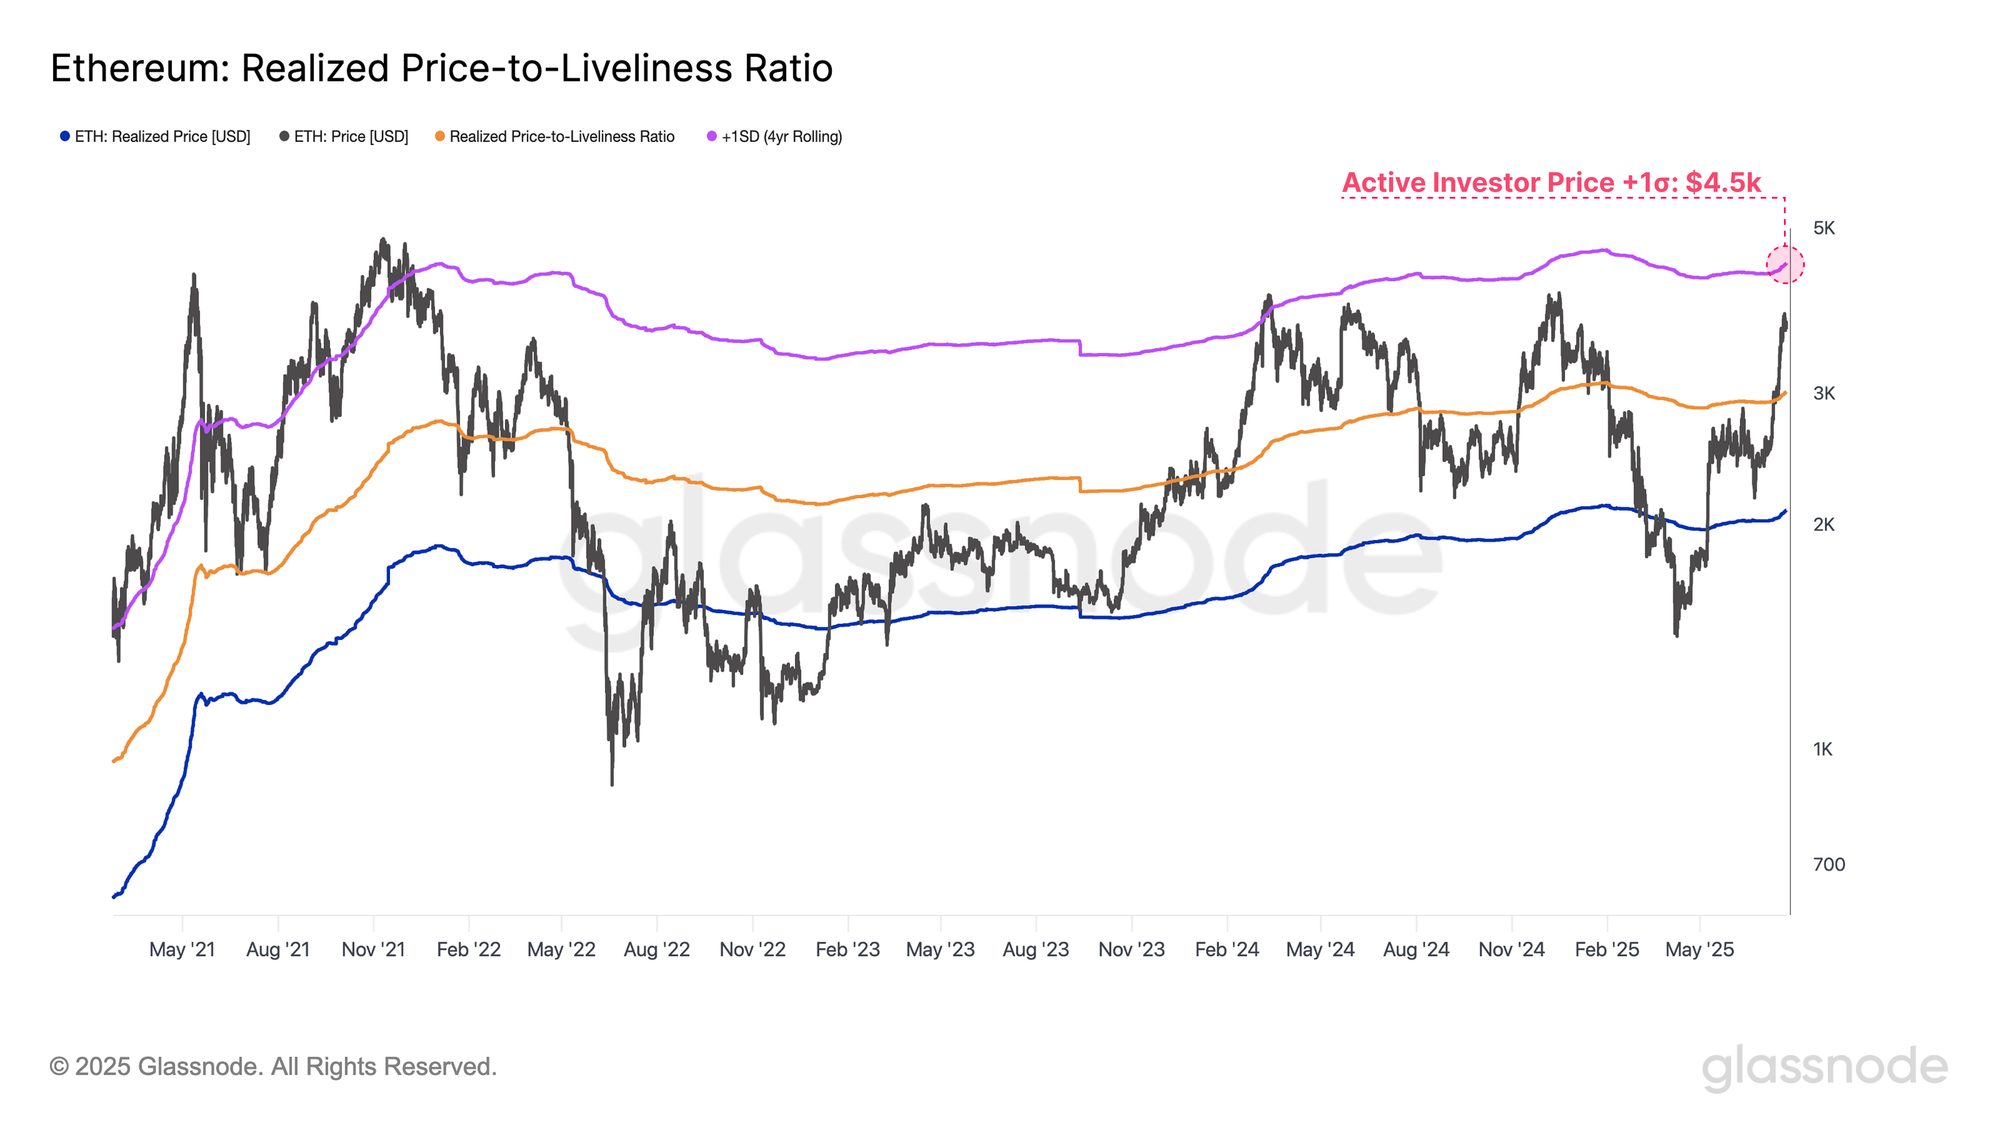
In order to gauge upside targets for this ETH rally, we can turn to the +1 standard deviation band of Ethereum’s Active Realized Price. This acts as a threshold for where sell-side pressure may begin to intensify. Currently, this +1σ level sits at $4,500, and would be considered an overheated zone given current market conditions.
In the current cycle, this price band has already served as a resistance level back in March 2024, as well as during the prior 2020-21 cycle. Breakouts above this threshold tend to coincide with heightened market euphoria, and unsustainable market structure.
As such, $4,500 can be identified as a critical level to watch on the upside, especially if Ethereum’s uptrend continues and speculative froth builds further.
Summary and Conclusions
With the altcoin sector having largely underperformed throughout this cycle, the recent spike in performance marks a notable shift in investor behavior. This is particularly evident in the perpetual futures landscape, where Ethereum's perpetual contract dominance has reached an all-time high, surpassing Bitcoin for the first time since the 2022 cycle low.
The surge in attention has spilled over into derivatives markets, with combined open interest across major altcoins (ETH, SOL, XRP, DOGE) climbing from $26B to $44B in July alone. This rapid growth suggests an acceleration in speculative positioning and a rising degree of market froth. Elevated leverage can both magnify gains and exacerbate losses, introducing greater reflexivity and making the market more vulnerable to volatility shocks.
Disclaimer: This report does not provide any investment advice. All data is provided for informational, and educational purposes only. No investment decision shall be based on the information provided here and you are solely responsible for your own investment decisions.
Exchange balances presented are derived from Glassnode’s comprehensive database of address labels, which are amassed through both officially published exchange information and proprietary clustering algorithms. While we strive to ensure the utmost accuracy in representing exchange balances, it is important to note that these figures might not always encapsulate the entirety of an exchange’s reserves, particularly when exchanges refrain from disclosing their official addresses. We urge users to exercise caution and discretion when utilizing these metrics. Glassnode shall not be held responsible for any discrepancies or potential inaccuracies.
Please read our Transparency Notice when using exchange data.
- Join our Telegram channel.
- For on-chain metrics, dashboards, and alerts, visit Glassnode Studio.