SignalPlus宏观分析(20240322):全球央行将开启降息周期

Odaily星球日报Published on 2024-03-22Last updated on 2024-03-22

Abstract

继昨天美联储表态其鸽派立场之后,瑞士央行意外成为首个降息的主要央行,这可能标志著已开发经济体进入降息年的开始。在加密货币方面,随著ETF需求放缓,BTC正朝著今年表现最差的一周迈进,市场基调略显黯淡。

SignalPlus宏观分析(20240322):全球央行将开启降息周期

SignalPlus宏观分析(20240322):全球央行将开启降息周期

SignalPlus宏观分析(20240322):全球央行将开启降息周期

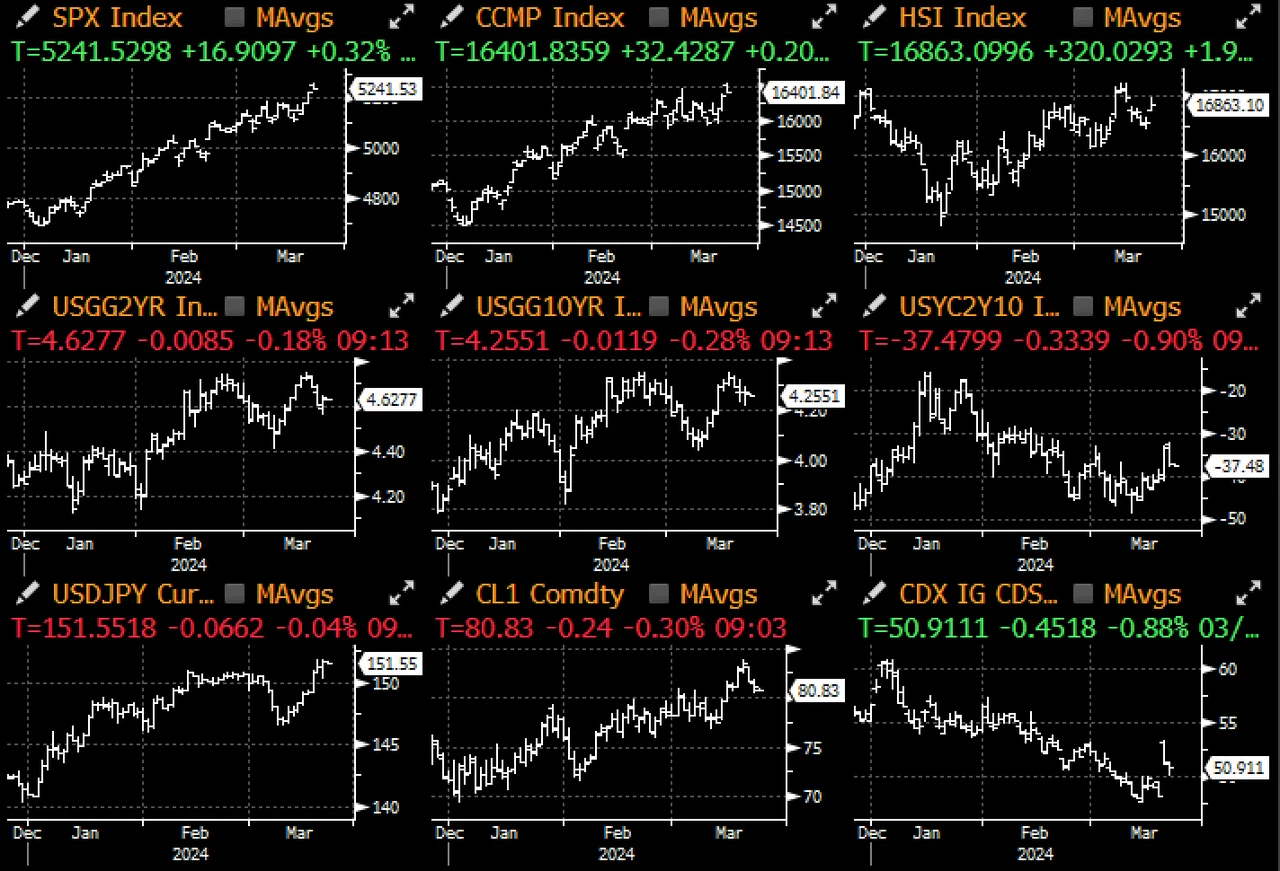
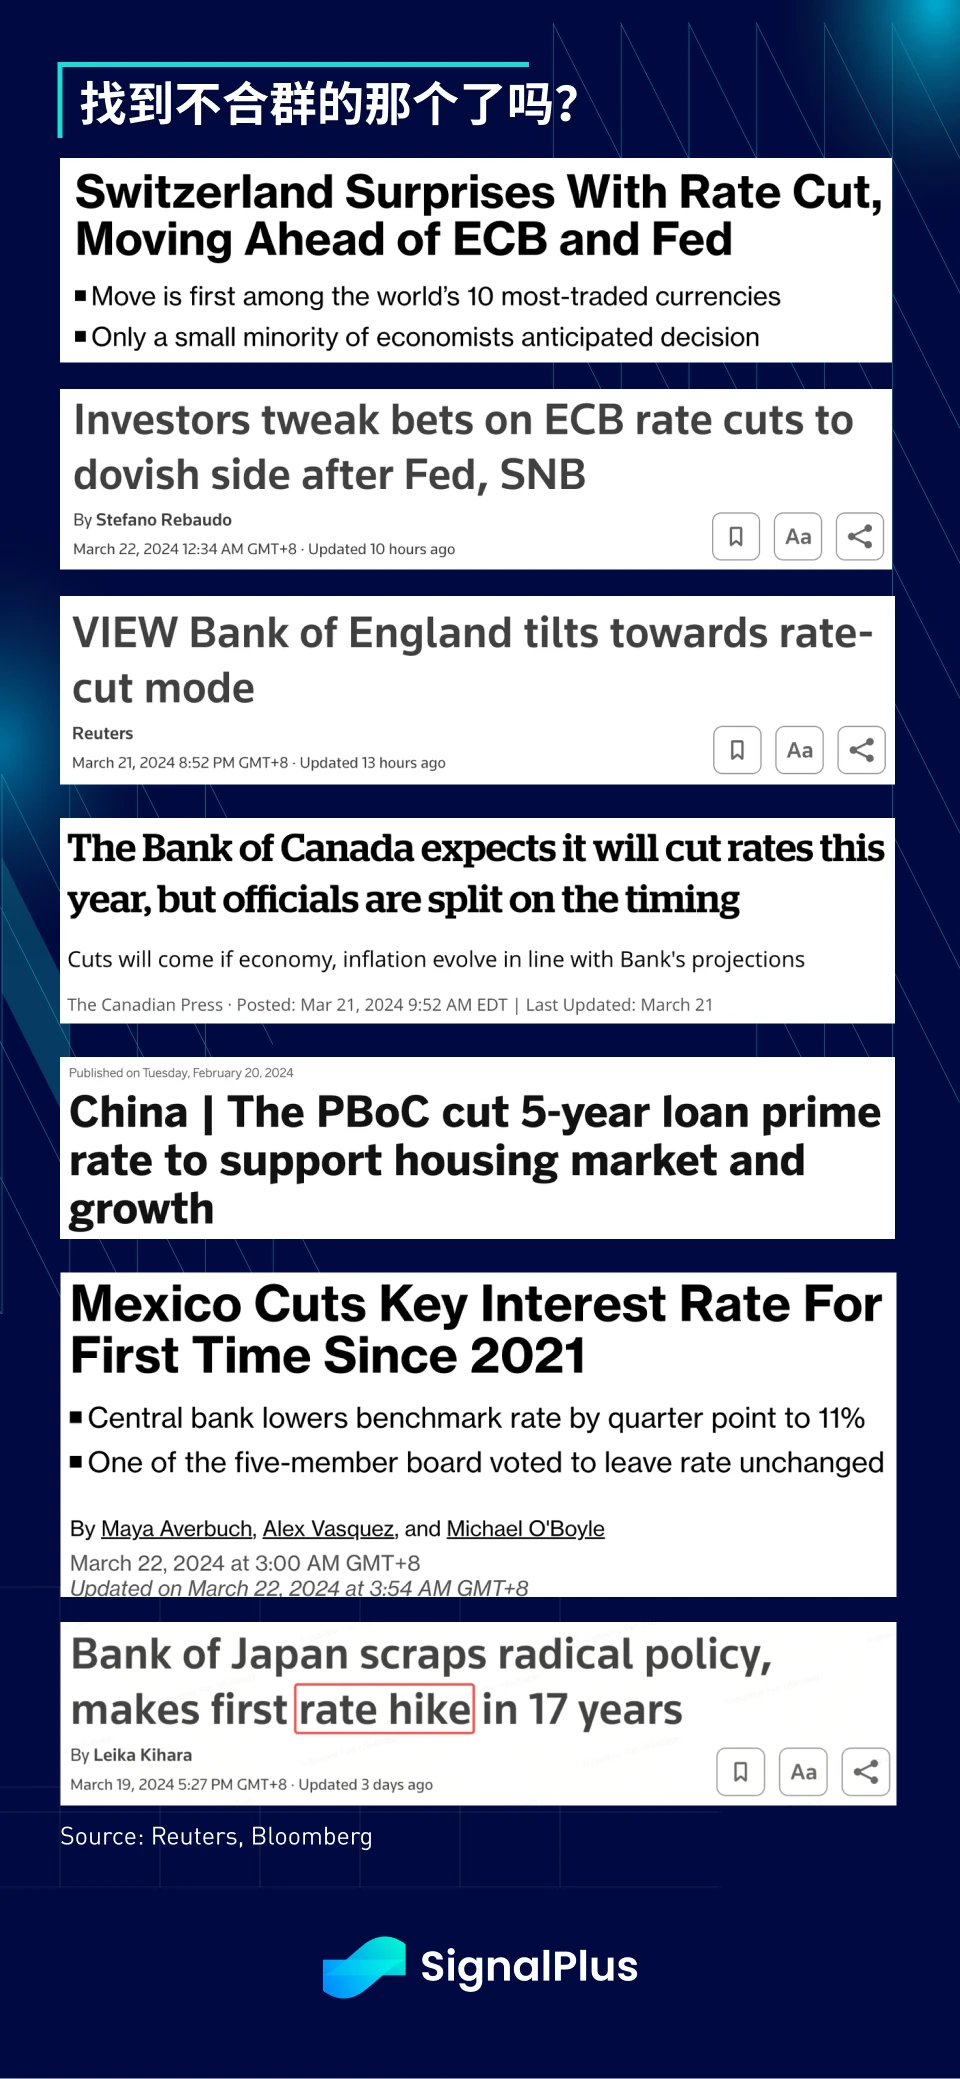
继昨天美联储表态其鸽派立场之后,瑞士央行意外成为首个降息的主要央行,这可能标志著已开发经济体进入降息年的开始。英国央行紧随其后,以 8 比 1 的投票结果实现了自己的“鸽派维持”,委员会预计 CPI 将“略弱于”预期,而英国央行 6 月降息的可能性也从 65% 上升至 80% 。在美联储、英国央行和瑞士央行发布立场后,欧洲央行 6 月降息的可能性也接近 80% ,而鉴于经济增长乏力,加拿大央行和中国人民银行也明显倾向宽松立场。

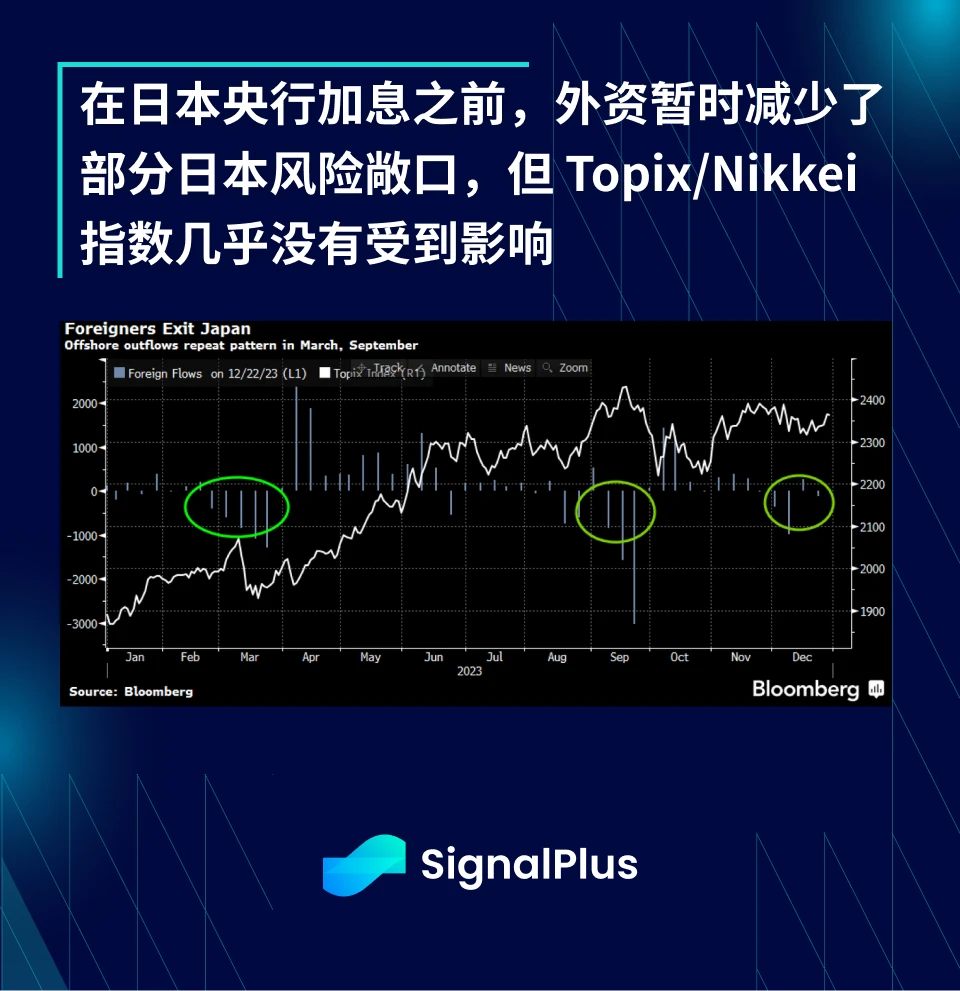
另一方面,日本仍特立独行,是当前周期中唯一加息的央行,其股市、房地产市场和工资涨幅均超过大多数的同类。有趣的是,尽管外国直接投资和外资流入在过去 18 个月中一直是市场主要的推动力,但出于对日本央行退出负利率政策的担忧,外资在 12 月抛售了大量股票,然而,TOPIX/Nikkei 指数几乎没有受到影响,并在日本央行加息前后继续创下新高。其实先前 9 月也出现了类似的情况,在政策变化的迹象浮现时,外资流出加速,但到了 10 月份,情况却出现了 180 度的逆转,市场并没有受到影响,类似的模式会在近期重演吗?

SignalPlus宏观分析(20240322):全球央行将开启降息周期

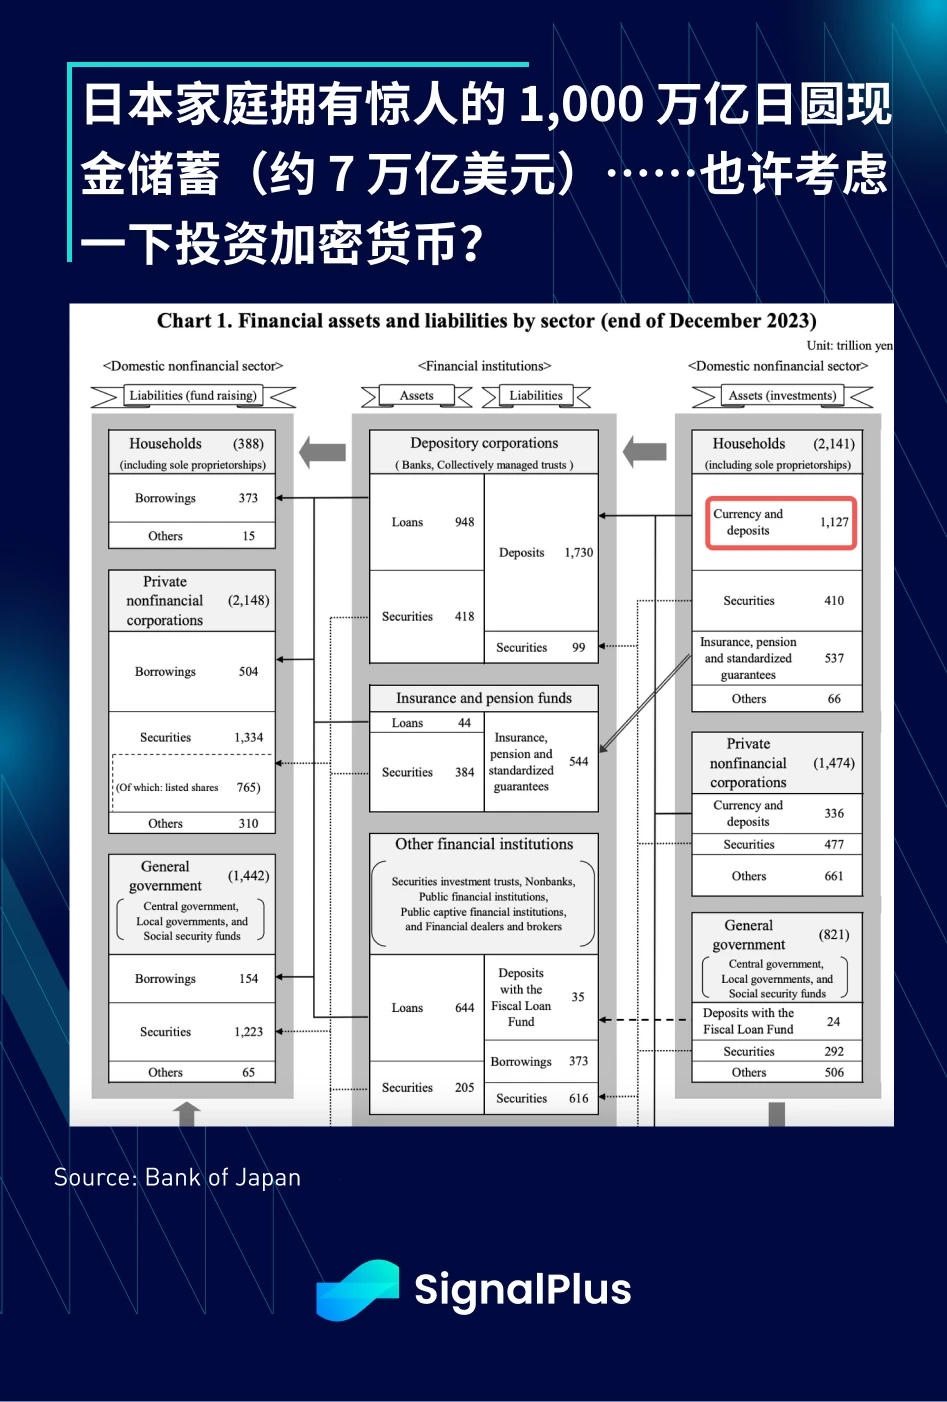
此外,日本央行最新的货币调查也显示出一些有趣的信息,日本家庭在现金和储蓄帐户持有惊人的 1, 000 万亿日圆(约 7 万亿美元),约占家庭金融资产的 53% ,远高于美国(13% )和欧洲(36% )。此外,中等家庭的股票投资价值年增约 30% , 1/10 的家庭通过资本利得获得超过 600 万日圆的收入,相当于家庭全年收入。随著人们对股票投资、购买房地产、工资通胀(33 年来最大的工会工资涨幅)、退出负利率政策以及持续的世代财富移转的态度终于发生了变化,他们将如何使用 7 万亿美元现金盈余,将是未来几年最重要的宏观叙事之一,他们是否有可能对加密货币多样化投资产生兴趣?

SignalPlus宏观分析(20240322):全球央行将开启降息周期

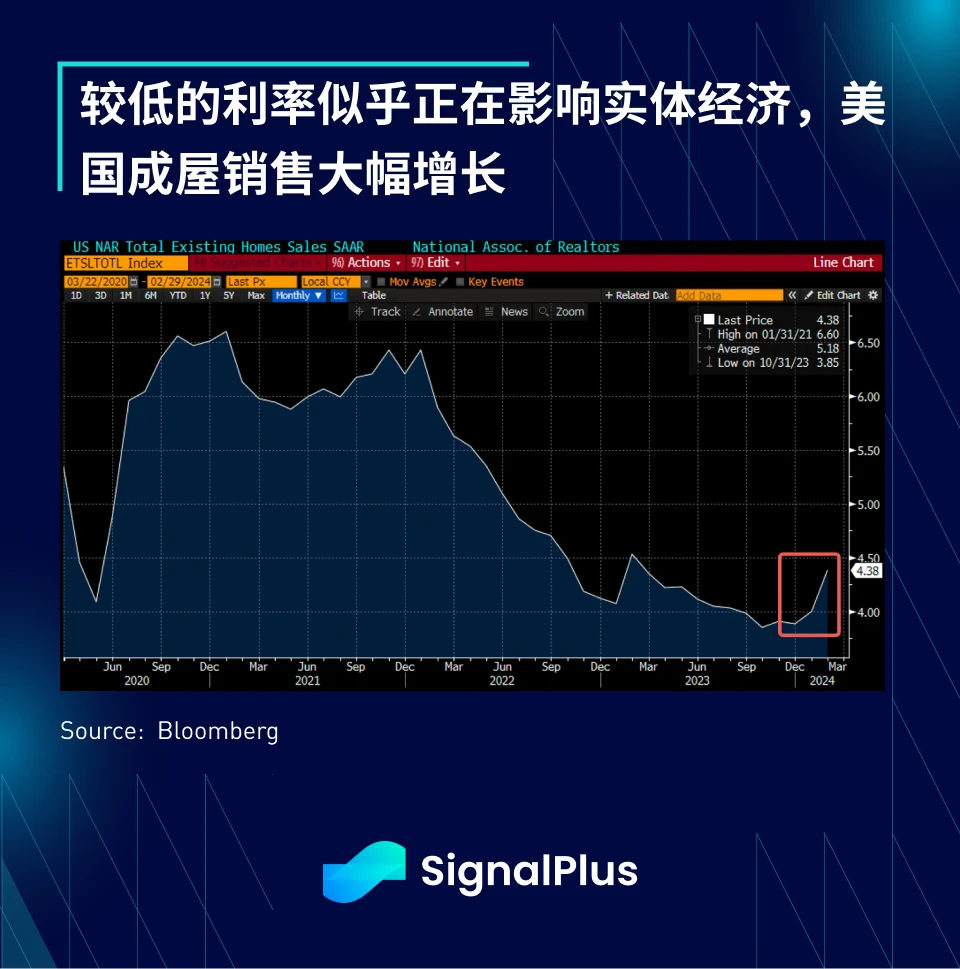
回到美国,股市一如既往升至新高(感谢美联储!)。经济数据显示,较低的抵押贷款利率似乎正顺利影响实体经济,成屋销售大幅增长,除了整体数据表现强劲外,住房供应和价格中位数(环比增长 0.5% )也显示出不错的增长,回到了疫情前的水平,预计美联储的降息将在下半年进一步提振需求。

SignalPlus宏观分析(20240322):全球央行将开启降息周期

股市方面,S&P 500 指数连续 4 日上涨,再创历史新高,尽管 Apple 股价因美国司法部起诉 iPhone 违反反垄断法而下跌 4% ,但不影响指数上涨。另一方面,随著投资者看好其为 AI 模型提供大量训练数据的愿景,Reddit 上市首日股价较发行价一度飙升了 67% 以上,最终收涨 48% ,这次 IPO 的成功可能会为一大批希望在市场情绪高涨的情况下上市的私人企业打开大门。

SignalPlus宏观分析(20240322):全球央行将开启降息周期

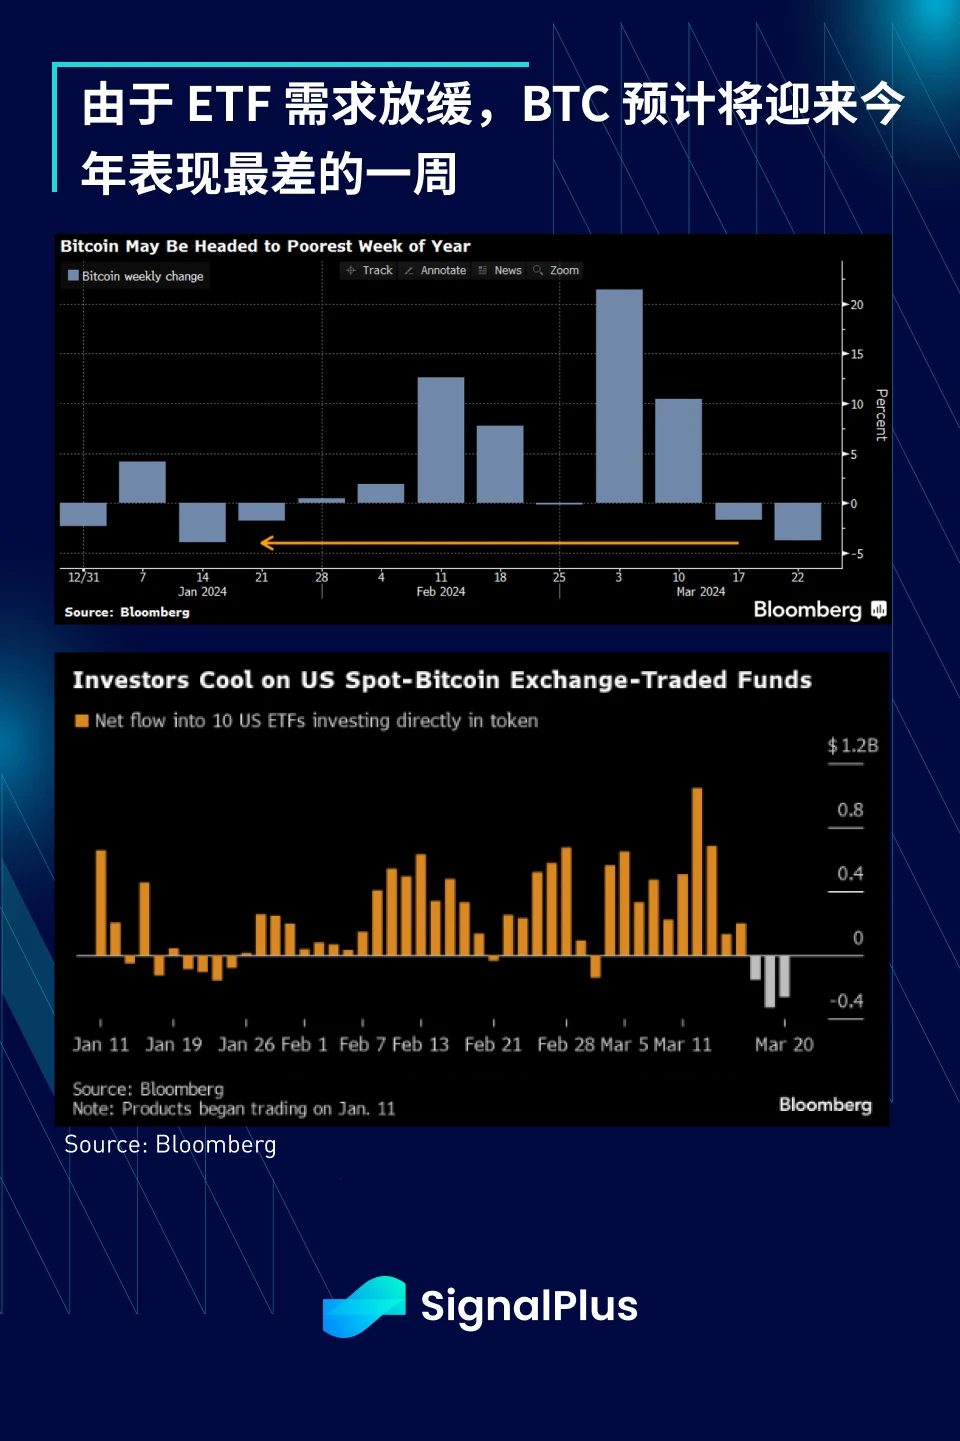
在加密货币方面,随著 ETF 需求放缓,BTC 正朝著今年表现最差的一周迈进,市场基调略显黯淡。在 3 月中旬创下一系列单日流入纪录后,BTC ETF 过去 3-4 天的净流入明显转负,同时 BTC 价格动能放缓,使得 BTC 仅勉强维持在 6.5 万美元以上。

SignalPlus宏观分析(20240322):全球央行将开启降息周期

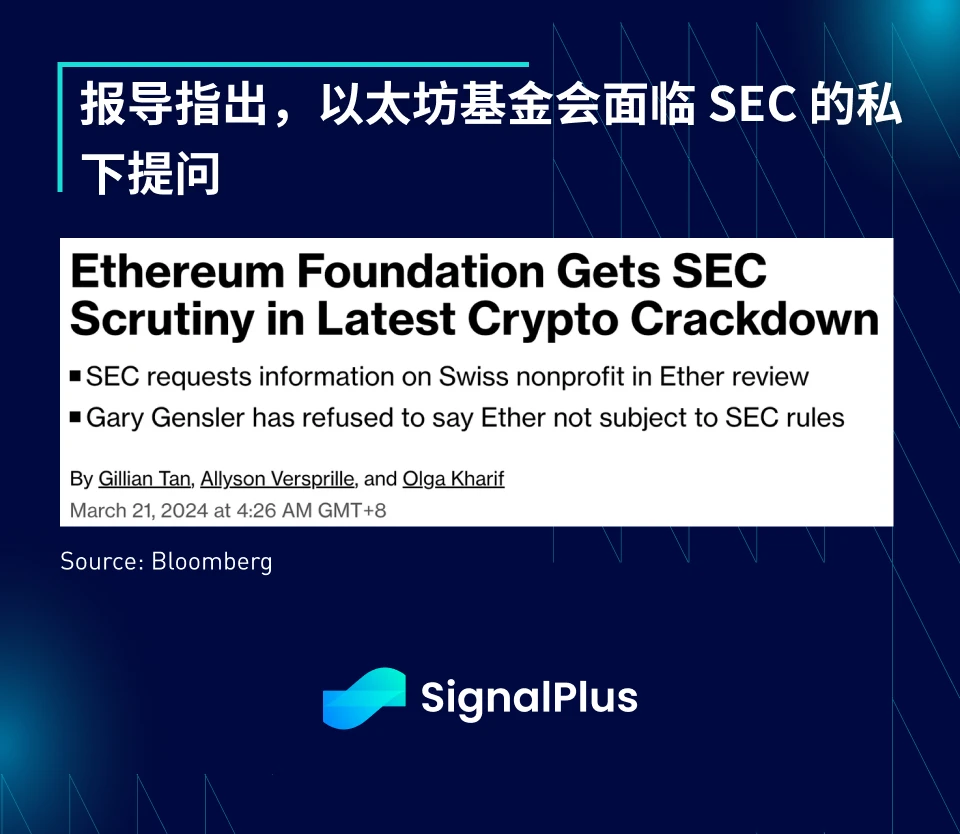
此外,美国 SEC 可能又回归旧有模式,Forbes 报导称,以太坊基金会正面临一个未具名“国家当局”的保密查询,开发人员在 GitHub 提交的 commit 中表示,“此提交删除了页脚的一部分,因为我们收到了国家当局的自愿查询,且被要求保密”,且自网站删除了一段基金会从未被全球任何国家机构以保密方式联系过的声明。

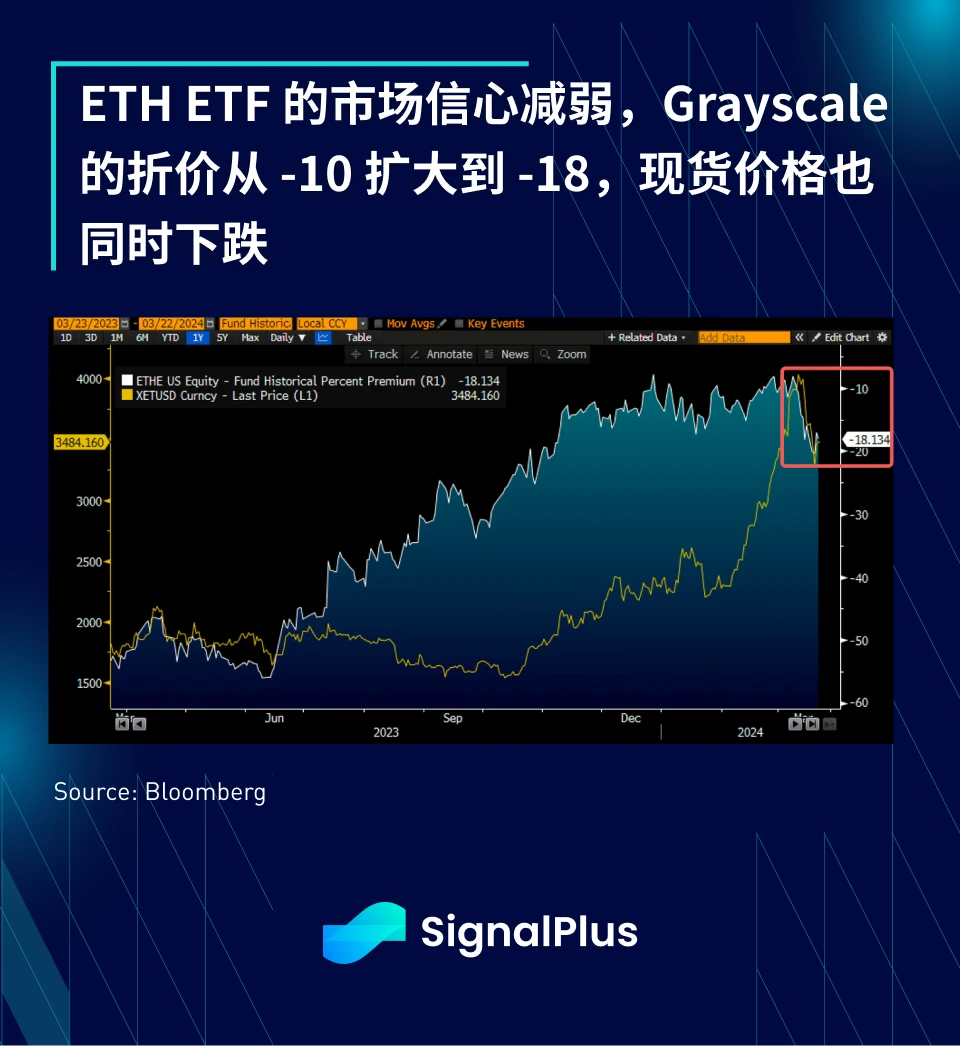
这次的保密查询出现在一个微妙的时间点,有迹象表明 ETH ETF 可能不会在 5 月获得 SEC 的批准,因为该机构仍然坚持 ETH 是一种证券,ETH 价格随之下跌,Grayscale Trust 的 ETH 折价也从 -10% 扩大到 -18% 。

总之,近期加密货币领域的狂热似乎有所消退,随著市场重建立足点,我们可能会看到市场在未来几天进行横向调整。

SignalPlus宏观分析(20240322):全球央行将开启降息周期

SignalPlus宏观分析(20240322):全球央行将开启降息周期

SignalPlus宏观分析(20240322):全球央行将开启降息周期

您可在 ChatGPT 4.0 的 Plugin Store 搜索 SignalPlus ,获取实时加密资讯。如果想即时收到我们的更新,欢迎关注我们的推特账号@SignalPlus_Web3 ,或者加入我们的微信群(添加小助手微信:xdengalin)、Telegram 群以及 Discord 社群,和更多朋友一起交流互动。

SignalPlus Official Website:https://www.signalplus.com

Related Reads

Rented Faith: How Much of the Bitcoin ETF Inflows Is Real Money?

"Rented Conviction: How Much of Bitcoin ETF Flows Is Real Money" The weekly inflows into Bitcoin ETFs are often interpreted as a gauge of institutional belief. However, a significant portion of this activity is driven by a hidden arbitrage trade, not directional conviction. The core mechanism is a cash-and-carry arbitrage: traders buy spot Bitcoin (often via ETFs) while simultaneously shorting CME futures to lock in the price difference, or "basis." This delta-neutral trade is essentially an interest rate play. In weekly data, about half the fluctuation in ETF flows can be explained by new short positions added by leveraged funds (hedge funds), with a correlation of 0.70. Bitcoin's price movement in a given week shows no statistical power in predicting these flows. While this arbitrage trade drives weekly *volatility*, it is not the main component of the cumulative *stock*. Of the total ~$55 billion in net ETF inflows, the current net arbitrage position is only about $1 billion. The remainder is steady, directional buying averaging ~$400 million per week, which constitutes the vast majority of the accumulated "mountain" over two years. Thus, ETF flow data overstates the *volatility* of conviction, not its *level*. This arbitrage trade has been unwinding for nearly two years. Leveraged fund short positions peaked at ~$14 billion in late 2024 and have since declined to ~$4.5 billion. When the basis compresses to unprofitable levels, ETF inflows and short positions retreat together. Recent outflows should not be mistaken for a loss of faith but rather the routine unwinding of this rate trade. For Ethereum ETFs, the pattern is weaker. Accounting for staking yield makes the basis often negative, so neither strong conviction buying nor robust arbitrage supports its flows. To interpret ETF flows correctly, monitor the CME basis versus T-bill rates and leveraged fund net shorts. They reveal how much of the next "demand" headline is real. The real, patient buy-and-hold demand is what constitutes the enduring bulk of ETF assets.

marsbit1m ago

Rented Faith: How Much of the Bitcoin ETF Inflows Is Real Money?

marsbit1m ago

Soaring Over Tenfold Within the Year: The Frenzy Over SK Hynix Leveraged Products

South China Morning Post The leveraged ETF tracking SK Hynix has surged over tenfold year-to-date, fueled by intense market speculation on the memory chip sector. By June 22, the value of the 'South Korea 2x Long SK Hynix ETF' listed in Hong Kong had skyrocketed by more than 1,061% since the start of the year, while its asset size exploded over twenty times from the end of last year. The rally is driven by AI-driven demand for high-bandwidth memory (HBM), with SK Hynix recently sampling its next-generation HBM4E product. However, industry professionals warn of significant risks. Leveraged ETFs magnify both gains and losses. During a recent market correction, while the underlying SK Hynix stock fell 19.1%, its double-leveraged ETF dropped nearly 38%. Korean regulators noted that such products could theoretically lose 60% in a single day. Additionally, these ETFs face risks like time decay in volatile markets, liquidity spirals during mass redemptions, and extreme price dislocations from market-making failures, as seen in early June when an ETF moved opposite to its underlying stock. The trading is predominantly driven by retail investors, with institutional capital largely absent due to the products' high volatility. Analysts caution that with the semiconductor sector at elevated valuations and facing geopolitical and supply chain uncertainties, leveraged ETFs pose a substantial threat of amplified losses for uninformed investors.

marsbit1h ago

Soaring Over Tenfold Within the Year: The Frenzy Over SK Hynix Leveraged Products

marsbit1h ago

18 Months, Over 50x Surge: KIOXIA's Epic Comeback

KIOXIA, a NAND flash memory giant, staged a dramatic comeback driven by AI demand. After a period of significant losses, a failed merger, and missed HBM opportunities, its 2024 IPO began modestly. However, fueled by explosive demand for AI data storage, its stock price skyrocketed over 50 times within 18 months, making it Japan's most valuable company, surpassing Toyota. Its Q1 FY2026 profit guidance soared 30-fold year-over-year, with 2026 NAND capacity already sold out. Key to its success is its 3D NAND technology, BiCS FLASH. As the inventor of NAND, KIOXIA advanced its technology through generations, reaching over 200 layers by 2023. Key innovations include CBA (CMOS directly Bonded to Array), which separately manufactures control circuits and memory arrays for better performance, and OPS (On Pitch Select Gate) to increase density. The company is now developing high-capacity packages like an 8TB solution stacking 32 dies. Looking beyond NAND, KIOXIA is exploring 3D DRAM with its OCTRAM technology, using oxide semiconductor transistors for ultra-low leakage to reduce power consumption. This fundamental research differs from HBM and represents a long-term bet to extend its 3D expertise from NAND into future DRAM architectures. KIOXIA's story highlights how technological assets and shifting market cycles can rapidly transform a company's fortunes. While questions remain about sustaining growth beyond the current AI boom, its resurgence demonstrates that in semiconductors, being down does not necessarily mean being out.

marsbit1h ago

18 Months, Over 50x Surge: KIOXIA's Epic Comeback

marsbit1h ago

Market Trends in U.S. Stocks (June 23): Peak at Listing? SpaceX Loses Over $800 Billion in Three Days, Tech Stocks Experience Severe Internal Divergence

Stock Market Trends (June 23): Did SpaceX Peak at IPO? The company loses over $800 billion in market value in three days as a sharp divergence unfolds within the tech sector. SpaceX's post-IPO decline of over 20%, falling below its first-day close, reflects a swift market repricing. The catalyst is a clear shift in narrative from "AI platform potential" to concerns over rising capital costs, as its $8.57 billion IPO and subsequent $20 billion debt offering are earmarked for acquisitions and refinancing existing bridge loans rather than de-leveraging. While high-valuation tech stocks like Google, Meta, Amazon, and Microsoft faced pressure, Micron surged nearly 7% to a record high following a strategic supply deal with Anthropic for HBM and memory, highlighting robust, tangible demand in AI infrastructure. The broader market saw funds rotate into more defensive industrial and financial names. Macro factors included a dip in oil prices to a three-month low on news of a US-Iran framework deal, though logistical hurdles for resuming full Strait of Hormuz shipments remain. Key events ahead include Nvidia's shareholder meeting, Micron's earnings, and the May PCE inflation data. The latter will be crucial in determining whether the sell-off in high-valuation growth stocks, which appears to have just begun, will persist.

marsbit1h ago

Market Trends in U.S. Stocks (June 23): Peak at Listing? SpaceX Loses Over $800 Billion in Three Days, Tech Stocks Experience Severe Internal Divergence

marsbit1h ago

Trading

Spot
Futures
活动图片