Tác giả: Artemis
Biên dịch: Deep Tide TechFlow
Báo cáo này phân tích thực nghiệm việc sử dụng stablecoin cho thanh toán, bao gồm các giao dịch cá nhân với cá nhân (P2P), doanh nghiệp với doanh nghiệp (B2B) và giữa cá nhân với doanh nghiệp (P2B/B2P).
Báo cáo này thông qua phân tích thực nghiệm tình hình sử dụng stablecoin cho thanh toán, nghiên cứu các mô hình giao dịch cá nhân với cá nhân (P2P), doanh nghiệp với doanh nghiệp (B2B) và giữa cá nhân với doanh nghiệp (P2B/B2P). Chúng tôi sử dụng bộ dữ liệu Artemis, cung cấp siêu dữ liệu về địa chỉ ví, bao gồm ước tính vị trí địa lý, nhãn sở hữu tổ chức và định danh hợp đồng thông minh. Thông qua đặc điểm của ví người gửi và người nhận, chúng tôi phân loại các giao dịch. Trọng tâm phân tích đặt trên mạng Ethereum, mạng lưới chịu trách nhiệm cho khoảng 52% nguồn cung stablecoin toàn cầu.
Chúng tôi chủ yếu nghiên cứu hai stablecoin chủ đạo: USDT và USDC, chúng cùng chiếm 88% thị phần. Mặc dù tỷ lệ chấp nhận và sự quan tâm quản lý đối với stablecoin đã tăng lên đáng kể trong năm qua, một câu hỏi then chốt vẫn chưa được trả lời: việc sử dụng stablecoin thực tế trong thanh toán so với các hoạt động khác như thế nào? Báo cáo này nhằm mục đích làm sáng tỏ các động lực chính thúc đẩy việc áp dụng thanh toán bằng stablecoin và cung cấp những hiểu biết để dự đoán xu hướng tương lai.
1. Bối cảnh
Những năm gần đây, tỷ lệ chấp nhận stablecoin đã tăng trưởng đáng kể, nguồn cung của nó đã đạt 2000 tỷ USD, hiện tổng khối lượng chuyển khoản gốc hàng tháng đã vượt quá 4 nghìn tỷ USD. Mặc dù mạng lưới blockchain cung cấp hồ sơ giao dịch hoàn toàn minh bạch và tất cả giao dịch đều có thể được phân tích, nhưng do tính ẩn danh của các mạng lưới này và thiếu thông tin về mục đích giao dịch (ví dụ: thanh toán trong nước, thanh toán xuyên biên giới, giao dịch, v.v.), việc phân tích giao dịch và người dùng vẫn còn rất khó khăn.
Hơn nữa, việc sử dụng hợp đồng thông minh và giao dịch tự động trên các mạng như Ethereum làm tăng thêm tính phức tạp của phân tích, vì một giao dịch duy nhất có thể liên quan đến tương tác với nhiều hợp đồng thông minh và token. Do đó, một vấn đề then chốt chưa được giải quyết là làm thế nào để đánh giá tỷ trọng giữa việc sử dụng stablecoin hiện tại trong lĩnh vực thanh toán so với các hoạt động khác (như giao dịch). Mặc dù nhiều nhà nghiên cứu đang nỗ lực giải quyết vấn đề phức tạp này, báo cáo này nhằm cung cấp phương pháp bổ sung để đánh giá việc sử dụng stablecoin, đặc biệt là mục đích thanh toán.
Nhìn chung, có hai phương pháp chính để đánh giá việc sử dụng stablecoin (đặc biệt là cho mục đích thanh toán).
Phương pháp đầu tiên là phương pháp lọc (filtering approach), phương pháp này sử dụng dữ liệu giao dịch blockchain thô và thông qua kỹ thuật lọc để loại bỏ nhiễu, từ đó ước tính chính xác hơn việc sử dụng stablecoin cho thanh toán.
Phương pháp thứ hai là khảo sát các nhà cung cấp dịch vụ thanh toán stablecoin chính và dựa trên dữ liệu thanh toán mà họ tiết lộ để ước tính hoạt động của stablecoin.
Visa Onchain Analytics Dashboard do Visa phối hợp với Allium Labs phát triển đã sử dụng phương pháp đầu tiên. Họ sử dụng kỹ thuật lọc để giảm nhiễu trong dữ liệu thô, từ đó cung cấp thông tin rõ ràng hơn về hoạt động stablecoin. Nghiên cứu chỉ ra rằng, sau khi lọc dữ liệu thô, tổng khối lượng giao dịch stablecoin hàng tháng giảm từ khoảng 5 nghìn tỷ USD (tổng khối lượng giao dịch) xuống còn 1 nghìn tỷ USD (khối lượng giao dịch đã điều chỉnh). Nếu chỉ xét khối lượng giao dịch bán lẻ (các giao dịch có giá trị dưới 250 USD), khối lượng giao dịch chỉ là 6 tỷ USD. Chúng tôi đã sử dụng phương pháp lọc tương tự như Visa Onchain Analytics Dashboard, nhưng phương pháp của chúng tôi tập trung hơn vào việc đánh dấu rõ ràng các giao dịch là dùng cho thanh toán.
Phương pháp thứ hai dựa trên dữ liệu khảo sát công ty, đã được áp dụng trong "Báo cáo Tình hình Stablecoin 2025 của Fireblocks" và "Báo cáo Thanh toán Stablecoin từ Con số Không". Hai báo cáo này sử dụng thông tin tiết lộ từ các công ty chính trên thị trường thanh toán blockchain để ước tính việc sử dụng trực tiếp stablecoin trong thanh toán. Đặc biệt, "Báo cáo Thanh toán Stablecoin từ Con số Không" cung cấp ước tính tổng thể về khối lượng giao dịch thanh toán stablecoin và chia các khoản thanh toán này thành các loại như B2B (doanh nghiệp với doanh nghiệp), B2C (doanh nghiệp với người tiêu dùng), P2P (cá nhân với cá nhân), v.v. Báo cáo cho thấy, tính đến tháng 2 năm 2025, tổng giá trị thanh toán hàng năm là khoảng 72,3 tỷ USD, trong đó phần lớn là giao dịch B2B.
Đóng góp chính của nghiên cứu này là áp dụng phương pháp lọc dữ liệu để ước tính việc sử dụng stablecoin trong thanh toán trên chuỗi. Kết quả nghiên cứu làm sáng tỏ tình hình sử dụng stablecoin và cung cấp ước tính chính xác hơn. Ngoài ra, chúng tôi còn cung cấp hướng dẫn cho các nhà nghiên cứu về việc sử dụng phương pháp lọc dữ liệu để xử lý dữ liệu blockchain thô, giảm nhiễu và cải thiện ước tính.
2. Dữ liệu
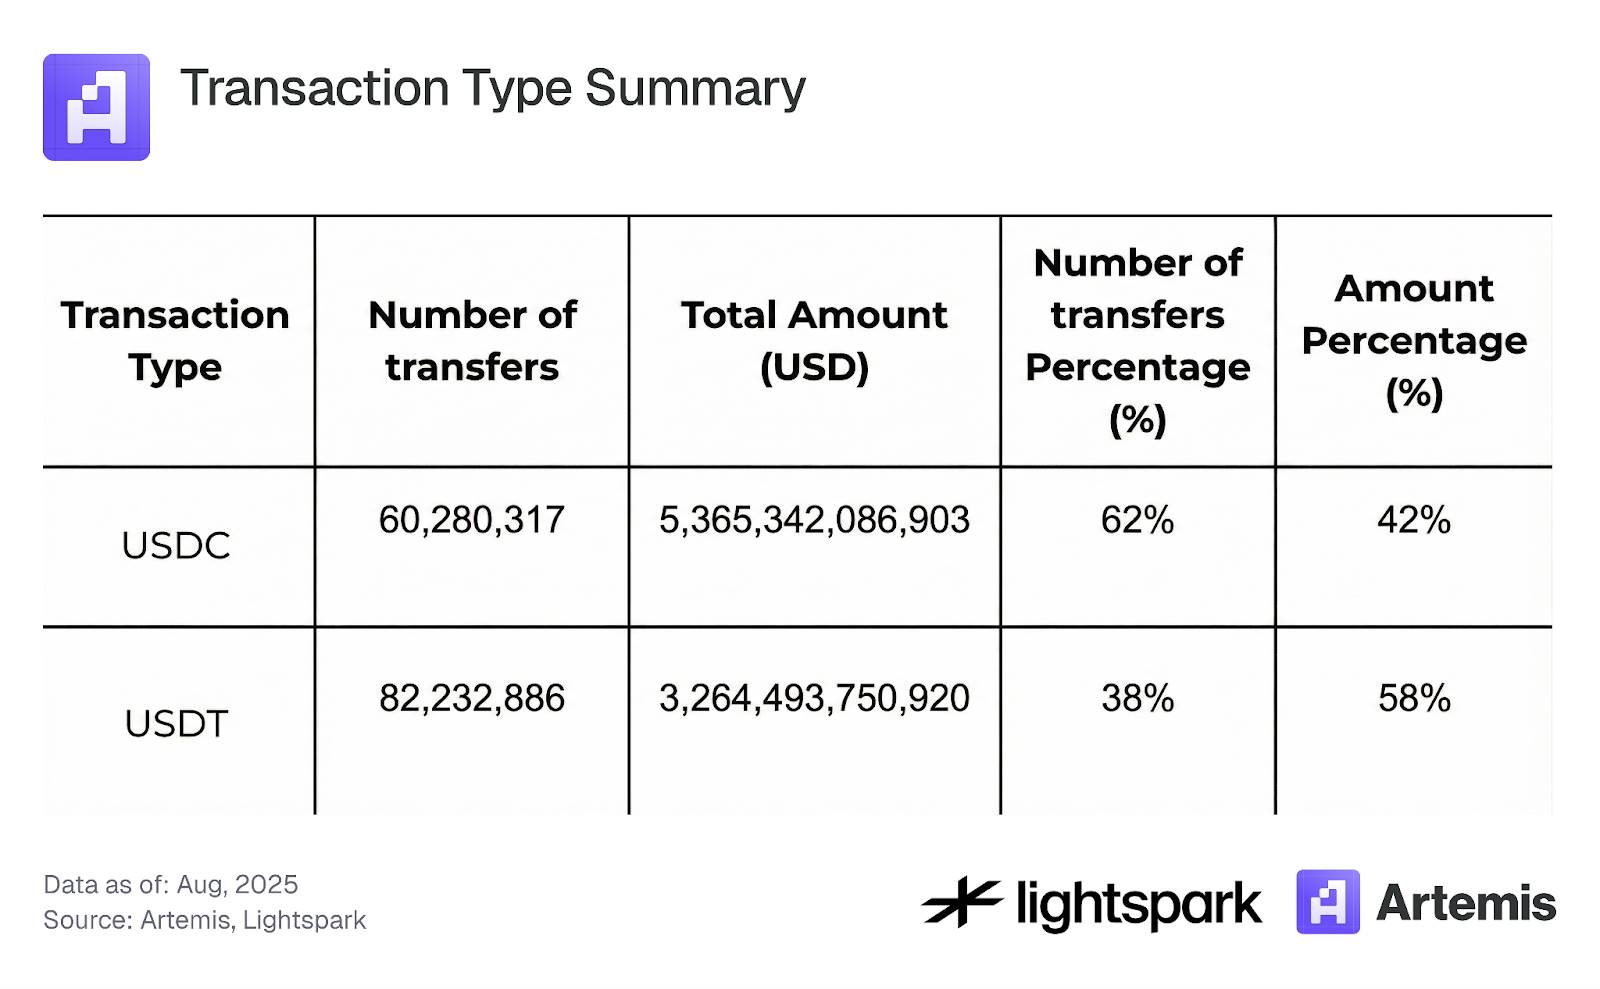
Bộ dữ liệu của chúng tôi bao gồm tất cả các giao dịch stablecoin trên blockchain Ethereum từ tháng 8 năm 2024 đến tháng 8 năm 2025. Trọng tâm phân tích là các giao dịch liên quan đến hai stablecoin chính là USDC và USDT. Lý do chọn hai stablecoin này là do thị phần cao và tính ổn định giá mạnh, từ đó giảm nhiễu trong quá trình phân tích. Chúng tôi chỉ tập trung vào các giao dịch chuyển tiền, loại trừ các giao dịch đúc (mint), hủy (burn) hoặc cầu nối chuỗi chéo (bridge). Bảng 1 tóm tắt tình hình chung của bộ dữ liệu được sử dụng để phân tích.
Bảng 1: Tóm tắt loại giao dịch
3. Phương pháp và Kết quả
Trong phần này, chúng tôi nêu chi tiết phương pháp được sử dụng để phân tích việc sử dụng stablecoin, tập trung vào các giao dịch thanh toán. Đầu tiên, chúng tôi lọc dữ liệu bằng cách phân biệt các giao dịch liên quan đến tương tác với hợp đồng thông minh và các giao dịch thể hiện chuyển khoản giữa các EOA (Tài khoản Bên ngoài), và phân loại phần sau là giao dịch thanh toán. Quá trình này được mô tả chi tiết trong Mục 3.1. Sau đó, Mục 3.2 giải thích cách sử dụng dữ liệu nhãn tài khoản EOA do Artemis cung cấp để phân loại thêm các giao dịch thanh toán thành P2P, B2B, B2P, P2B và giao dịch Nội bộ B. Cuối cùng, Mục 3.3 phân tích mức độ tập trung của các giao dịch stablecoin.
3.1 Thanh toán Stablecoin (EOA) so với Giao dịch Hợp đồng Thông minh
Trong lĩnh vực tài chính phi tập trung (DeFi), nhiều giao dịch liên quan đến tương tác với hợp đồng thông minh và kết hợp nhiều thao tác tài chính trong cùng một giao dịch, chẳng hạn như hoán đổi token này sang token khác thông qua nhiều nhóm thanh khoản. Sự phức tạp này khiến việc phân tích việc sử dụng stablecoin chỉ cho mục đích thanh toán trở nên khó khăn hơn.
Để đơn giản hóa phân tích và nâng cao khả năng đánh dấu các giao dịch blockchain stablecoin cho mục đích thanh toán, chúng tôi định nghĩa thanh toán stablecoin là bất kỳ giao dịch chuyển stablecoin ERC-20 từ địa chỉ EOA này sang địa chỉ EOA khác (không bao gồm giao dịch đúc và hủy). Bất kỳ giao dịch nào không được đánh dấu là thanh toán sẽ được phân loại là giao dịch hợp đồng thông minh, bao gồm tất cả các giao dịch liên quan đến tương tác với hợp đồng thông minh (ví dụ: chủ yếu là giao dịch DeFi).
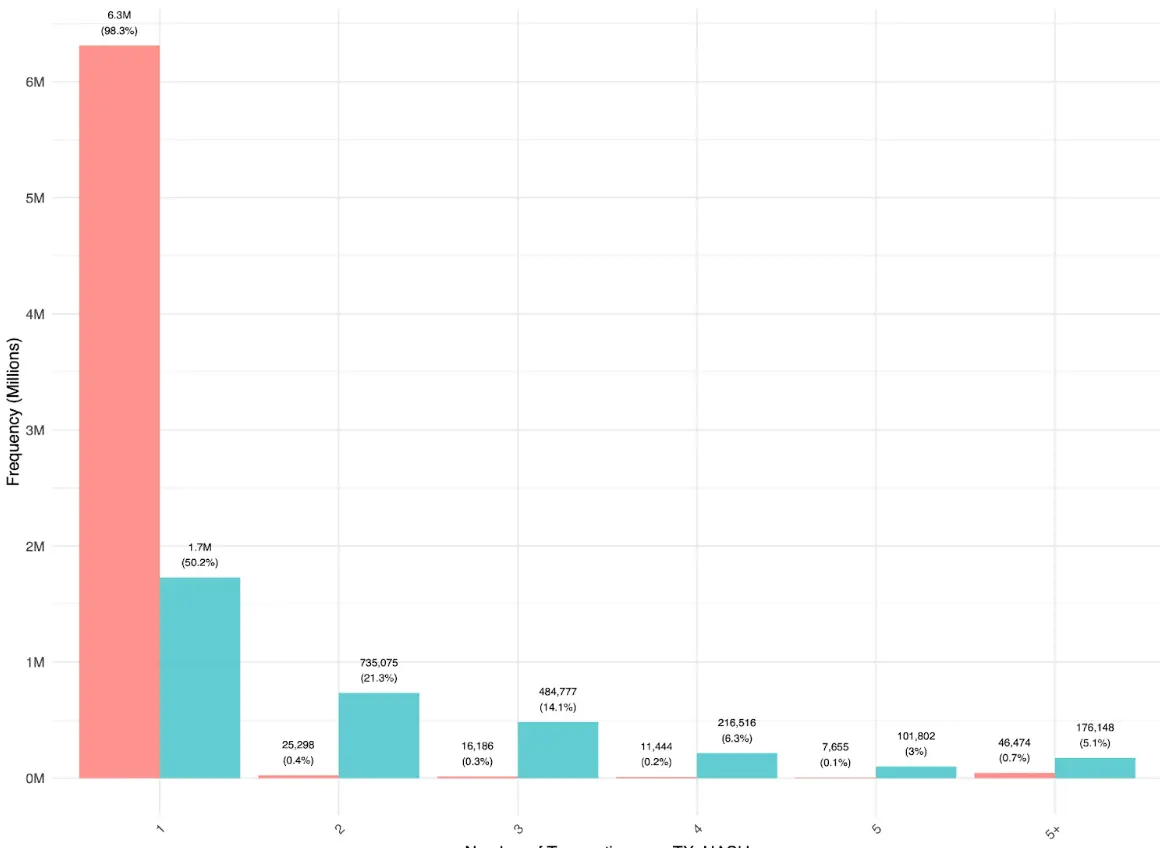
Hình 1 cho thấy, hầu hết các khoản thanh toán giữa người dùng (EOA-EOA) được thực hiện trực tiếp, mỗi giá trị băm giao dịch chỉ tương ứng với một lần chuyển khoản. Một số chuyển khoản đa EOA-EOA trong cùng giá trị băm giao dịch chủ yếu được thực hiện thông qua bộ tổng hợp, điều này cho thấy việc sử dụng bộ tổng hợp trong các giao dịch chuyển khoản đơn giản vẫn còn ít. Ngược lại, sự phân bố của các giao dịch hợp đồng thông minh thì khác, chứa nhiều giao dịch chuyển khoản nhiều lần hơn. Điều này cho thấy, trong các thao tác DeFi, stablecoin thường được luân chuyển giữa các ứng dụng và bộ định tuyến khác nhau, cuối cùng quay trở lại tài khoản EOA.
Hình 1:
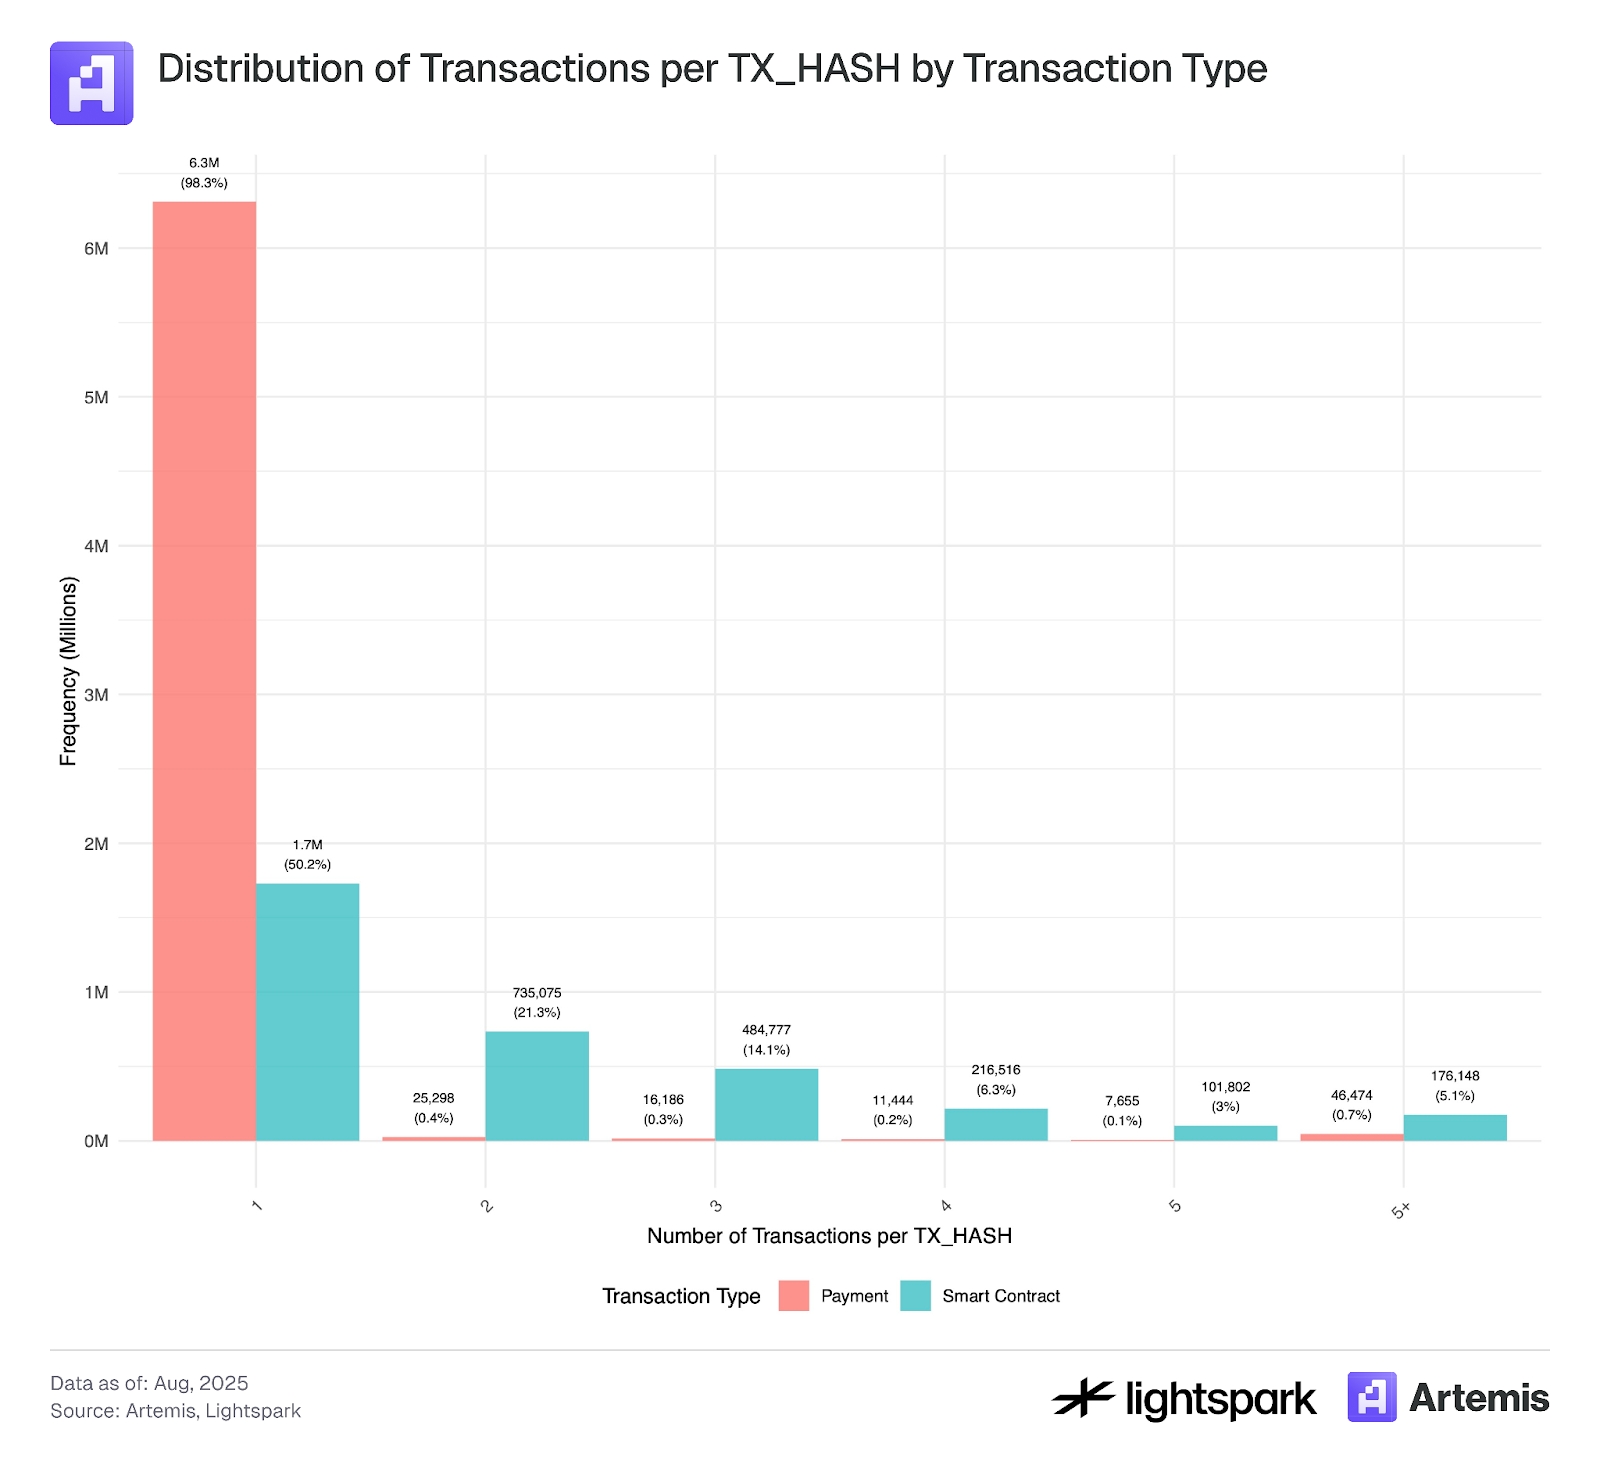
*Dữ liệu mẫu cho phân tích này bao gồm các giao dịch từ ngày 4 tháng 7 năm 2025 đến ngày 31 tháng 7 năm 2025.
Bảng 2 và Hình 2 cho thấy, xét về số lượng giao dịch, tỷ lệ giữa thanh toán (EOA-EOA) và giao dịch hợp đồng thông minh (DeFi) xấp xỉ 50:50, trong đó giao dịch hợp đồng thông minh chiếm 53,2% khối lượng giao dịch. Tuy nhiên, Hình 2 cho thấy, khối lượng giao dịch (tổng số tiền chuyển) biến động nhiều hơn so với số lượng giao dịch, điều này cho thấy chủ yếu là các khoản chuyển EOA-EOA lớn của các tổ chức đã dẫn đến những biến động này.
Bảng 2: Tóm tắt loại giao dịch
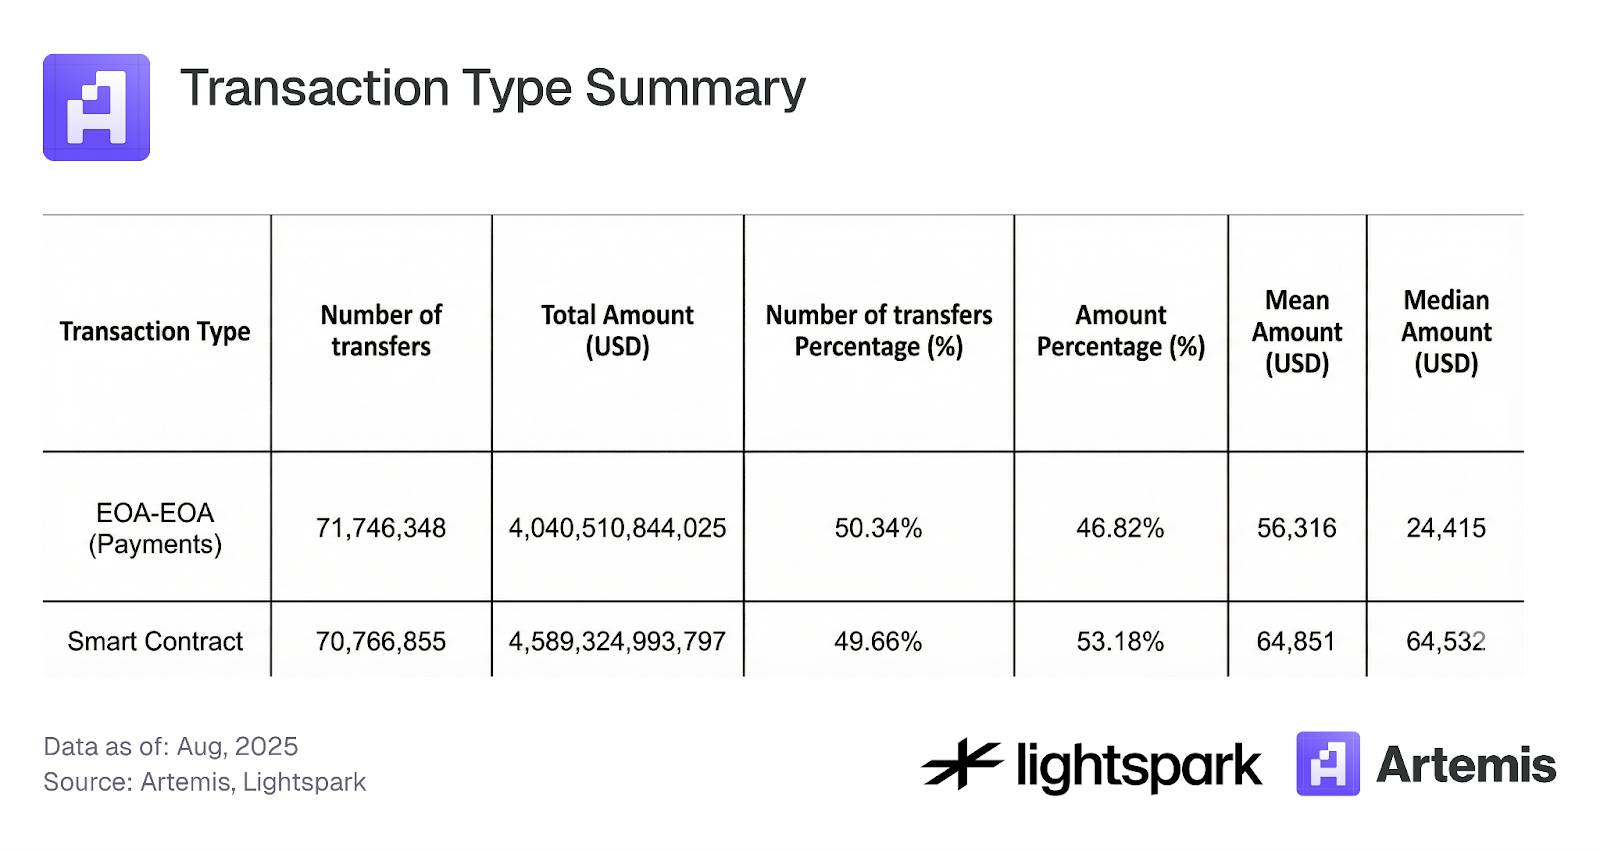
Hình 2:
Hình 3 khám phá phân bố số tiền giao dịch của thanh toán (EOA-EOA) so với giao dịch hợp đồng thông minh. Phân bố số tiền cho cả giao dịch thanh toán và giao dịch hợp đồng thông minh đều tương tự như phân phối chuẩn đuôi dày, với giá trị trung bình khoảng từ 100 USD đến 1000 USD.
Tuy nhiên, các giao dịch có số tiền dưới 0,1 USD cho thấy một đỉnh cao đáng kể, điều này có thể cho thấy sự tồn tại của hoạt động bot hoặc các thao tác giao dịch liên quan đến hoạt động giao dịch giả và giao dịch rửa tiền, phù hợp với mô tả của Halaburda et al. (2025) và Cong et al. (2023).
Do phí Gas của Ethereum thường vượt quá 0,1 USD, nên các giao dịch dưới ngưỡng đó cần được kiểm tra kỹ lưỡng hơn và có thể bị loại khỏi phân tích.
Hình 3:
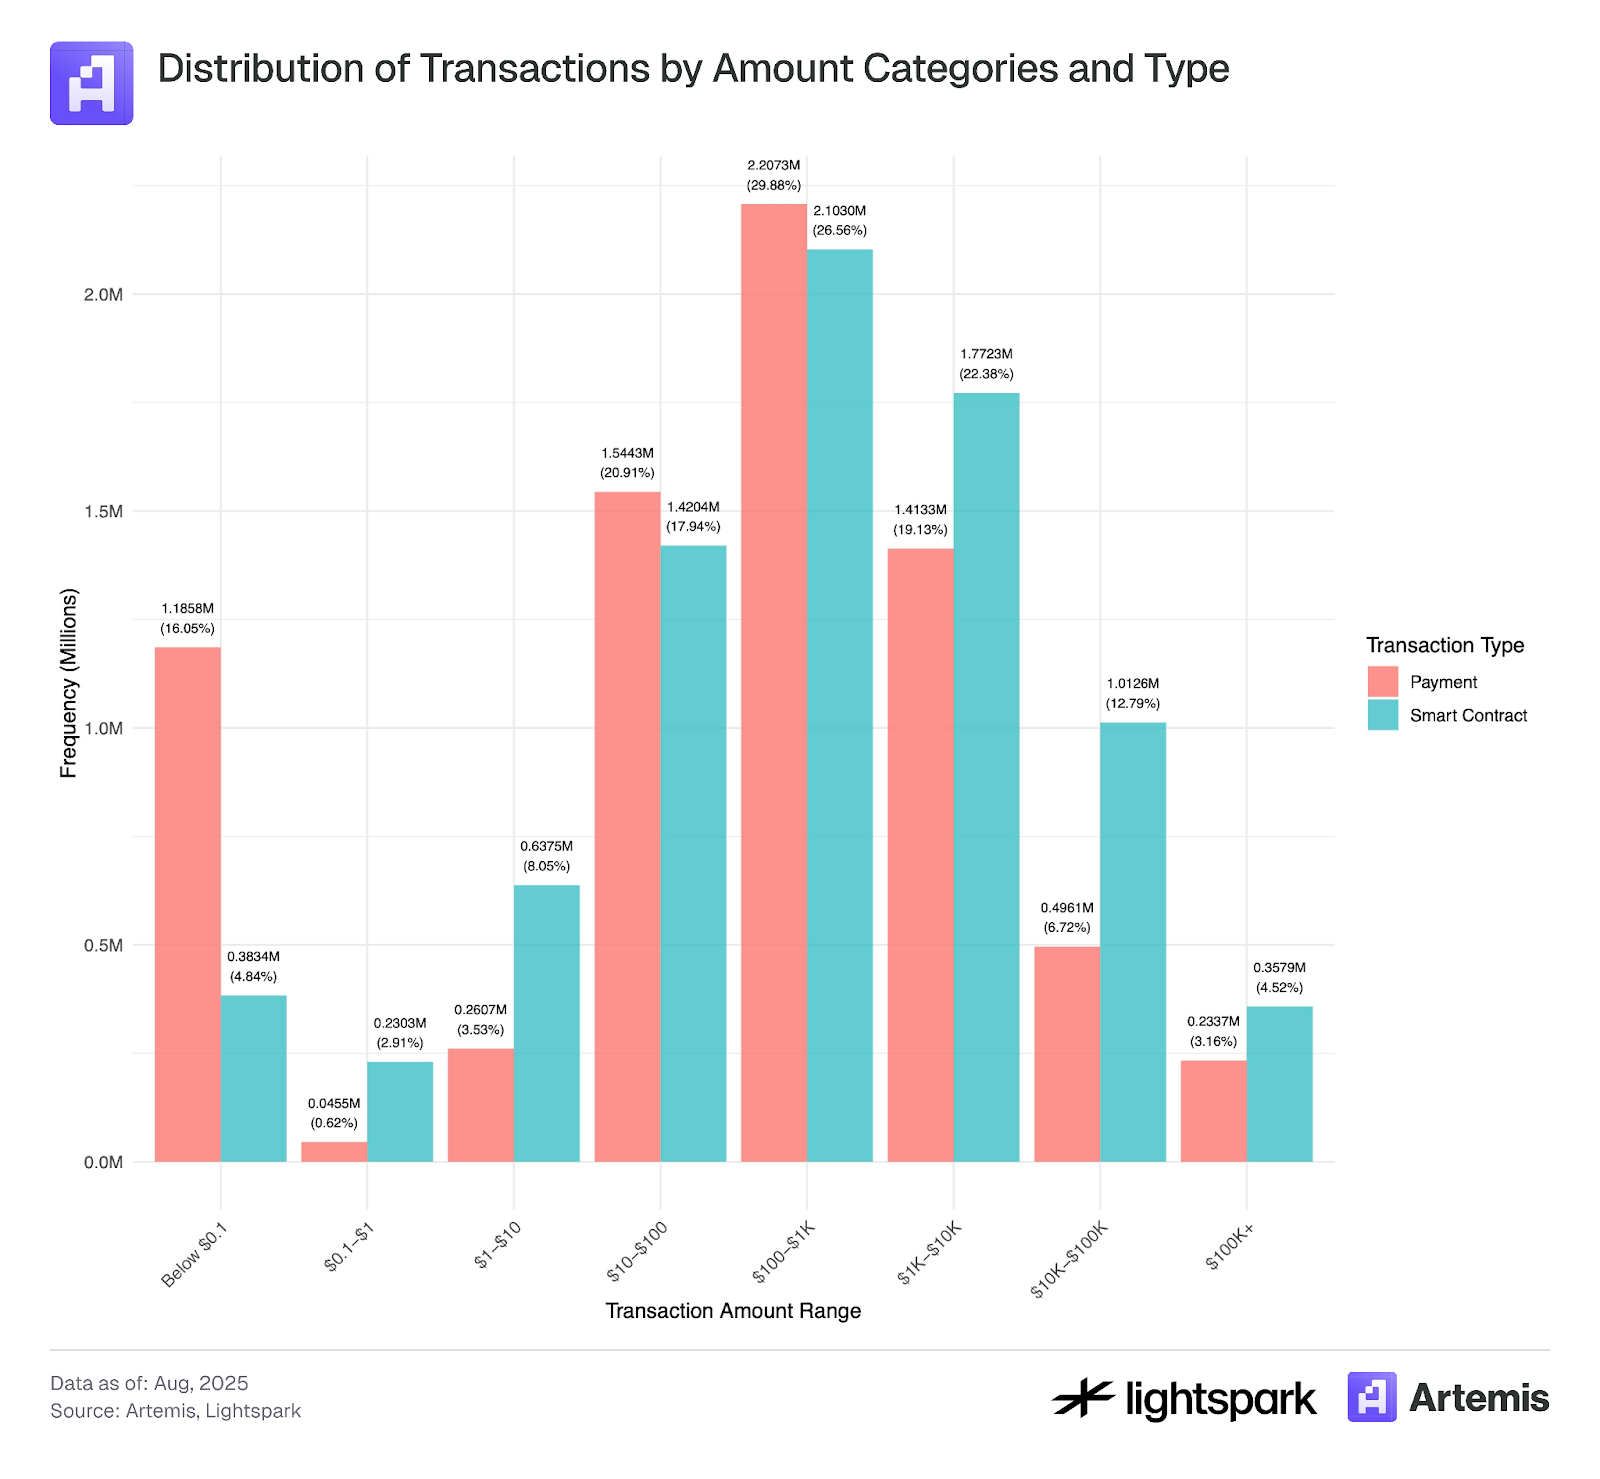
Dữ liệu mẫu được sử dụng cho phân tích này bao gồm hồ sơ giao dịch từ ngày 4 tháng 7 năm 2025 đến ngày 31 tháng 7 năm 2025.
3.2 Loại hình Thanh toán
Bằng cách sử dụng thông tin nhãn do Artemis cung cấp, có thể phân tích sâu hơn các khoản thanh toán giữa hai EOA (Tài khoản Bên ngoài). Artemis cung cấp thông tin nhãn cho nhiều địa chỉ ví Ethereum, có thể xác định các ví do các tổ chức (ví dụ: Coinbase) sở hữu. Chúng tôi chia các giao dịch thanh toán thành năm loại: P2P, B2B, B2P, P2B và Nội bộ B. Dưới đây là mô tả chi tiết cho từng loại.
Thanh toán P2P:
Thanh toán blockchain P2P (cá nhân với cá nhân) đề cập đến các giao dịch chuyển tiền trực tiếp từ người dùng này sang người dùng khác thông qua mạng blockchain. Trong các blockchain dựa trên tài khoản (như Ethereum), các giao dịch P2P này được định nghĩa là quá trình chuyển tài sản kỹ thuật số từ ví của người dùng (tài khoản EOA) sang ví EOA của người dùng khác. Tất cả các giao dịch đều được ghi lại và xác minh trên blockchain mà không cần sự tham gia của cơ quan trung gian.
Thách thức chính:
Một thách thức chính là xác định xem một giao dịch giữa hai ví trong hệ thống tài khoản có thực sự xảy ra giữa hai chủ thể độc lập (tức là cá nhân chứ không phải công ty) hay không và phân loại chính xác là giao dịch P2P. Ví dụ, người dùng chuyển tiền giữa các tài khoản của chính họ (tức là tài khoản Sybil) không nên được tính là giao dịch P2P. Tuy nhiên, nếu chúng ta đơn giản định nghĩa tất cả các giao dịch giữa các EOA (Tài khoản Bên ngoài) là giao dịch P2P, thì có thể phân loại nhầm các giao dịch chuyển khoản như vậy là P2P.
Một vấn đề khác là khi một tài khoản EOA được sở hữu bởi một công ty, chẳng hạn như sàn giao dịch tập trung (CEX, như Coinbase), thì ví EOA đó thực tế không được sở hữu bởi một cá nhân thực. Trong bộ dữ liệu của chúng tôi, chúng tôi có thể thêm nhãn cho nhiều ví EOA của tổ chức và công ty; tuy nhiên, do thông tin nhãn không hoàn toàn đầy đủ, một số ví EOA được công ty sở hữu nhưng không được ghi lại trong bộ dữ liệu của chúng tôi có thể bị đánh dấu nhầm là ví cá nhân.
Cuối cùng, phương pháp này không nắm bắt được các khoản thanh toán blockchain P2P được thực hiện thông qua các trung gian - còn được gọi là mô hình "stablecoin kẹp". Trong mô hình này, tiền được chuyển giữa người dùng thông qua một trung gian sử dụng blockchain để thanh toán. Cụ thể, tiền pháp định đầu tiên được gửi đến trung gian, trung gian chuyển đổi nó thành tiền mã hóa, sau đó tiền được chuyển qua mạng blockchain, và cuối cùng trung gian của người nhận (có thể là cùng một trung gian hoặc trung gian khác nhau) chuyển đổi nó trở lại thành tiền pháp định. Chuyển khoản blockchain là "lớp giữa" của "chiếc bánh kẹp", trong khi việc chuyển đổi tiền pháp định tạo thành "lớp ngoài". Thách thức chính trong việc xác định các giao dịch này là chúng được thực hiện bởi các trung gian, những người có thể gộp nhiều giao dịch lại với nhau để giảm phí Gas. Do đó, một số dữ liệu quan trọng (như số tiền giao dịch chính xác và số lượng người dùng liên quan) chỉ khả dụng trên nền tảng của trung gian.
Thanh toán B2B:
Giao dịch doanh nghiệp với doanh nghiệp (B2B) đề cập đến chuyển khoản điện tử từ một doanh nghiệp này sang doanh nghiệp khác thông qua mạng blockchain. Trong bộ dữ liệu của chúng tôi, thanh toán stablecoin là chuyển khoản giữa hai ví EOA của tổ chức đã biết, ví dụ từ Coinbase chuyển đến Binance.
Thanh toán Nội bộ B:
Các giao dịch giữa hai ví EOA của cùng một tổ chức được đánh dấu là giao dịch Nội bộ B.
Thanh toán P2B (hoặc B2P):
Giao dịch cá nhân với doanh nghiệp (P2B) hoặc doanh nghiệp với cá nhân (B2P) đề cập đến chuyển khoản điện tử giữa cá nhân và doanh nghiệp, giao dịch có thể là hai chiều.
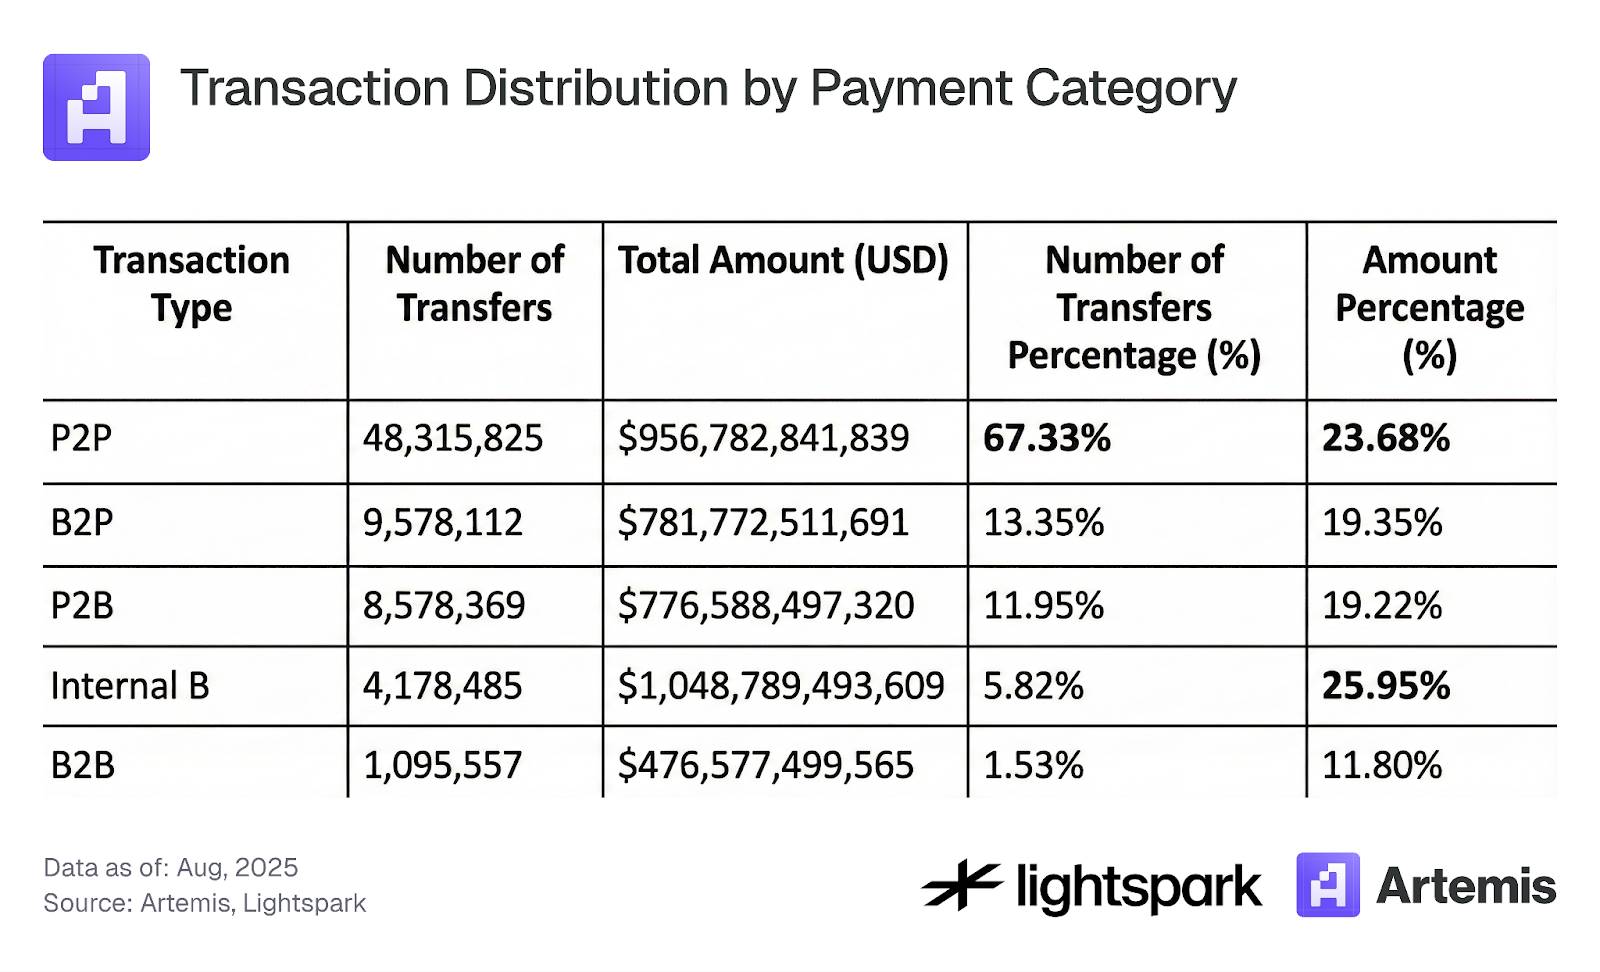
Bằng phương pháp gắn nhãn này, chúng tôi phân tích dữ liệu thanh toán (chỉ chuyển khoản EOA-EOA), kết quả chính được tóm tắt trong Bảng 3. Dữ liệu cho thấy, 67% giao dịch EOA-EOA thuộc loại P2P, nhưng chúng chỉ chiếm 24% tổng khối lượng thanh toán. Kết quả này tiếp tục chỉ ra rằng, so với các tổ chức, người dùng P2P chuyển khoản với số tiền thấp hơn. Hơn nữa, một trong những loại có khối lượng giao dịch thanh toán cao nhất là Nội bộ B, điều này có nghĩa là các khoản chuyển tiền trong cùng một tổ chức chiếm một tỷ lệ lớn. Việc khám phá ý nghĩa cụ thể của các giao dịch Nội bộ B và cách thống kê chúng trong phân tích hoạt động thanh toán vẫn là một vấn đề thú vị cần nghiên cứu.
Bảng 3: Phân bố giao dịch theo loại hình thanh toán
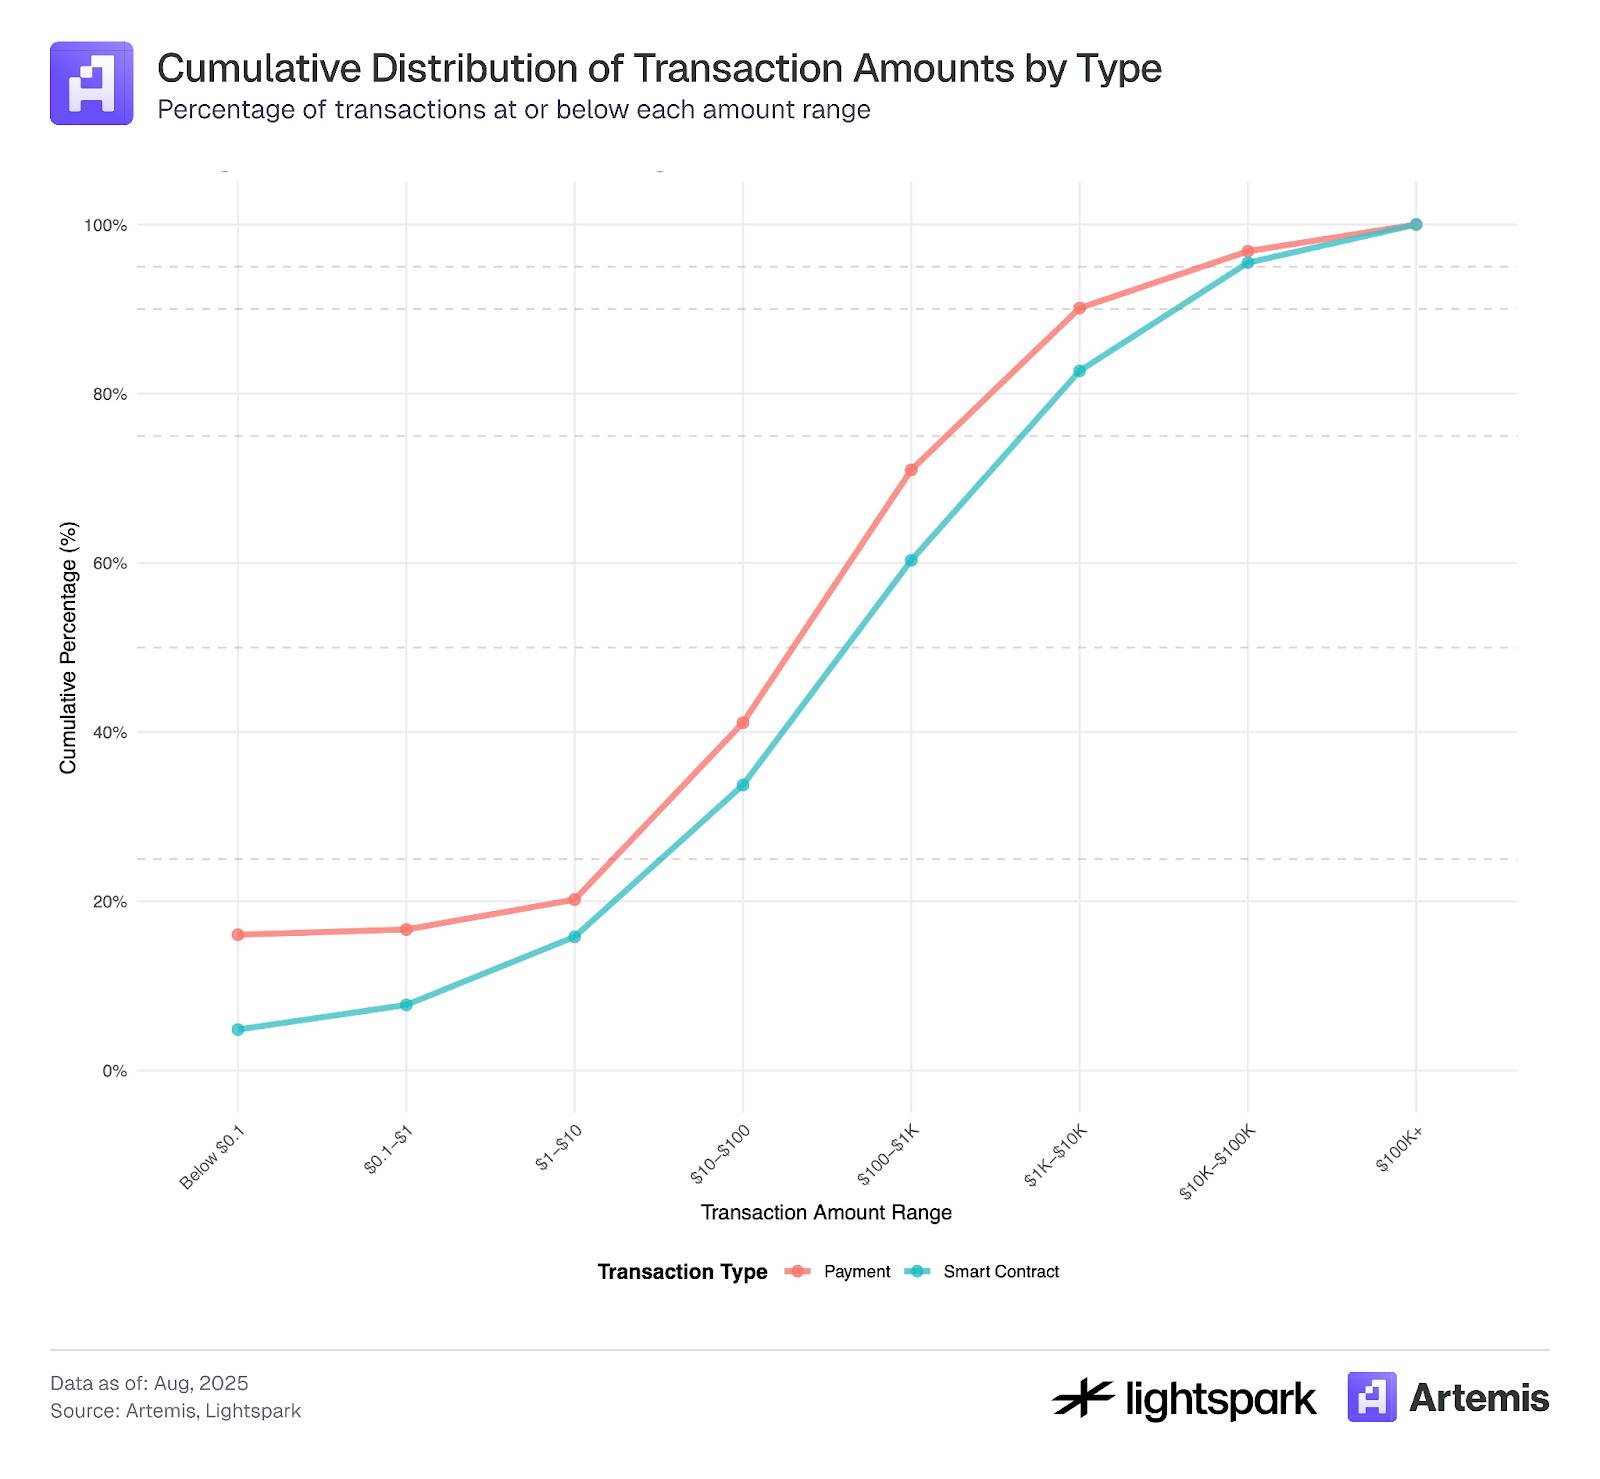
Cuối cùng, Hình 4 cho thấy hàm phân phối tích lũy (CDF) số tiền giao dịch theo từng loại thanh toán. Từ CDF có thể thấy rõ ràng sự khác biệt trong phân bố số tiền giao dịch giữa các loại khác nhau. Hầu hết các giao dịch có số tiền dưới 0,1 USD trong các tài khoản EOA-EOA là loại P2P, điều này tiếp tục chứng minh rằng các giao dịch này có thể được thúc đẩy nhiều hơn bởi bot và các ví bị thao túng, hơn là được khởi xướng bởi các tổ chức được đánh dấu trong bộ dữ liệu của chúng tôi. Hơn nữa, CDF của các giao dịch P2P tiếp tục ủng hộ quan điểm rằng hầu hết các giao dịch có số tiền nhỏ, trong khi các giao dịch được đánh dấu là B2B và Nội bộ B, CDF của chúng cho thấy số tiền giao dịch cao hơn đáng kể. Cuối cùng, CDF của các giao dịch P2B và B2P nằm giữa P2P và B2B.
Hình 4:
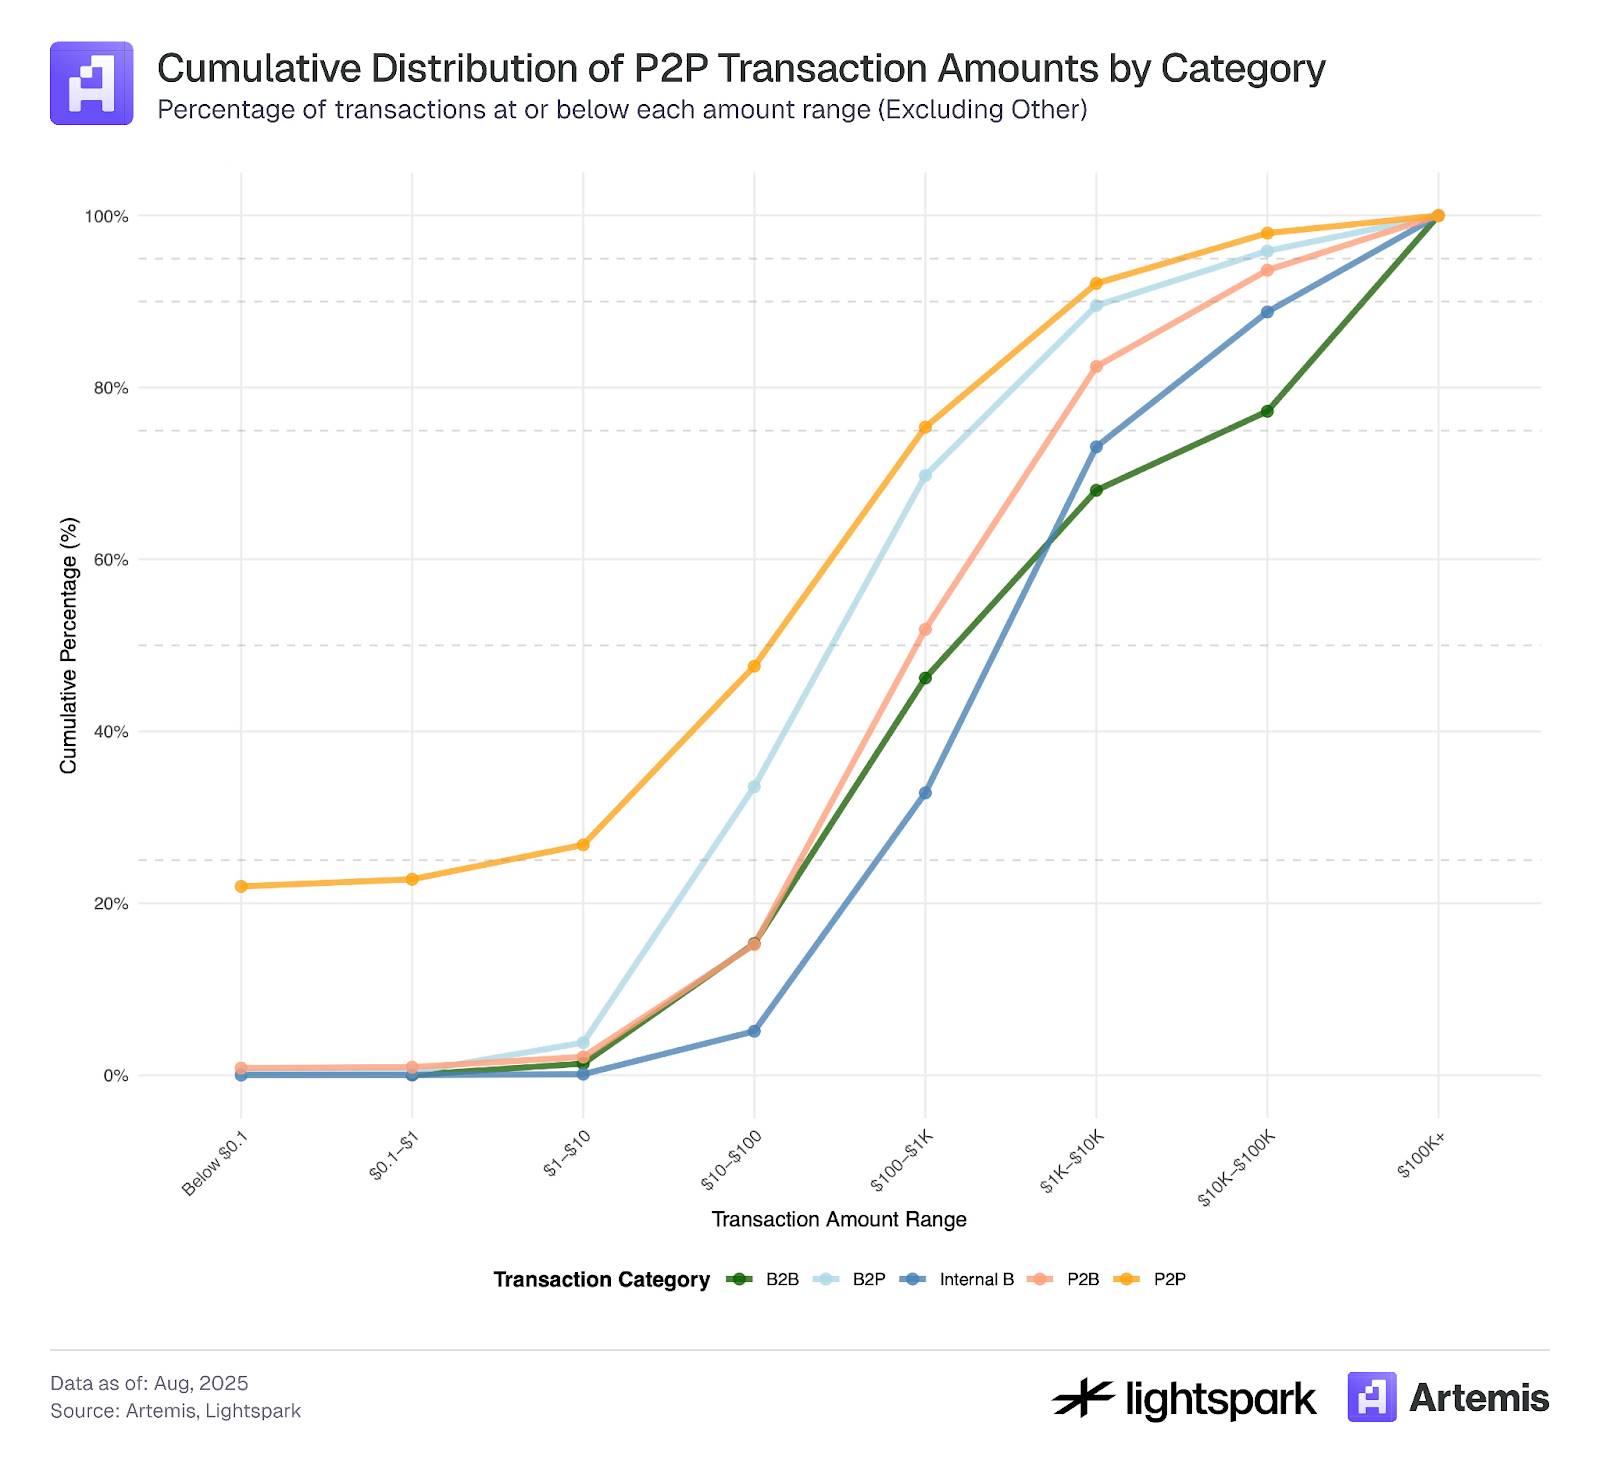
Dữ liệu mẫu cho phân tích này bao gồm hồ sơ giao dịch từ ngày 4 tháng 7 năm 2025 đến ngày 31 tháng 7 năm 2025.
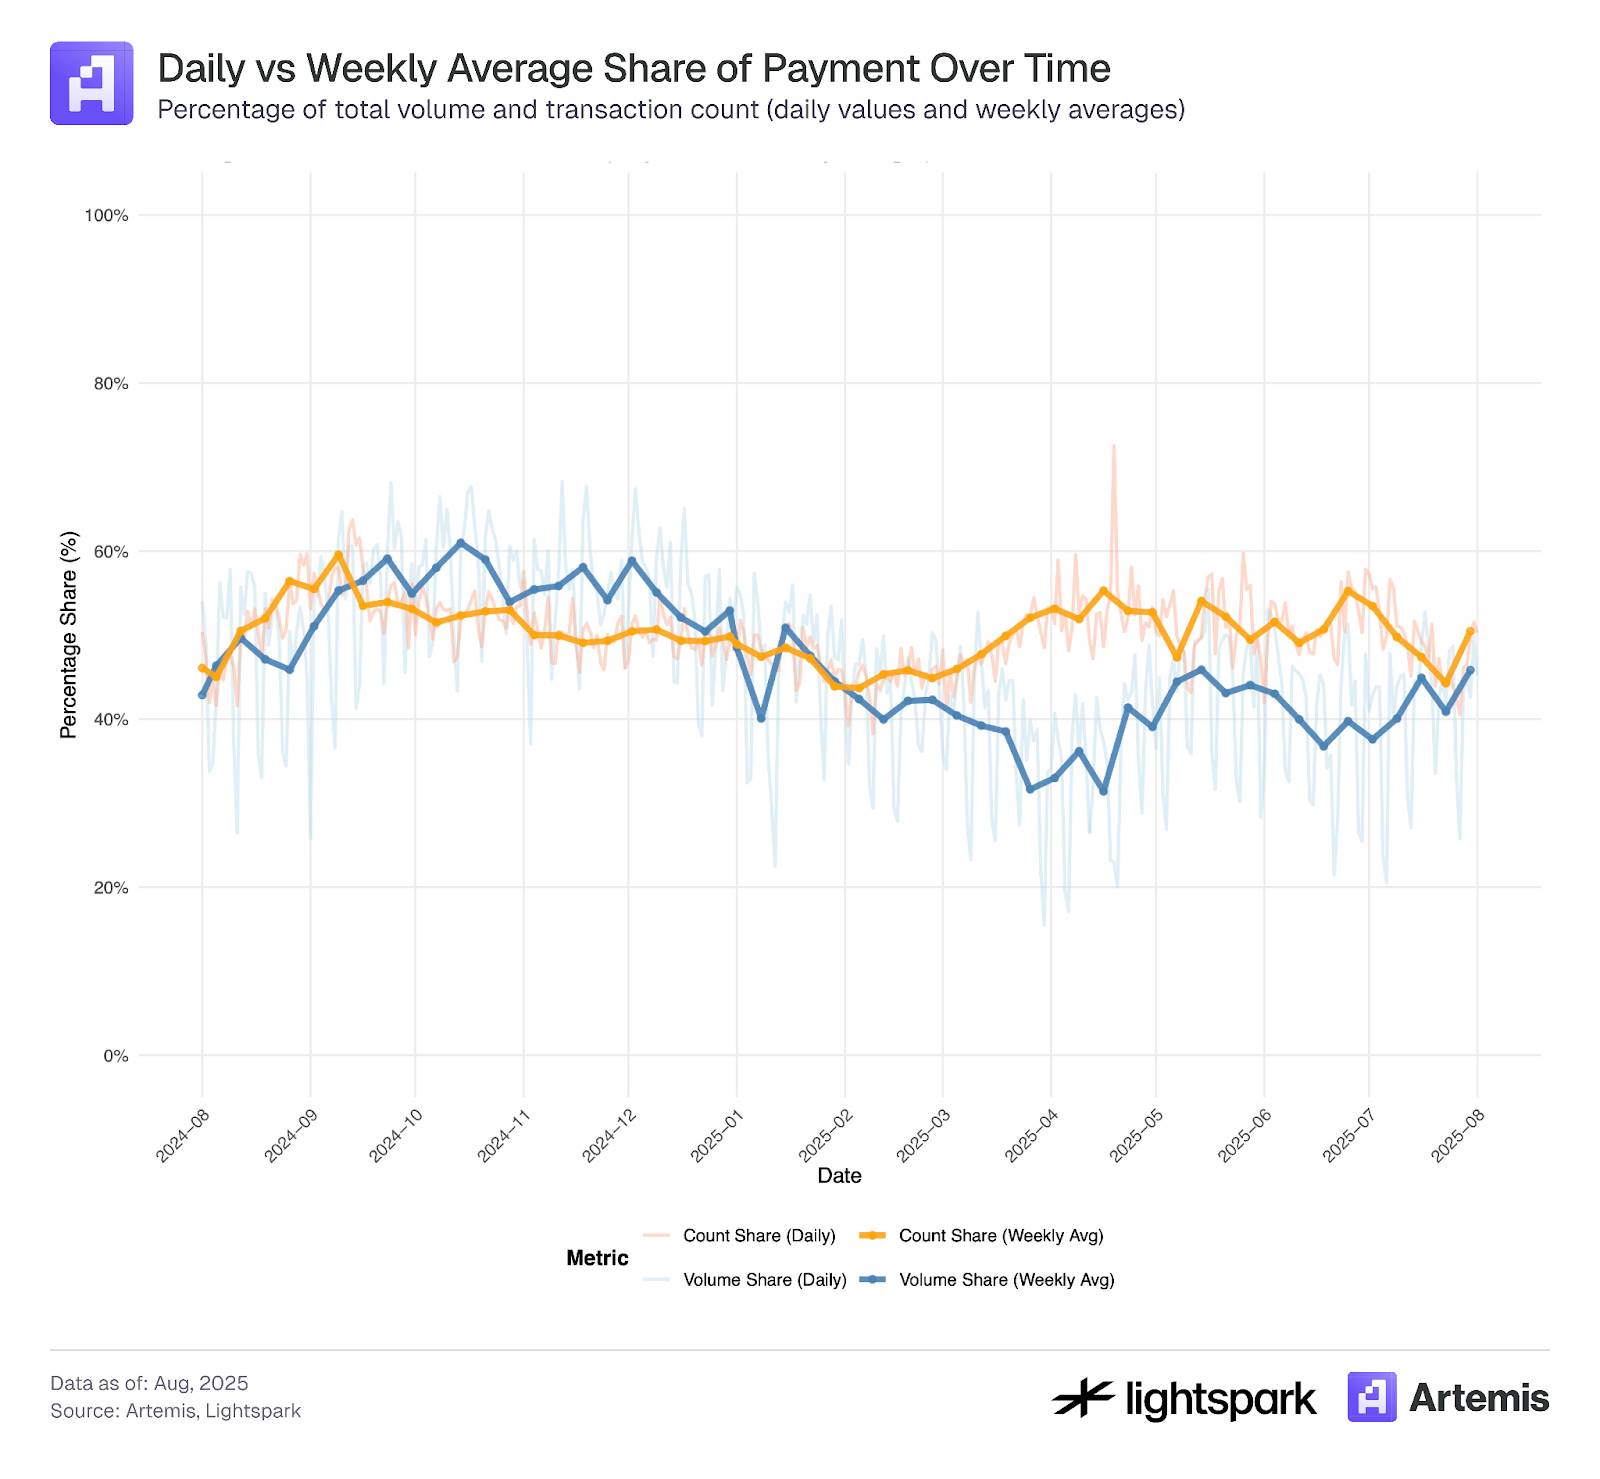
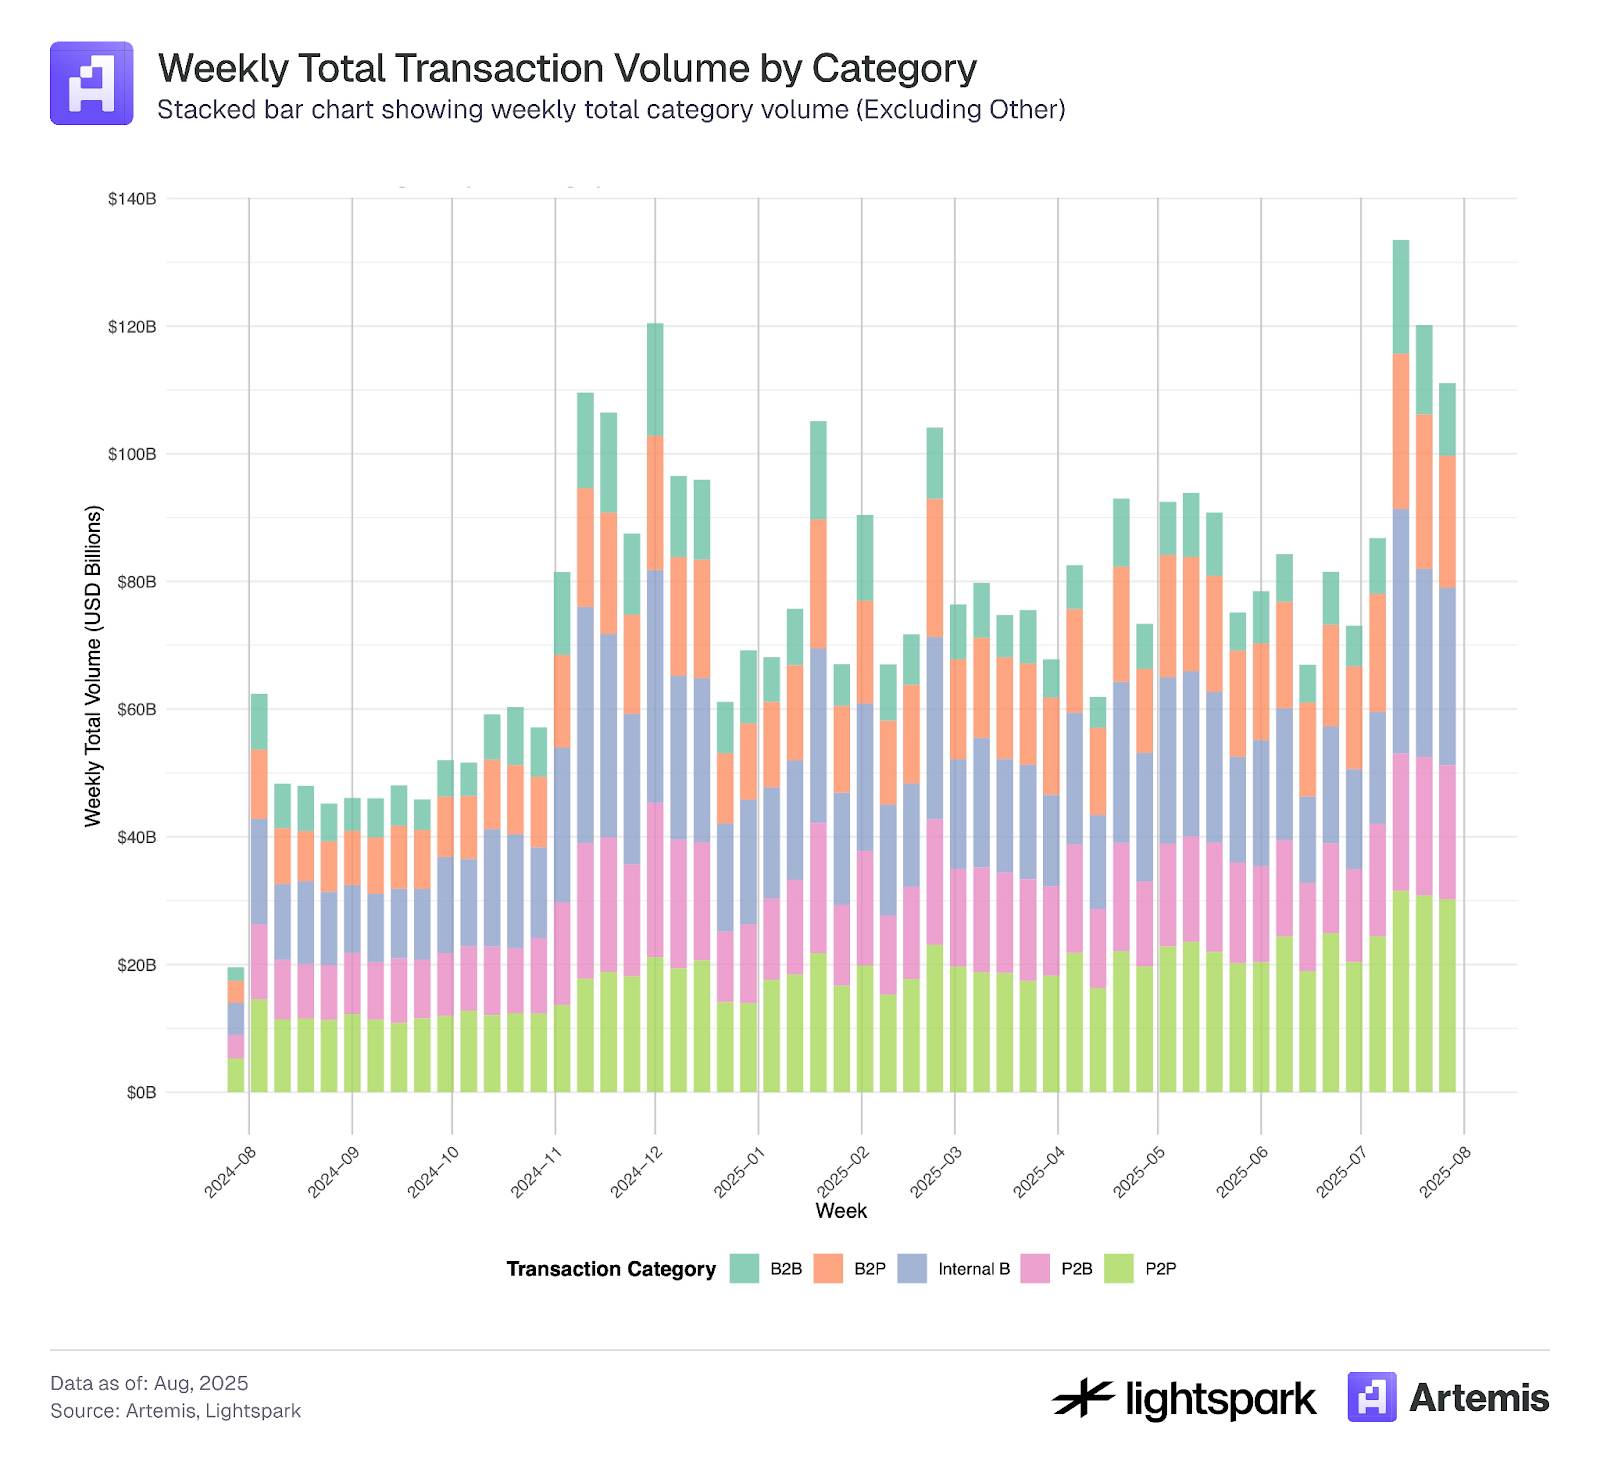
Hình 5 và Hình 6 thể hiện xu hướng thay đổi theo thời gian của từng loại thanh toán.
Hình 5 tập trung vào sự thay đổi theo tuần, cho thấy tất cả các loại thanh toán đều thể hiện xu hướng áp dụng nhất quán và sự tăng trưởng về khối lượng giao dịch hàng tuần. Bảng 4 tiếp tục tóm tắt những thay đổi tổng thể từ tháng 8 năm 2024 đến tháng 8 năm 2025.
Ngoài ra, Hình 6 cho thấy sự khác biệt về thanh toán giữa ngày trong tuần và cuối tuần, có thể thấy rõ ràng khối lượng giao dịch thanh toán giảm vào cuối tuần. Nhìn chung, việc sử dụng tất cả các loại thanh toán đều có xu hướng tăng theo thời gian, cả trong ngày làm việc và cuối tuần.
Hình 5:
Hình 6:
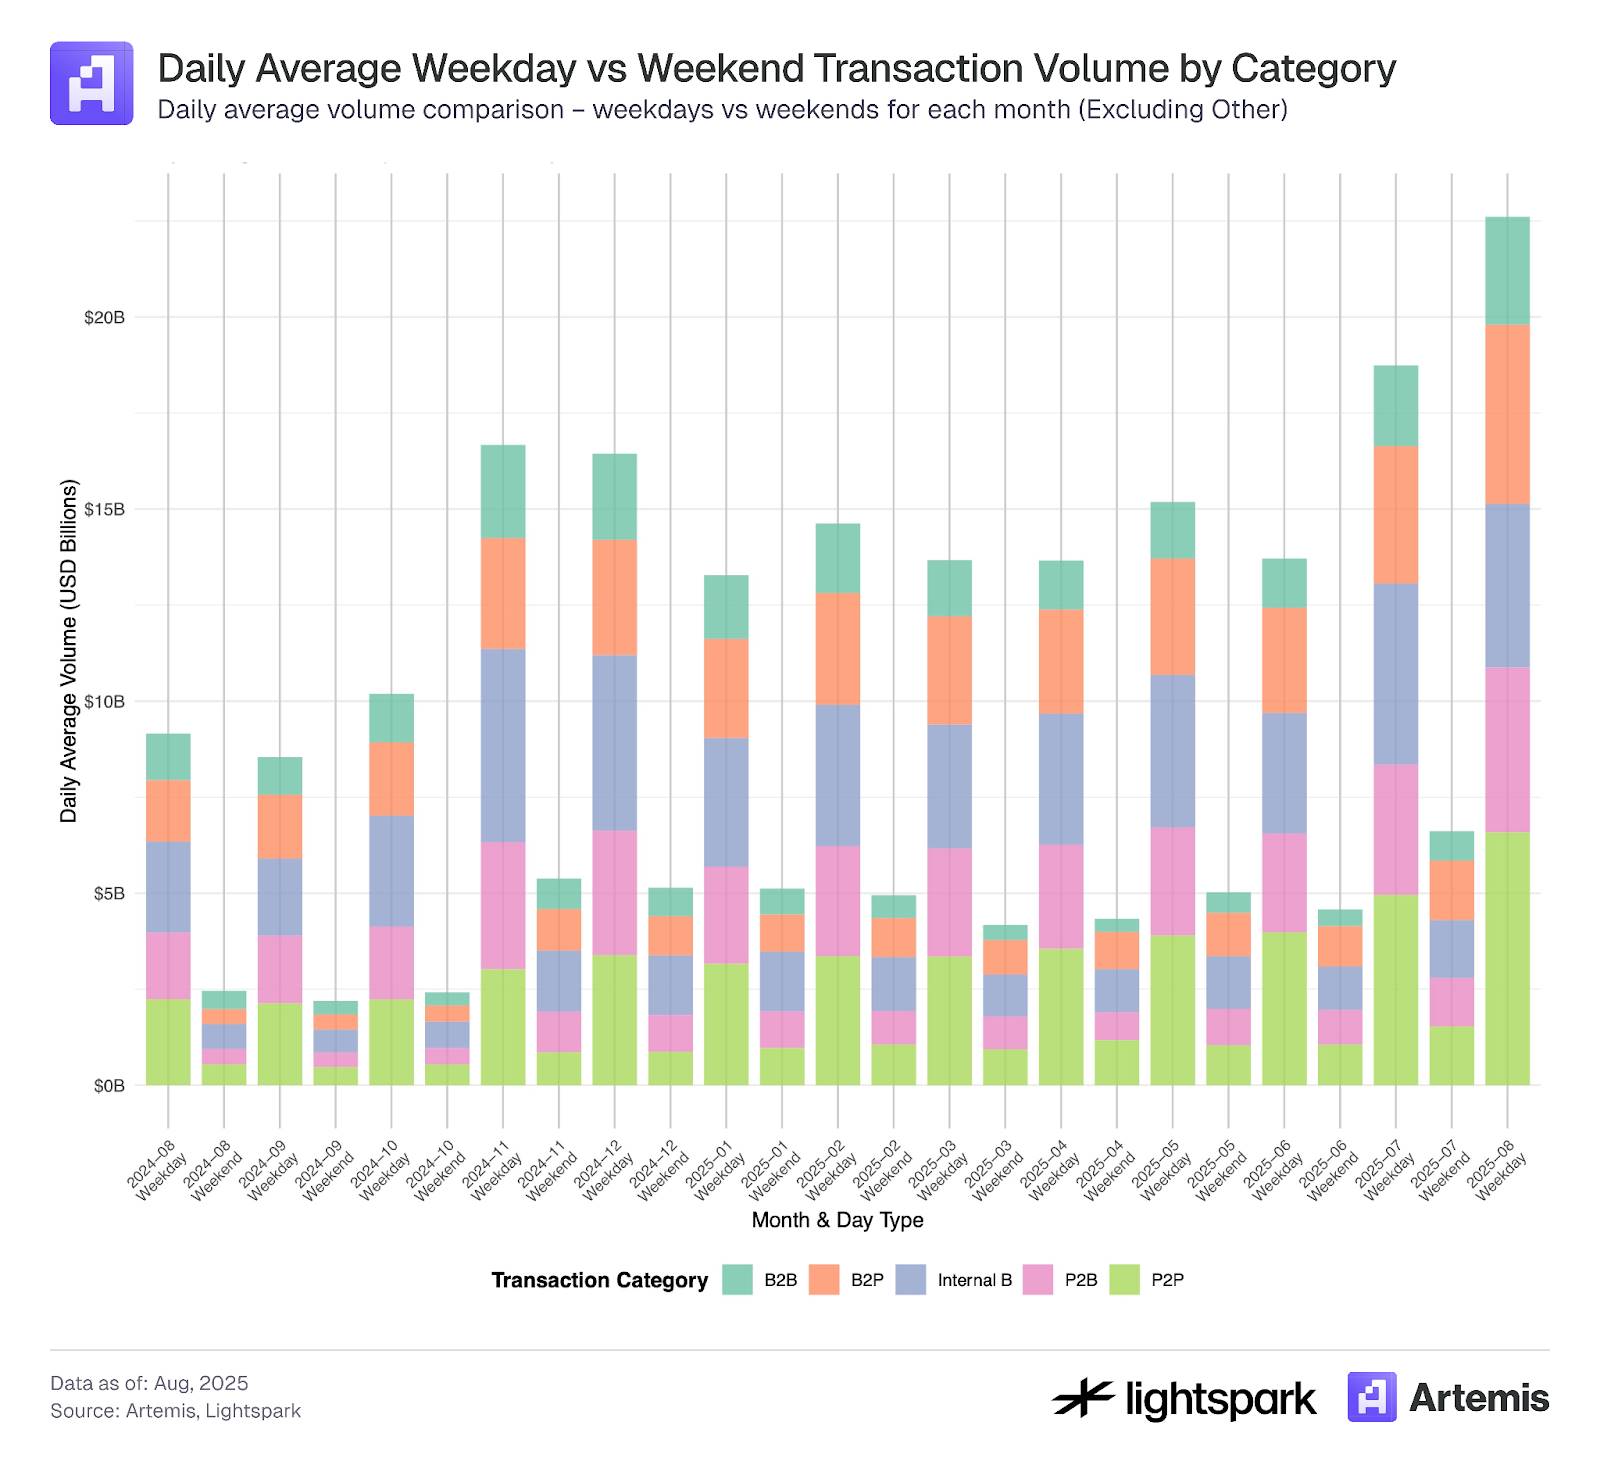
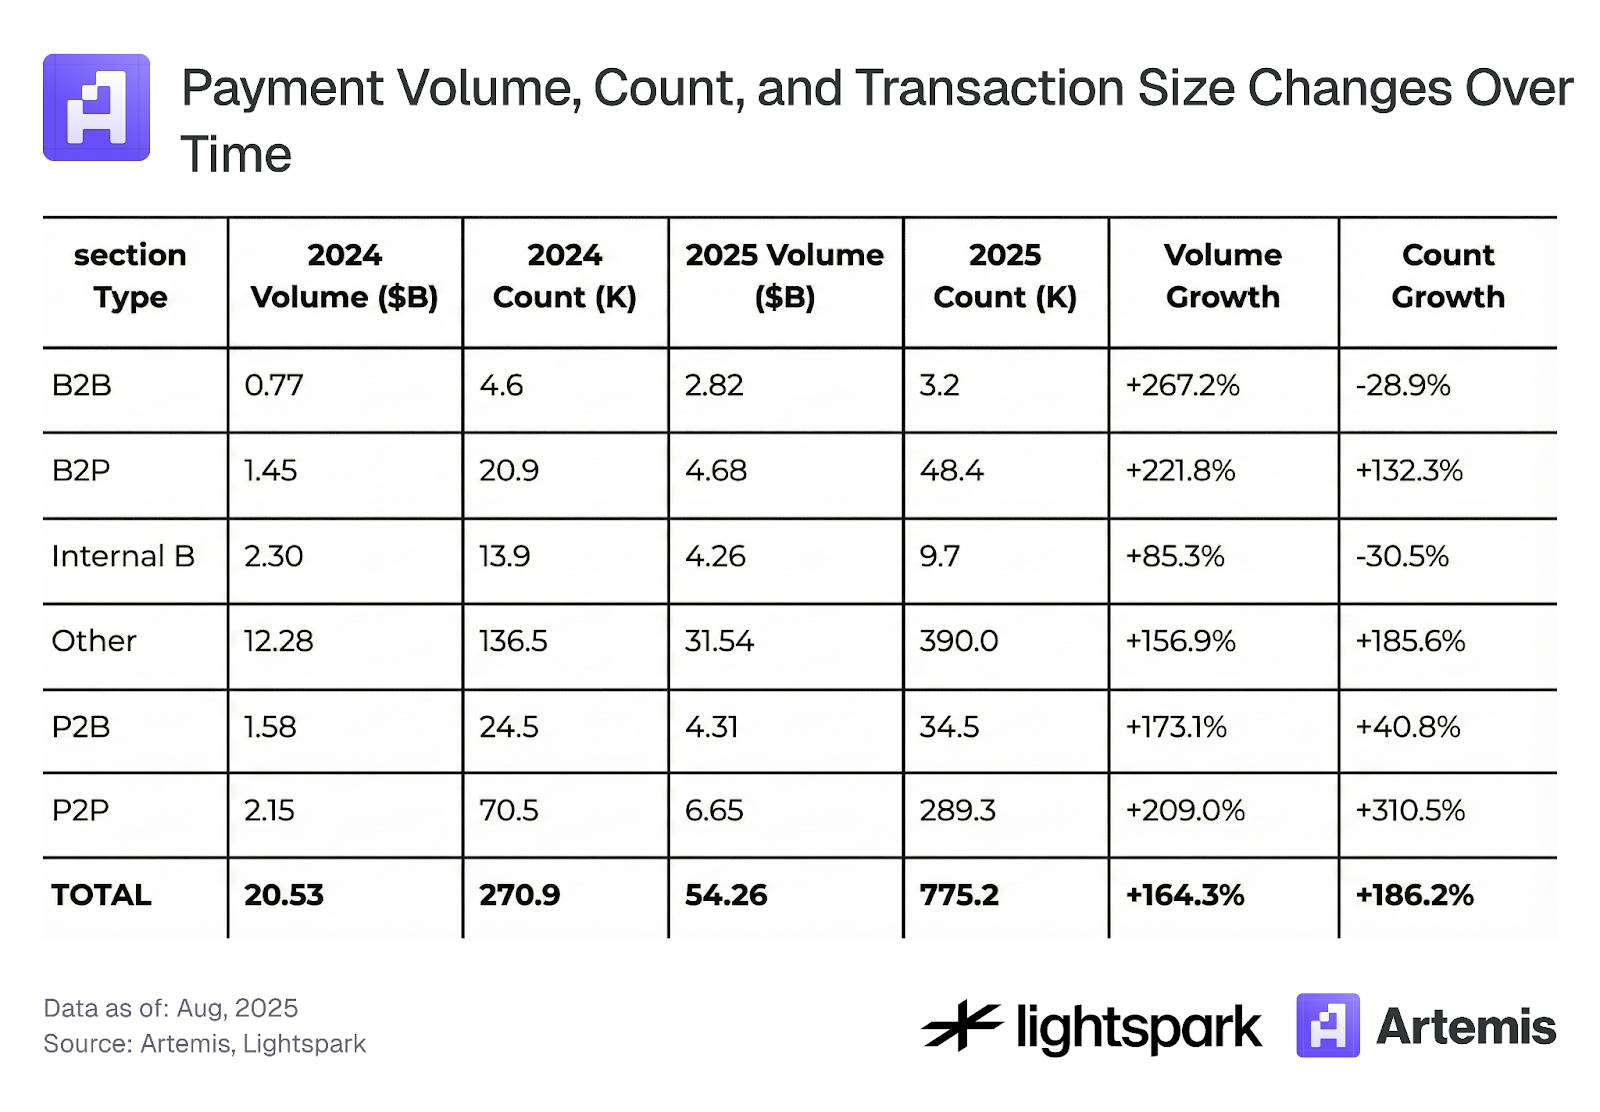
Bảng 4: Khối lượng giao dịch thanh toán, số lần giao dịch và số tiền giao dịch thay đổi theo thời gian
3.3 Mức độ tập trung của các giao dịch Stablecoin
Trong Hình 9, chúng tôi tính toán mức độ tập trung của các ví người gửi chính gửi stablecoin thông qua blockchain Ethereum. Rõ ràng, phần lớn khối lượng chuyển stablecoin tập trung vào một số ít ví. Trong khoảng thời gian lấy mẫu của chúng tôi, 1.000 ví hàng đầu đóng góp khoảng 84% khối lượng giao dịch.
Điều này chỉ ra rằng, mặc dù DeFi và blockchain nhằm mục đích hỗ trợ và thúc đẩy phi tập trung hóa, nhưng trong một số khía cạnh vẫn thể hiện đặc điểm tập trung hóa cao.
Hình 9:
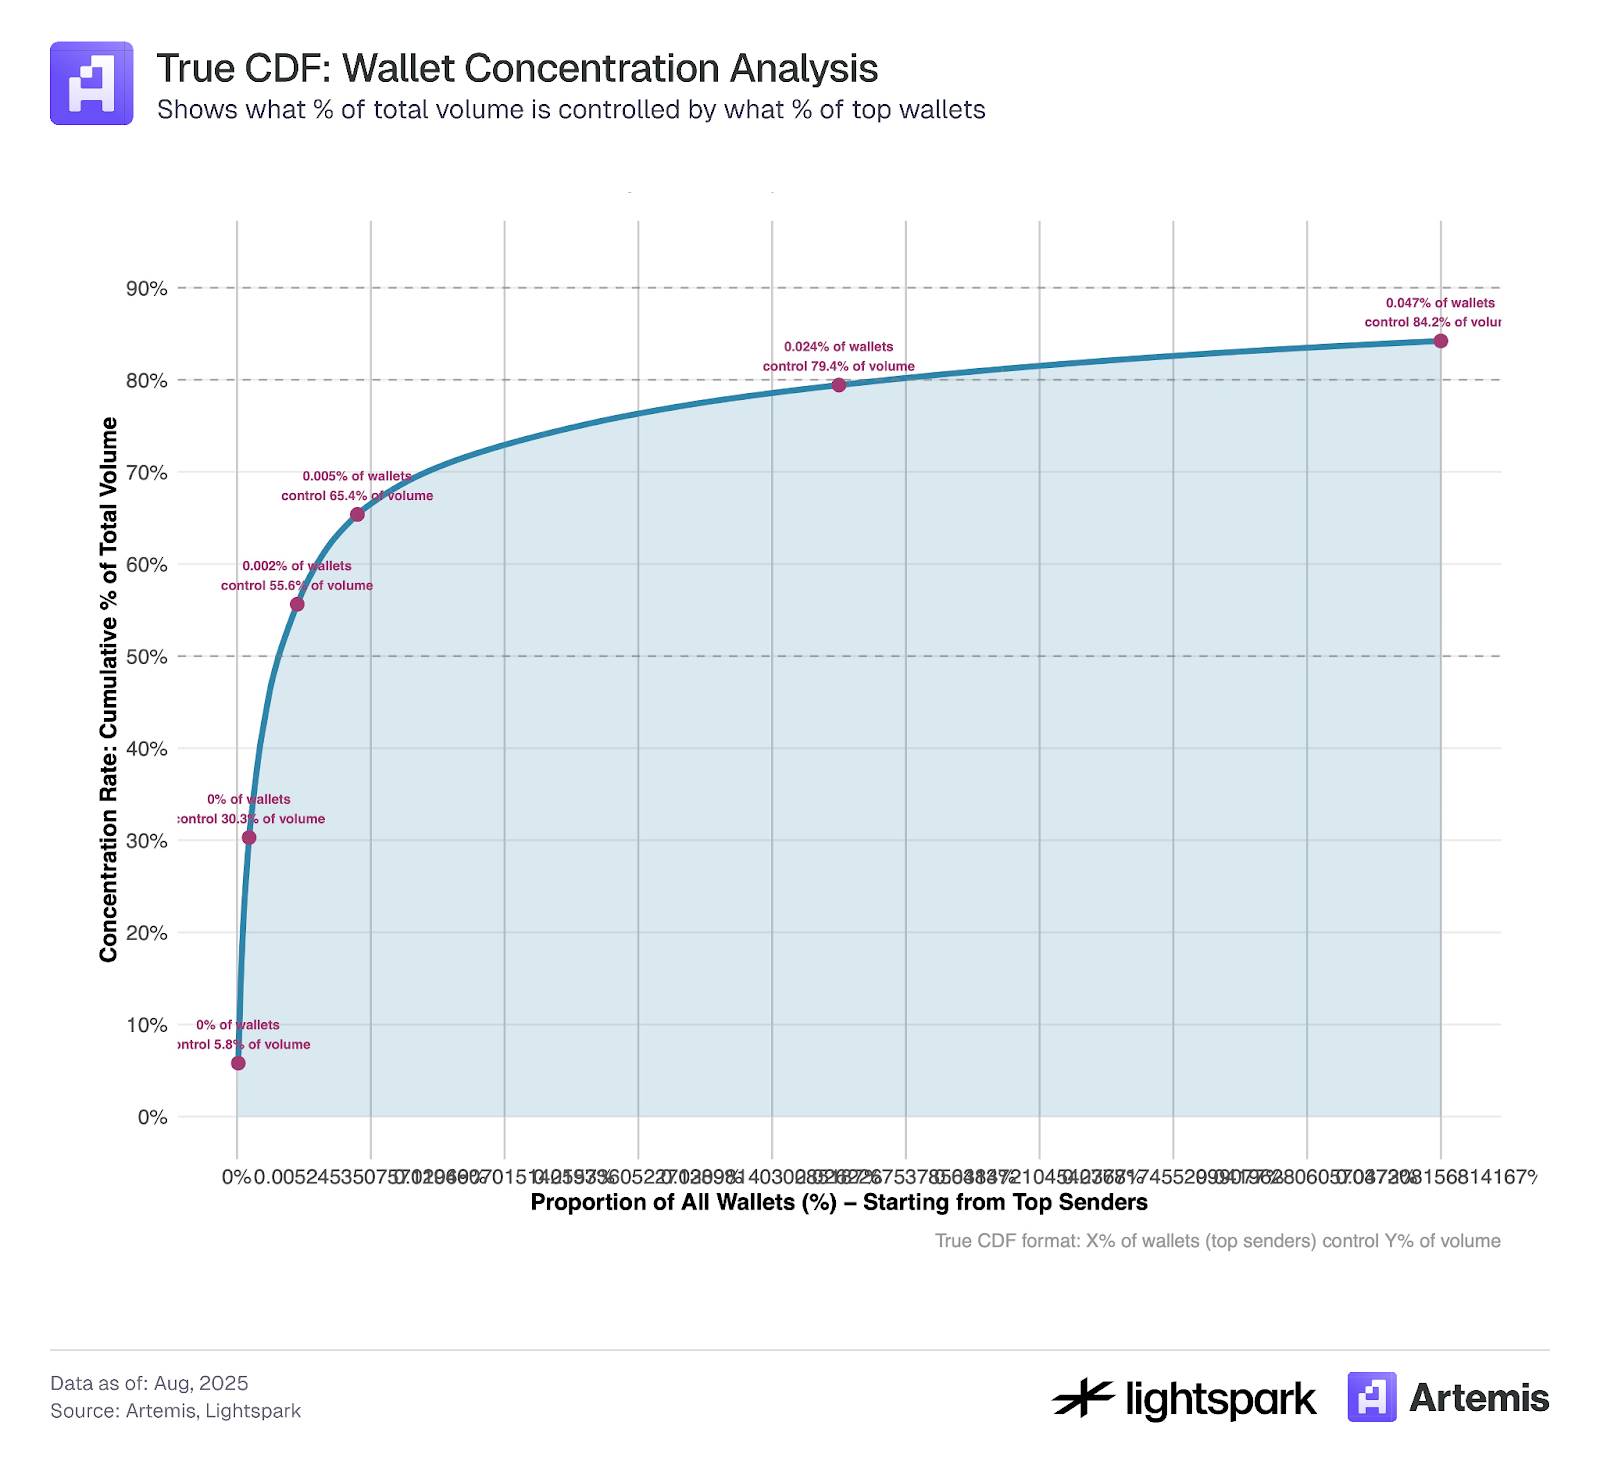
Dữ liệu mẫu được sử dụng cho phân tích này bao gồm hồ sơ giao dịch từ ngày 4 tháng 7 năm 2025 đến ngày 31 tháng 7 năm 2025.
4. Thảo luận
Rõ ràng, tỷ lệ chấp nhận stablecoin đang không ngừng được cải thiện theo thời gian, khối lượng giao dịch và số lần giao dịch của nó đã tăng hơn gấp đôi trong khoảng thời gian từ tháng 8 năm 2024 đến tháng 8 năm 2025. Ước tính việc sử dụng stablecoin trong thanh toán là một nhiệm vụ đầy thách thức, ngày càng có nhiều công cụ đang được phát triển để giúp cải thiện ước tính này. Nghiên cứu này sử dụng dữ liệu nhãn do Artemis cung cấp để khám phá và ước tính việc sử dụng stablecoin cho thanh toán được ghi lại trên blockchain (Ethereum).
Kết quả ước tính của chúng tôi chỉ ra rằng, thanh toán bằng stablecoin chiếm 47% tổng khối lượng giao dịch (hoặc 35% nếu không bao gồm các giao dịch Nội bộ B). Do các hạn chế về phân loại thanh toán của chúng tôi ít hơn (chủ yếu dựa trên chuyển khoản EOA-EOA), ước tính này có thể được coi là giới hạn trên. Tuy nhiên, các nhà nghiên cứu có thể áp dụng thêm các phương pháp lọc như giới hạn trên và dưới về số tiền giao dịch tùy theo mục tiêu nghiên cứu của họ. Ví dụ, thêm giới hạn số tiền tối thiểu là 0,1 USD có thể loại trừ các thao tác giao dịch số tiền thấp được đề cập trong Mục 3.1.
Trong Mục 3.2, bằng cách sử dụng thêm dữ liệu nhãn Artemis để phân chia các giao dịch thanh toán thành P2P, B2B, P2B, B2P và giao dịch Nội bộ B, chúng tôi nhận thấy thanh toán P2P chỉ chiếm 23,7% tổng khối lượng giao dịch thanh toán (tất cả dữ liệu thô) hoặc 11,3% (không bao gồm giao dịch Nội bộ B). Nghiên cứu trước đây chỉ ra rằng thanh toán P2P chiếm khoảng 25% thanh toán bằng stablecoin, kết quả của chúng tôi gần với con số đó.
Cuối cùng, trong Mục 3.3, chúng tôi quan sát thấy, xét về khối lượng giao dịch, hầu hết các giao dịch stablecoin tập trung vào 1.000 ví hàng đầu. Điều này đặt ra một câu hỏi thú vị: việc sử dụng stablecoin đang phát triển như một công cụ thanh toán được thúc đẩy bởi các trung gian và các công ty lớn, hay như một công cụ thanh toán bù trừ cho giao dịch P2P? Thời gian sẽ trả lời.
Tài liệu tham khảo
-
Yaish, A., Chemaya, N., Cong, L. W., & Malkhi, D. (2025). Inequality in the Age of Pseudonymity. arXiv preprint arXiv:2508.04668.
-
Awrey, D., Jackson, H. E., & Massad, T. G. (2025). Stable Foundations: Towards a Robust and Bipartisan Approach to Stablecoin Legislation. Available at SSRN 5197044.
-
Halaburda, H., Livshits, B., & Yaish, A. (2025). Platform building with fake consumers: On double dippers and airdrop farmers. NYU Stern School of Business Research Paper Forthcoming.
-
Cong, L. W., Li, X., Tang, K., & Yang, Y. (2023). Crypto wash trading. Management Science, 69(11), 6427-6454.
Thông tin thêm tại:
https://www.stablecoin.fyi/#stablecoin-payments-by-type