AVAX’s short-term relief rally is a hidden sell signal – Here’s why

ambcryptoPublished on 2026-06-27Last updated on 2026-06-27

Abstract

Avalanche (AVAX) has seen a 5.95% price rally in the past 24 hours, standing out among major cryptocurrencies. However, analysis suggests this short-term relief may be a hidden sell signal. Key concerns include a nearly 8% drop in daily trading volume and only a modest 3.3% increase in Open Interest, indicating weak spot buying and speculative interest. Technically, AVAX broke a key support level from February, reaching a low of $5.68 in early June. The current bounce is approaching the 23.6% Fibonacci retracement level at $6.83, a local resistance zone. The overall structure on higher timeframes remains bearish. The article advises traders to wait, as the current bounce lacks conviction and presents a poor risk-to-reward ratio. Swing traders are recommended to watch for a larger potential bounce toward resistance levels at $8.11, $8.69, or $9.51 to consider selling. The $6.8-$7.0 area is identified as a local supply zone and a potential sell area, though sellers should be prepared to cut losses if the price moves higher than expected. The conclusion is that AVAX's short-term strength appears fragile and may not last.

Avalanche [AVAX] has rallied by 5.95% in the past 24 hours. It was one of the few tokens in the top 50 crypto assets by market capitalization that have made noticeable gains in recent trading sessions.

However, the altcoin’s daily trading volume was down by nearly 8%. This was a sign that Spot buying was not as strong as the bulls would want it to be. The fragile bounce was accompanied by only a 3.3% increase in Open Interest.

Speculative traders’ reluctance to chase the move was another indication of AVAX’s fragility. Here’s a deeper dive into the token’s long-term price trends.

AVAX bounces from oversold conditions made earlier in June
Source: AVAX/USDT on TradingView

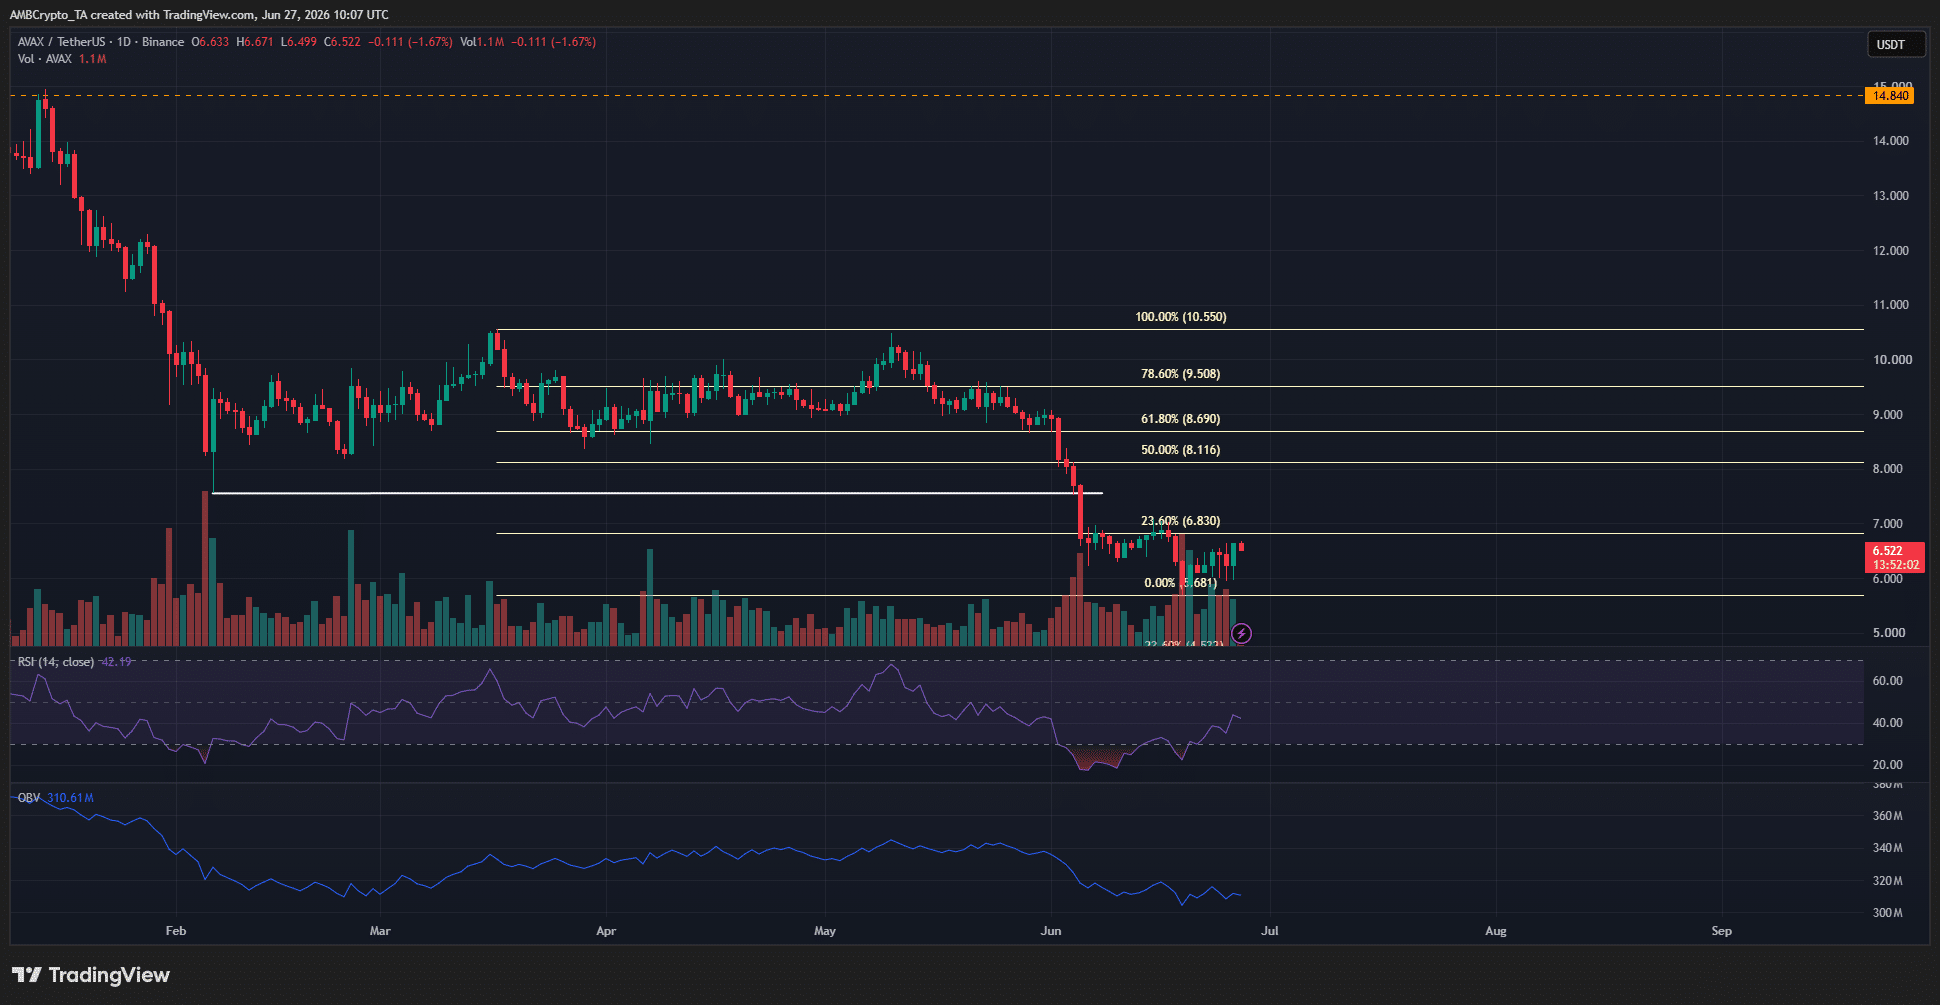
In February, AVAX set a swing low at $7.55, which it breached in the first week of June. This bearish structural break originated at the $10.55 high made in March, and the move reached a low of $5.68.

Hence, these two levels were used as the anchor points for a set of Fibonacci retracement levels. At the time of writing, AVAX was approaching $6.83, the 23.6% retracement level.

The $6.8 area has served as a local resistance zone over the past three weeks. Until it is surpassed, short-term bulls will want to stay away from entering long positions.

Swing traders will want to wait for a much bigger bounce to sell into. Key retracement levels at $8.11, $8.69, and $9.51 will be the targets to watch out for.

Traders’ call to action – Wait
Source: AVAX/USDT on TradingView

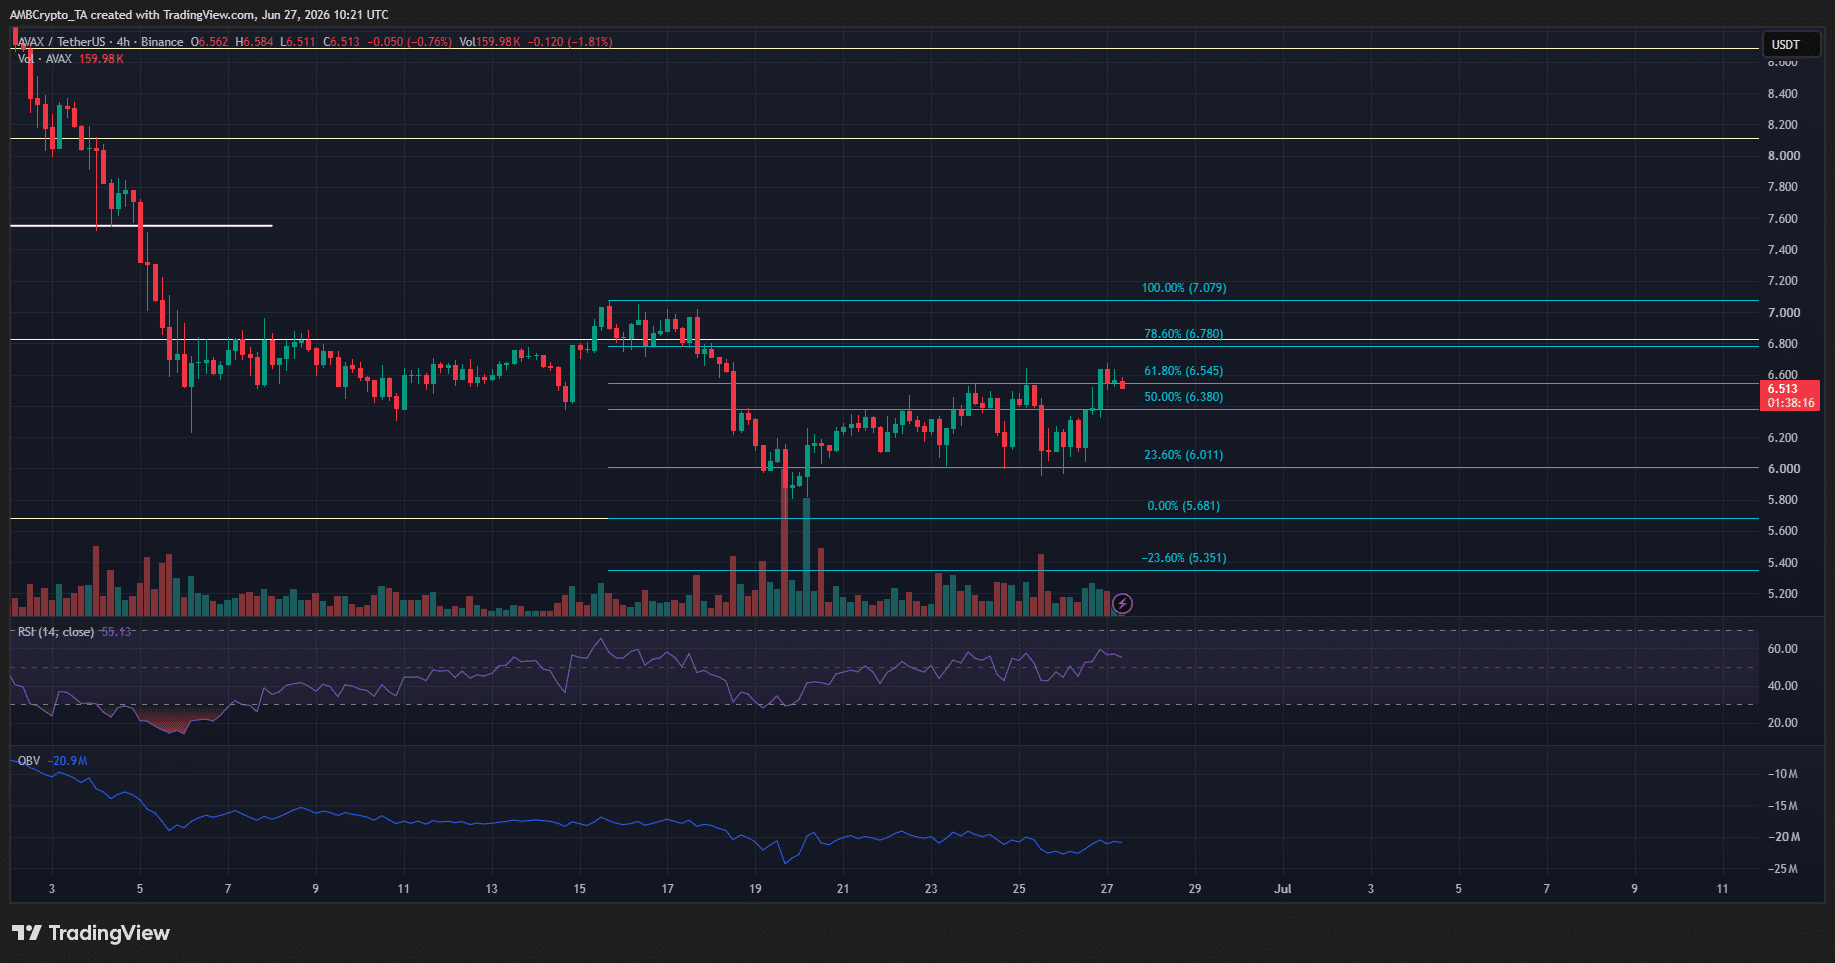
The 4-hour structure was firmly bearish, and AVAX’s bounce has strayed into the golden pocket between the 61.8% and 78.6% retracement levels plotted based on this timeframe’s swing move.

It was a clear sell signal. Additionally, the $6.8-$7.0 area has been a local supply zone. At the same time, traders should remember that Avalanche token prices could bounce toward $8 before the next higher timeframe bearish move.

Sellers at the $6.8 area should be ready to cut their losses in case the bounce goes higher than expected.


Final Summary

  • The relative bullish strength of Avalanche in the short term might not last much longer, given the weak volume and price structure.
  • Swing traders can wait for a bigger bounce before entering positions with conviction. Presently, the risk-to-reward was too little to take action.


Trending Cryptos

Related Questions

QWhat is the main argument presented in the title regarding AVAX's recent price movement?

AThe title argues that AVAX's short-term relief rally is a hidden sell signal, suggesting the bounce is not a strong bullish reversal but rather an opportunity to sell.

QWhat two market indicators are cited as signs of weakness behind AVAX's price rally?

AThe two indicators are a nearly 8% decrease in daily trading volume, suggesting weak spot buying, and only a 3.3% increase in Open Interest, indicating speculative traders' reluctance to chase the move.

QAccording to the Fibonacci analysis, what key retracement level is AVAX approaching, and what is its significance?

AAVAX is approaching the 23.6% Fibonacci retracement level at $6.83. This area has served as a local resistance zone for the past three weeks, and surpassing it is a key hurdle for short-term bulls.

QWhat specific price area on the 4-hour chart does the article identify as a clear sell signal?

AThe article identifies the golden pocket between the 61.8% and 78.6% Fibonacci retracement levels on the 4-hour chart as a clear sell signal, coinciding with the local supply zone of $6.8-$7.0.

QWhat is the overall recommended action for traders based on the article's conclusion?

AThe overall recommended action is to wait. The article advises swing traders to wait for a bigger bounce (towards key levels like $8.11) before selling with conviction, as the current risk-to-reward ratio is unfavorable.

Related Reads

Bitcoin Boom in Full Swing: Saylor's Latest Statement Fuels Buying Speculation

MicroStrategy's Executive Chairman Michael Saylor has fueled speculation about a new Bitcoin purchase by posting "Bitcoin Drive engaged" on August 2, accompanied by the company's customary purchase tracker. This aligns with his pattern of hinting at treasury changes ahead of weekly reports. The accompanying report showed MicroStrategy's Bitcoin holdings at 843,775 BTC, with an average cost of $75,653 per coin and an unrealized loss of -$10.58B. A similar signal preceded the company's July 27 announcement, strengthening expectations for a treasury update on Monday. However, MicroStrategy's real-time ledger reflects two recent Bitcoin sales totaling 3,588 BTC, reducing holdings from 847,363 BTC to the current 843,775 BTC. The company stated these sales funded preferred stock dividends and replenished its U.S. dollar reserve. Recent reports indicate the company made no Bitcoin purchases the week ending July 26 while increasing its dollar reserve to approximately $3.75B. The company faces financial headwinds after reporting an $8.33B operating loss for Q2 2026, including an $8.32B unrealized loss on its digital assets. Management may sell up to $1.25B more in Bitcoin to meet cash obligations. The expected Monday update will reveal if the "Bitcoin Drive" signal marks a return to accumulation as MicroStrategy balances its massive Bitcoin stash against growing cash commitments.

cryptonews.ru2h ago

Bitcoin Boom in Full Swing: Saylor's Latest Statement Fuels Buying Speculation

cryptonews.ru2h ago

Trading

Spot

Hot Articles

Discussions

Welcome to the HTX Community. Here, you can stay informed about the latest platform developments and gain access to professional market insights. Users' opinions on the price of S (S) are presented below.

活动图片