The Gold Buy-on-the-Dip Guide: Watch Interest Rates, Not Just War

marsbitDipublikasikan tanggal 2026-06-12Terakhir diperbarui pada 2026-06-12

Abstrak

"Gold Buying Guide: Focus on Interest Rates, Not Just War" Four months ago, gold buyers likely didn't anticipate buying at a peak that even a war couldn't sustain. After hitting a record high of $5,596 on January 29, gold entered a bear market just 91 days later, its fastest decline since 2008. A key trigger was the Fed's hawkish shift, highlighting that monetary policy, not geopolitics, is the primary driver. The article argues that the traditional "buy gold in turmoil" script has changed. While the US-Iran conflict initially boosted prices, the sustained rally in oil prices heightened inflation fears, forcing central banks to maintain or consider tighter policy. Since gold yields no interest, higher rates increase its opportunity cost, eroding its appeal. This dynamic was evident when gold fell sharply on May 18 despite positive peace talks, as lower oil prices eased inflation and thus rate hike pressures. The recent sell-off is also part of a broader market deleveraging. Correlations between gold, Nasdaq, and Bitcoin spiked as leveraged investors sold liquid assets to cover losses, creating a synchronized downturn. Historically, gold bottoms align with policy shifts, not conflict resolutions. The 2008 and 2022 bear markets ended with shifts to extreme easing and peak inflation expectations, respectively. For potential buyers, the author suggests monitoring three signals: 1) Peak interest rate hike expectations, 2) Reopening of the Strait of Hormuz (to ease oil/inflati...

Author: David, Chaoxiang Research

People rushing to buy gold four months ago probably didn't expect to buy at a peak that even a war couldn't rescue.

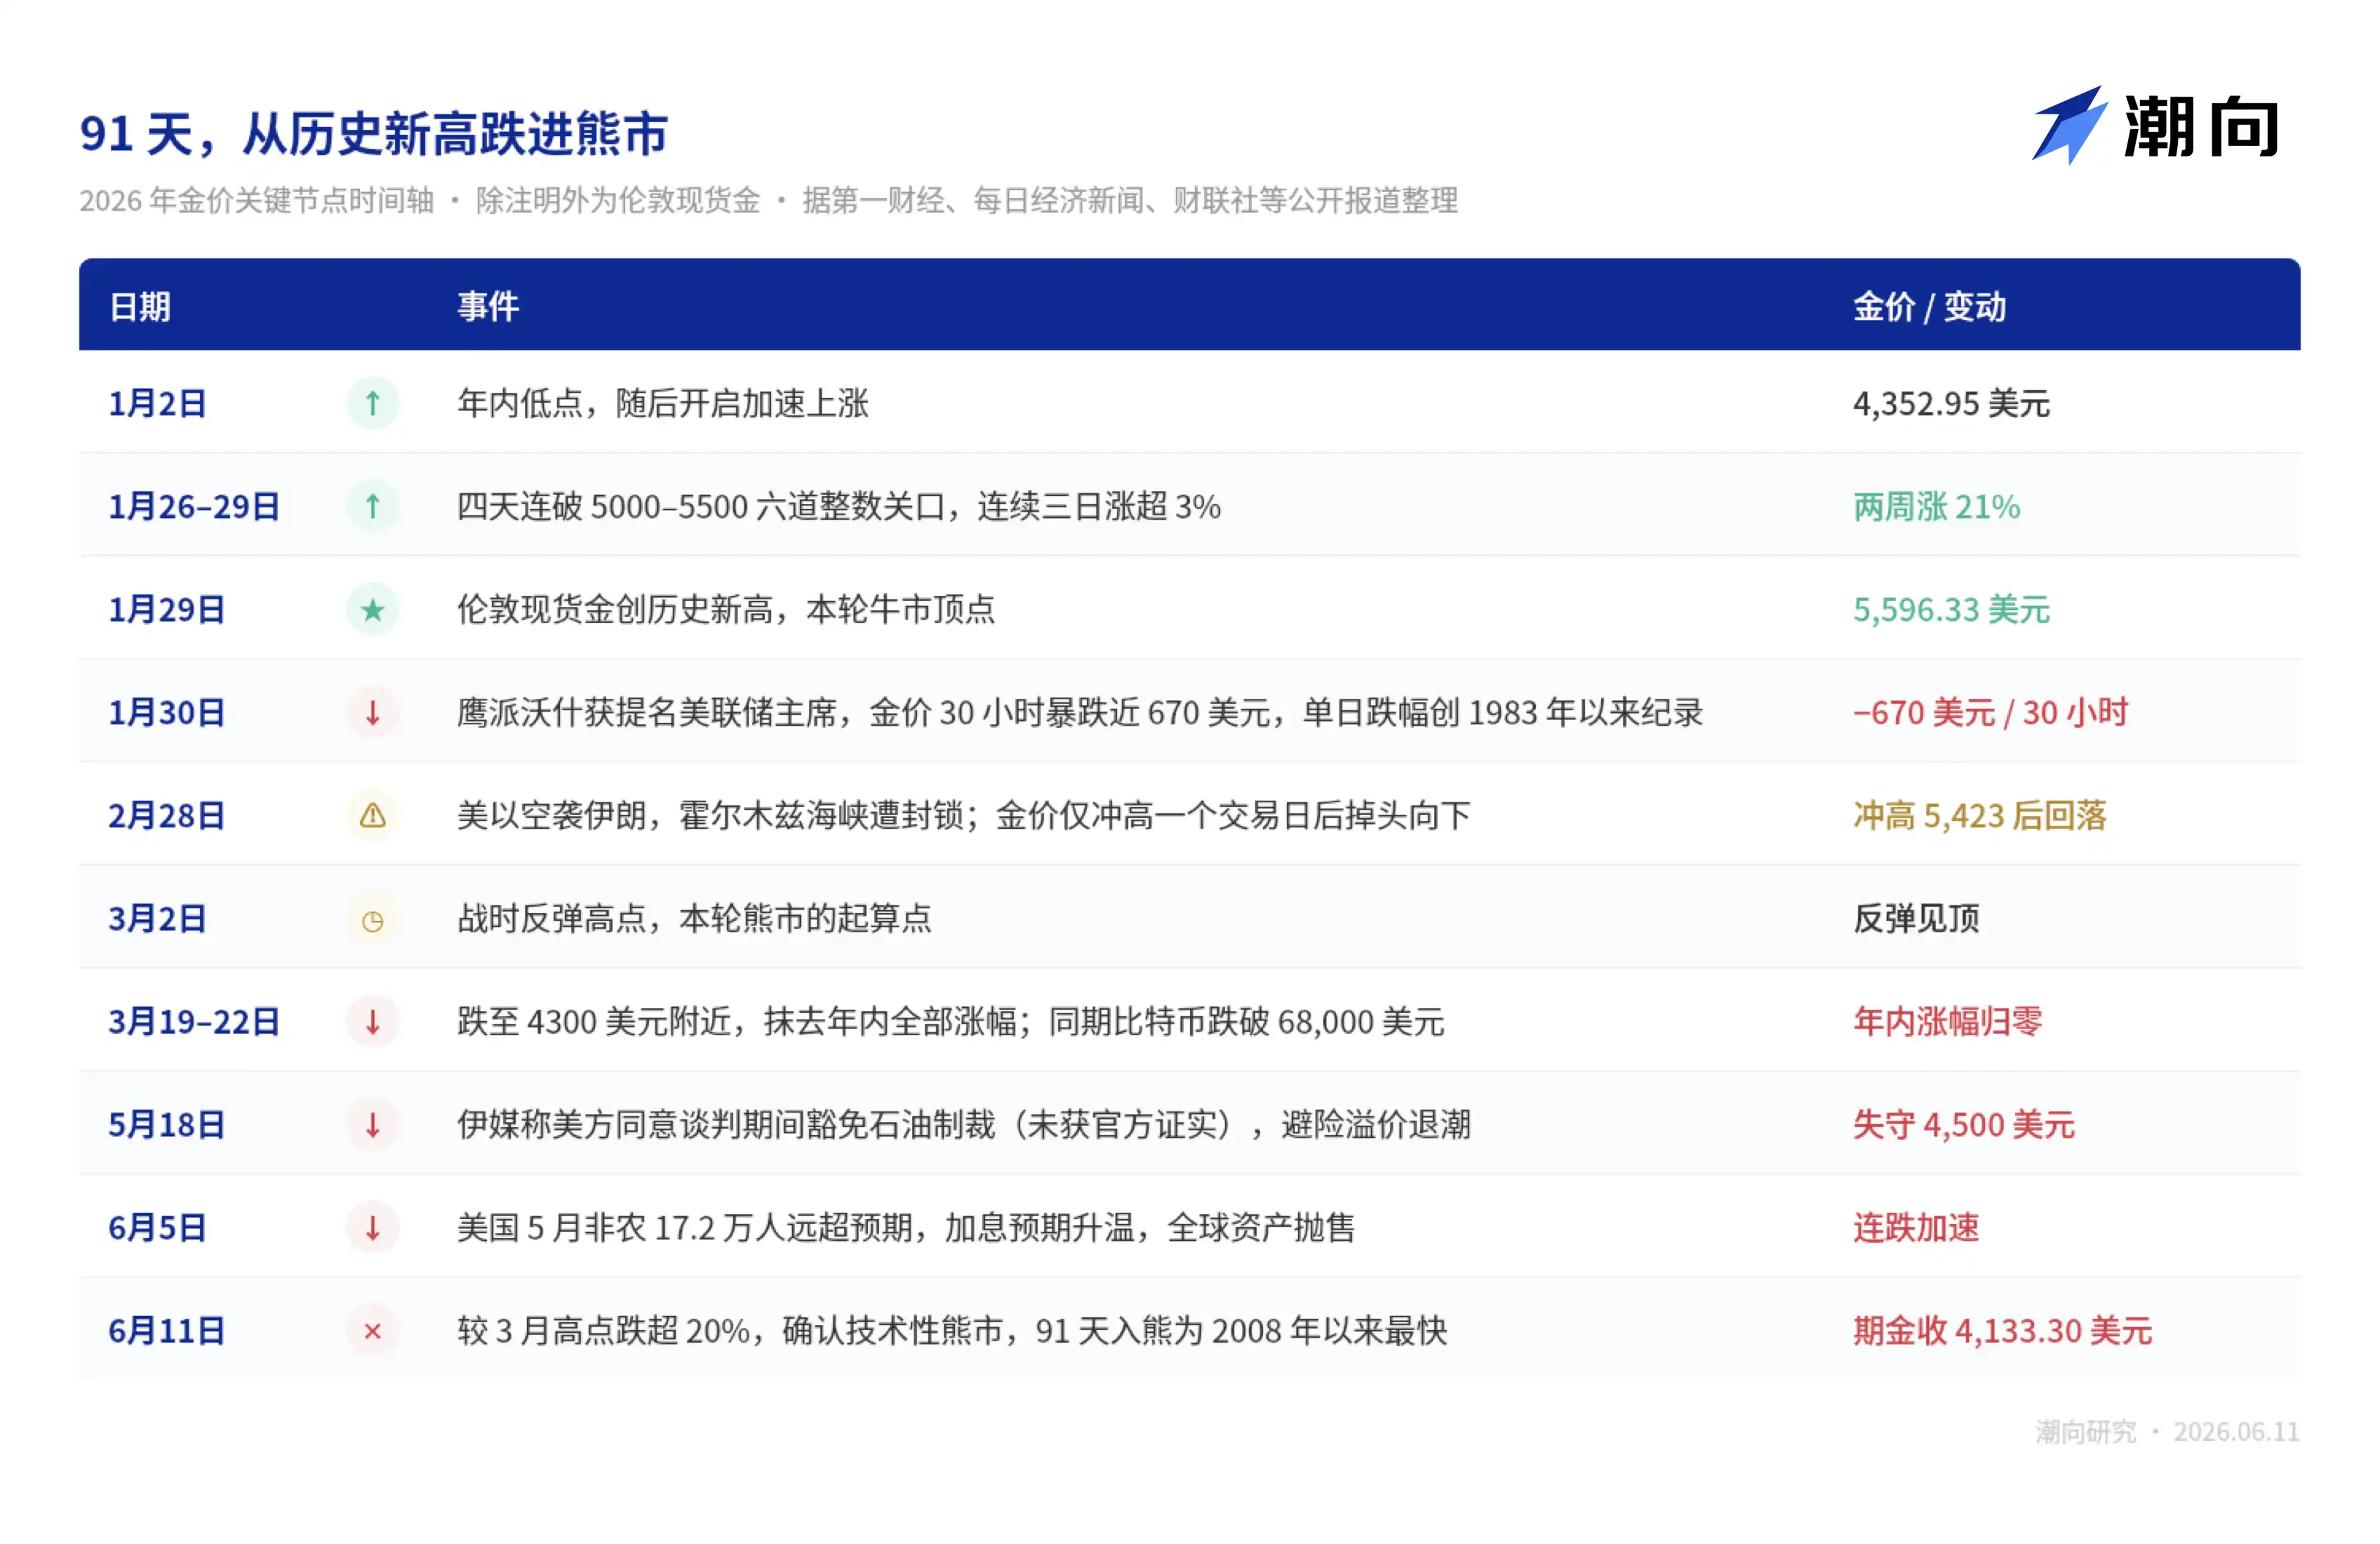
In the last week of January this year, gold was in the craziest phase of this bull run. From January 26th to 29th, spot gold broke through six round-number levels from 5000 to 5500 in four consecutive days, posting gains over 3% for three trading days in a row, which is extremely rare in gold trading history.

On January 29th, London spot gold touched $5,596.33, a historic high.

The peak came the next day. On January 30th, Trump nominated Kevin Warsh, with a hawkish background, as the next Fed Chairman. Gold prices plunged nearly $670 within 30 hours, setting a record for the largest single-day drop since 1983, while silver fell as much as 36% intraday.

Note the timing: this was a full month before the US-Iran war started.

The first hand pushing gold off the peak was monetary policy, a scenario that repeated in the following four months. The subsequent plot is familiar to everyone: war, blockade, rebound, slow decline... By June 11th, New York August gold futures settled at $4,133.30, down over 20% from the March high, officially confirming a technical bear market, entering bear territory just 91 days after the peak, the fastest such decline since 2008.
These days, opening investment chat groups reveals retail investors asking almost the same question: "The war is so intense, why is gold falling instead of rising?"

The author believes the question is reversed. The more pertinent question should be: why did the market rush to buy gold following the old script on the first day of the war, but a hundred days later, the same war became a reason to sell gold?

In the Grudge Match Between Gold and Interest Rates, War is Just the Messenger

Buy gold in turbulent times—the market initially followed this script.

On February 28th, the day the US and Israel launched airstrikes on Iran, spot gold surged from $5,296 to $5,423. However, this rally lasted only one trading day. The war didn't end quickly, the conflict stalemated, and the pricing chain for gold shifted accordingly.

The author believes the new chain works like this:

The Strait of Hormuz blockade kept oil and gas prices high. Rising energy costs pushed inflation expectations higher. Inflation forces central banks to tighten policy again. And since gold yields no interest, the higher interest rates go, the greater the opportunity cost of holding it.

Naeem Aslam, Chief Investment Officer at London-based independent financial research and investment consultancy Zaye Capital Markets, believes geopolitical tensions supporting oil prices mean high inflation is more persistent, making it difficult for the Fed to cut rates, with funds continuing to favor US Treasuries.

Whether this analysis holds water can be seen from the following data points.

First, the CME FedWatch Tool shows a 98.2% probability of no change at next week's FOMC meeting, with traders betting the next move is a December rate hike;

Second, before the war, the market expected the Fed to turn dovish later this year. The ECB is acting faster, with a 25 basis point hike on Thursday almost a market consensus, according to Refinitiv data.

Before the war, everyone was waiting for rate cuts; after the war, they're waiting for hikes. Thus, the foundation for gold bulls has been completely pulled out over these four months.

The counterexample in May best illustrates the point. On May 18th, Iranian media reported that the US agreed to exempt oil sanctions during negotiations, and crude oil fell accordingly. Following the safe-haven logic, with rising peace expectations, gold would at most decline slightly.
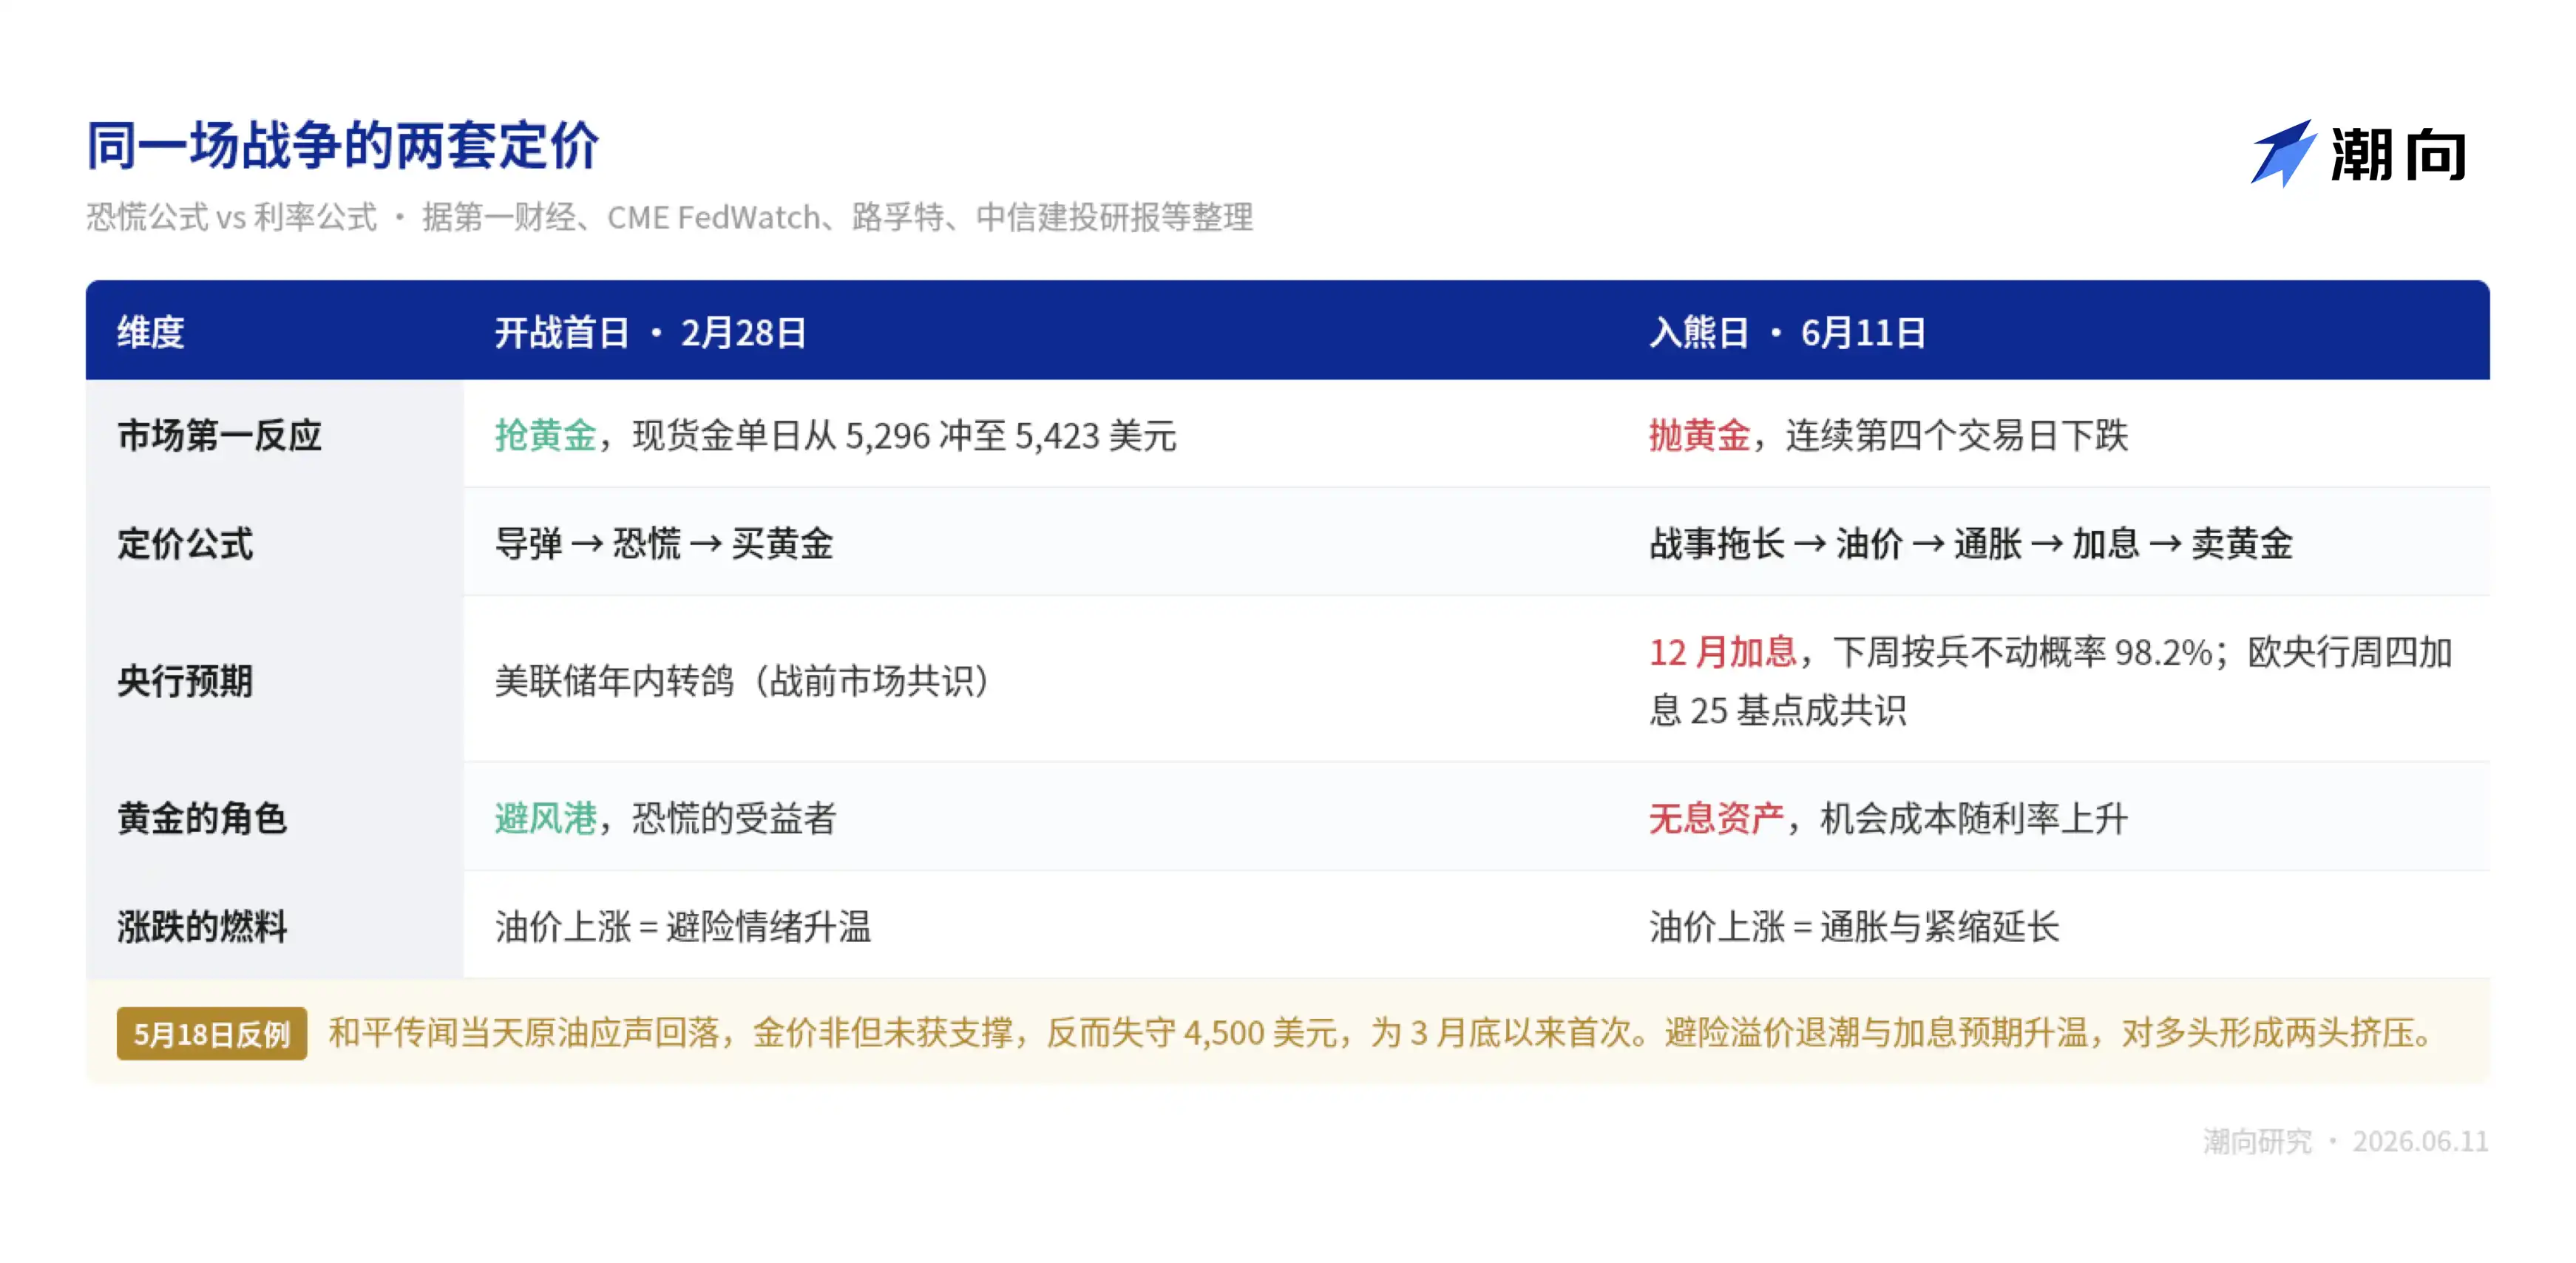
But the reality was, the gold price directly lost the $4,500 level that day, the first time since late March.

It falls on peace news because safe-haven premium recedes; it also falls on war news because rate hike expectations intensify. Bulls are trapped on both sides—this is the true nature of this gold bear market.

CITIC Securities gave an even more pointed judgment in a research report:

The essence of gold's surge in 2025 was liquidity pricing. After the US-Iran博弈 triggered inflation expectations, liquidity pricing receded accordingly, and gold must return to its own fundamentals.

In other words, those who bought gold last year profited from loose money, and are losing this year due to tightening money. The missiles in the war were merely messengers from start to finish.

However, if this were merely a grudge between gold and interest rates, the June decline list shouldn't be so long. Silver, Bitcoin, even the Nasdaq... all are taking hits in the same direction, and falling more and more like the same trade.

0.9 Correlation with Nasdaq, No One is Spared in a Deleveraging Market

First, consider a strange phenomenon.

During the over three months gold has been falling from its peak, the Nasdaq 100 Index kept rising, only peaking in early June. One was halfway down the bear market mountain, the other at the top of a bull market—originally on separate paths.

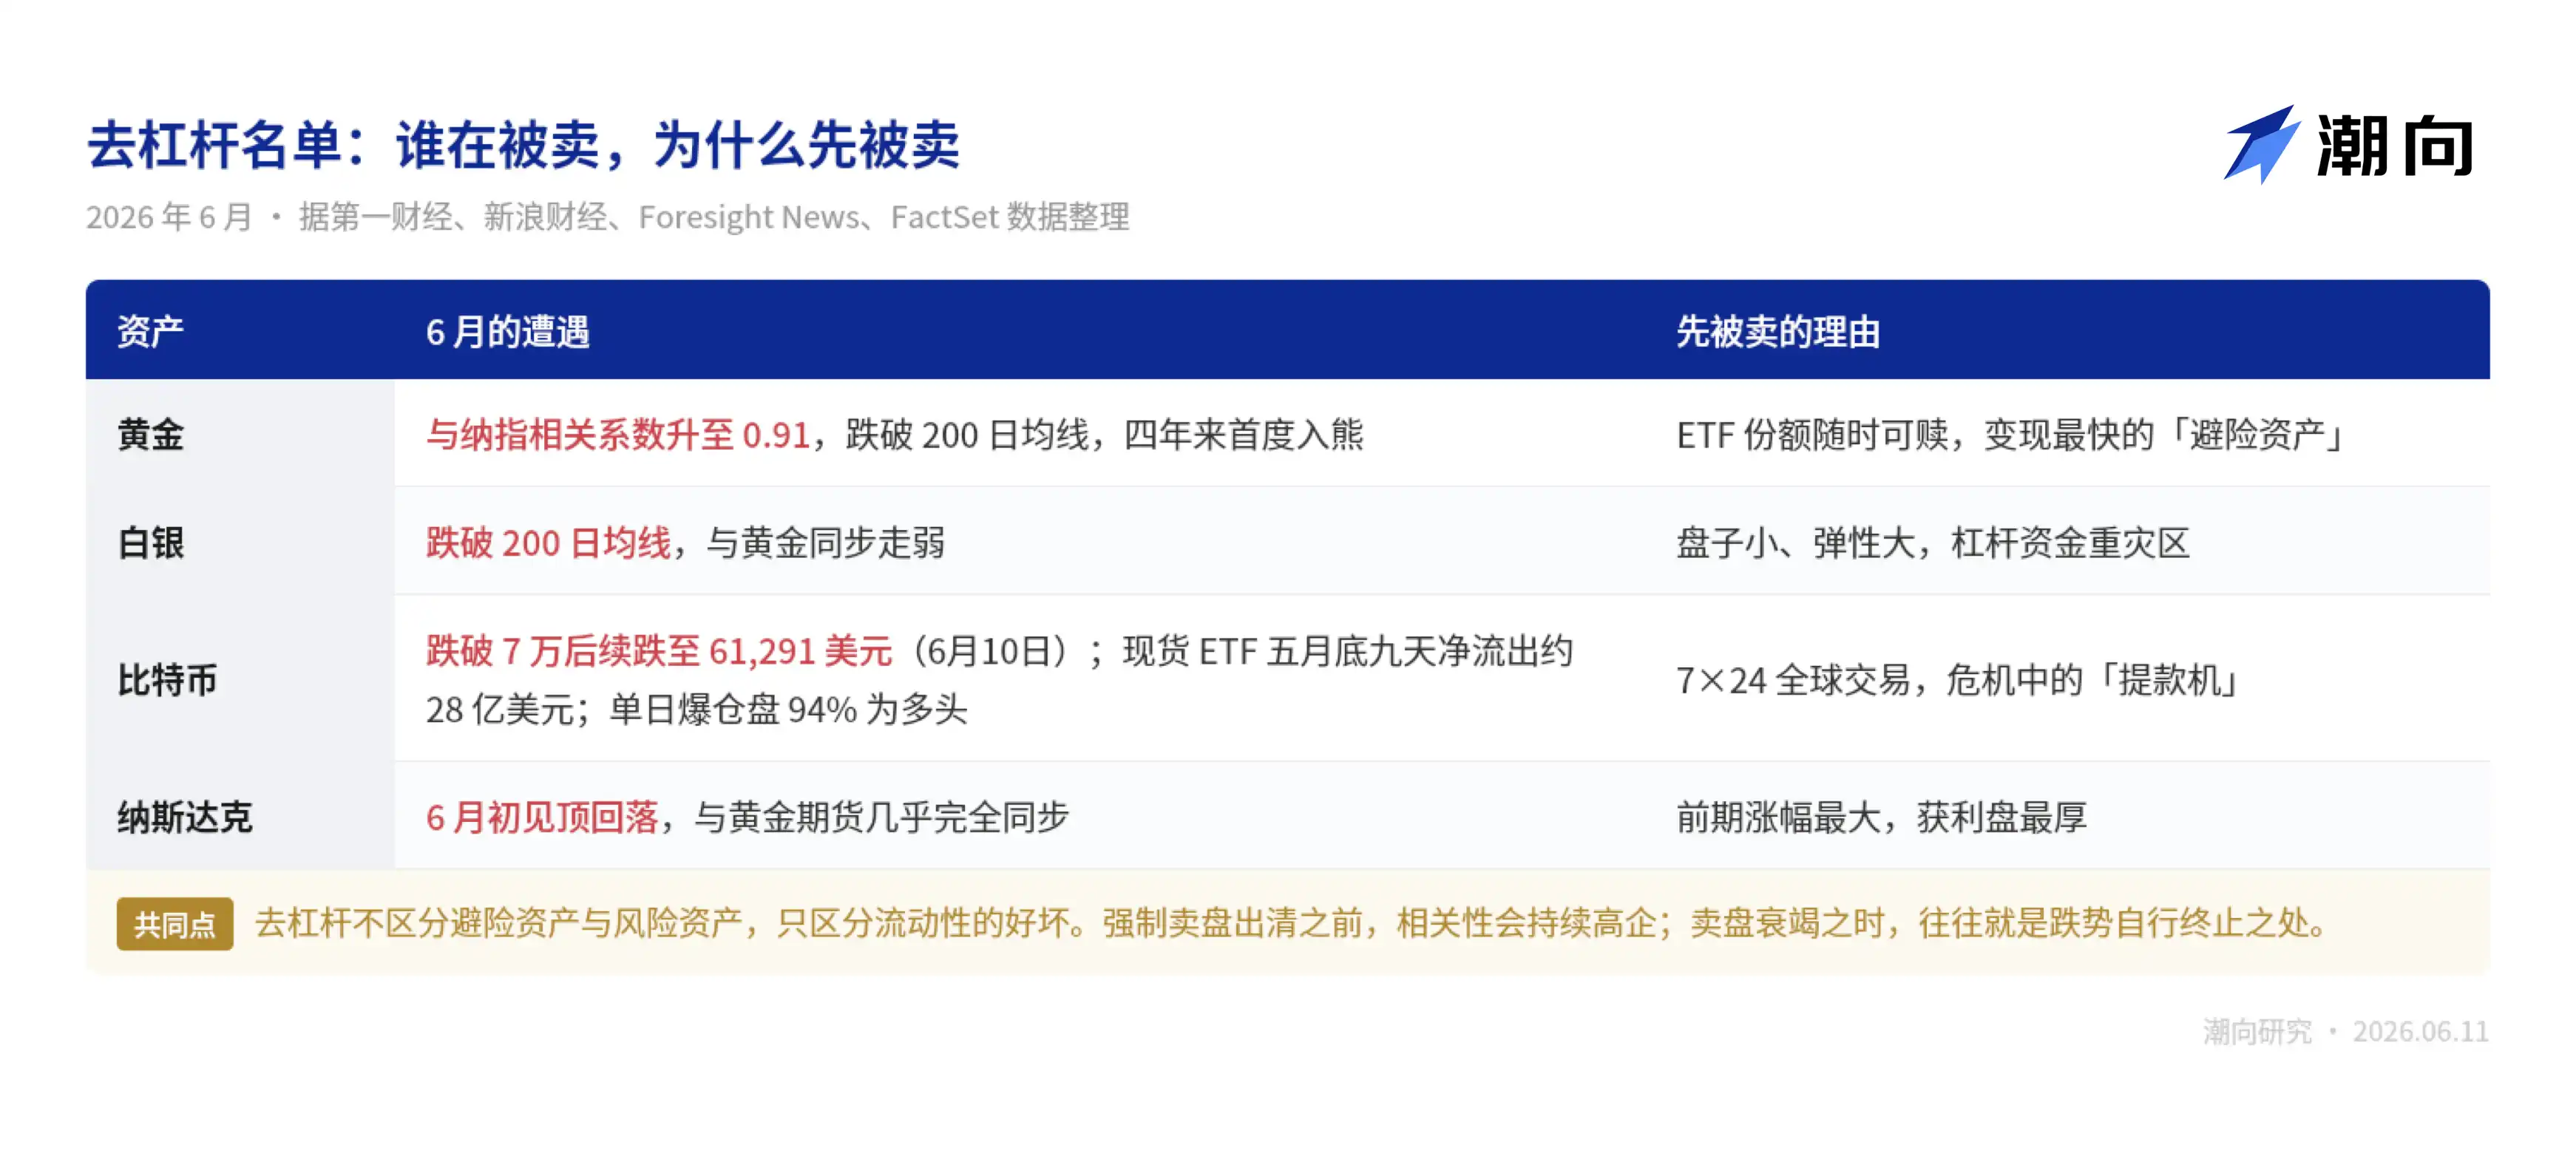
But according to a First Financial report, a managing partner at futures brokerage Altavest, based on FactSet data calculations, estimated that since around the Nasdaq peak in early June, the correlation coefficient between gold futures and the Nasdaq has reached 0.91, almost completely synchronized. His explanation: when investors seek liquidity, gold will move in sync with other risk assets in the short term.

What does this indicate?

This is classic whole-market deleveraging. Excessive positioning and high leverage earlier force investors to sell quality assets to meet margin calls on losing positions. In plain language, when you're short on cash, you sell not what you most want to sell, but what you can sell most easily.

The same story didn't spare "digital gold" Bitcoin either.

In early June, Bitcoin fell below $70,000, losing 12% in a single week. Spot ETFs saw net outflows of about $2.8 billion over nine consecutive days in late May, with 94% of single-day liquidated positions being long positions.

Bitcoin down 12% weekly, gold ETFs with continuous net outflows—their common reason for being hit isn't poor liquidity; on the contrary, it's because they are too easy to liquidate. When leveraged positions face margin calls, the first things sold are those that can be turned into cash the fastest.

Another more interesting detail. According to National Business Daily reports, the three biggest buyers pushing gold to its peak in January this year were the Polish central bank, Tether, and the world's largest gold ETF, SPDR, collectively hoarding nearly 1,780 tons over the past year.

A stablecoin company converting profits into gold bars, and four months later, standing guard alongside retail investors who chased the high in late January. The crypto and traditional worlds copying each other's homework, this time getting called to the principal's office together.

Deleveraging has one characteristic: it doesn't distinguish between good and bad assets, only between good and bad liquidity. So its ending also has nothing to do with fundamentals; once forced selling is exhausted, the decline stops on its own.

The question is, how to judge when the selling is exhausted? Historically, there are almost two identical scripts to copy.
The 2022 Script, This Time Only Four Months In

Gold bear markets are few, but each opening act is quite similar.

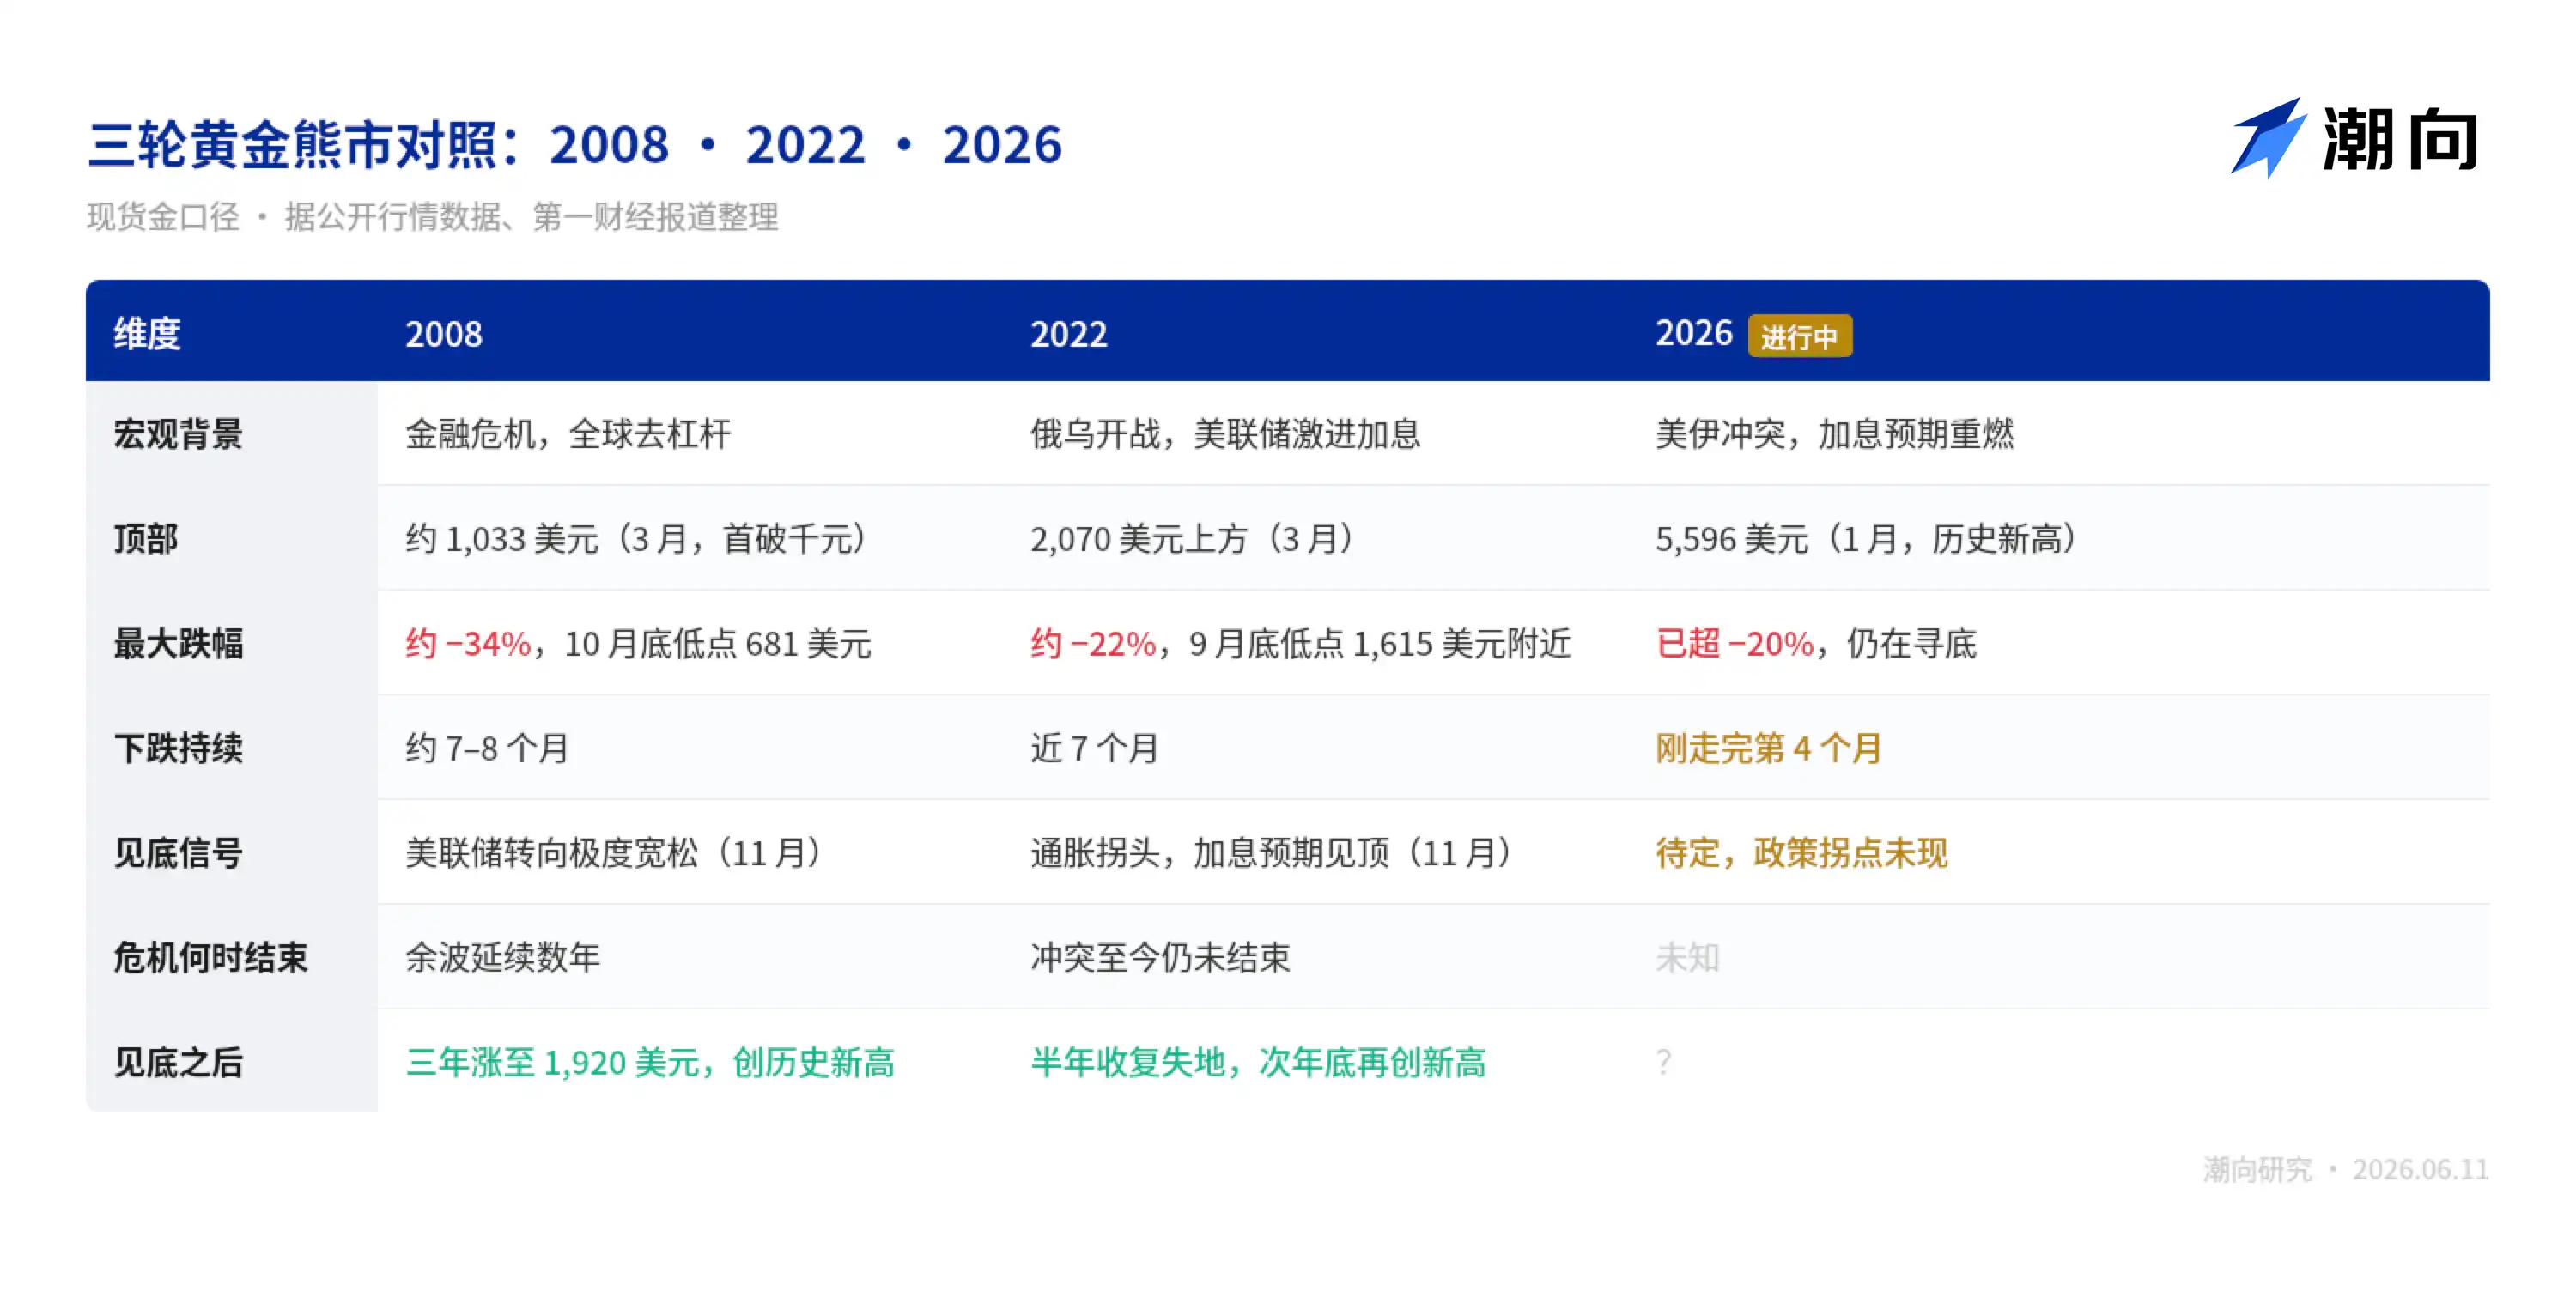
The first script is 2022. According to public market data, before the Russia-Ukraine war, spot gold started from around $1,800, surging above $2,070 after the war began. Subsequently, the Fed began aggressive rate hikes in March that year, gold prices turned and fell for nearly seven consecutive months, touching a low near $1,615 by late September, erasing all pre-war gains.

Gold prices bottomed in early November, recovered all losses within half a year, and thereafter, it was the bull run all the way to this January's peak.

War, plus tightening. Almost identical structure to now.

The second script is 2008. According to public market data, during the Lehman crisis, gold was also sold off alongside stocks, falling from its March peak when it first broke $1,000, to $681 by late October, a drop of over 30%. Subsequently, the Fed turned to extreme easing, gold bottomed in November, and rose to a historic high of $1,920 three years later.

The two scripts share a common point: The signal for gold's bottom has never been related to a ceasefire; it recognizes policy turning points.

The 2008 bottom appeared when the Fed turned to massive easing. The 2022 bottom appeared when inflation data peaked and rate hike expectations topped out. The most convincing counterexample is that the Russia-Ukraine conflict continues to this day, yet gold hit new all-time highs as early as late 2023.

Those waiting for a ceasefire to buy the dip might end up waiting and missing the boat.

Looking at timing in a rigid way, counting from the late January peak, this gold decline has only lasted four months. The 2022 decline lasted nearly seven months.

However, it's important to note that structurally, this round has a variable not present in 2022: central bank gold reserves.

The structural adjustment of various countries' foreign exchange reserves is key. The gold market's size is far smaller than the US Treasury market. Even slight portfolio shifts by major US Treasury holders have a relatively larger impact on gold prices. This round's buying floor from central banks is thicker than the last.
Buying the Dip Requires Waiting for Several Signals

With gold falling like this, voices calling to buy the dip are starting to appear. However, I think it's worth first clarifying two things:

First, how much deeper could it potentially fall; second, what should the turning point look like.

First, the depth. According to a First Financial report, Citigroup this week lowered its three-month gold price target from $4,300 to $4,000, and warned that if the Strait of Hormuz blockade persists into late summer, gold could fall to $3,500. This is already Citigroup's second revision within a month.

Investment bank targets aren't necessarily accurate, but they outline the lower limit of this decline in institutional eyes. From the current level down, the pessimistic scenario leaves about 15% more room.

Now, the turning point. I think there are only three signals worth watching:

  • Signal 1: Rate hike expectations peak.

As mentioned earlier, the engine of this bear market is interest rates. The 2022 gold bottom appeared precisely in the month when rate hike expectations peaked. If that year-end rate hike actually materializes, the event itself could be the reversal point.

Next week's Fed meeting, no change in rates is almost certain. What's truly worth watching is the dot plot and the tone of the press conference—they determine whether the year-end hike is an endpoint or a starting point.

  • Signal 2: Strait of Hormuz reopens.

It's the most upstream switch in the entire transmission chain. The strait opens, oil prices can fall; oil prices fall, inflation can ease; inflation eases, rate hike expectations recede. But note the May peace rumor already proved that ceasefire news alone isn't enough; oil prices need to fall sustainably, otherwise the chain doesn't transmit fully.

  • Signal 3: ETF fund flows turn from net outflows to net inflows.

As described earlier, the direct executors of this decline are leveraged positions and ETF redemptions; gold ETFs are the fastest escape hatch. When no one is queuing outside the door, forced selling ends.
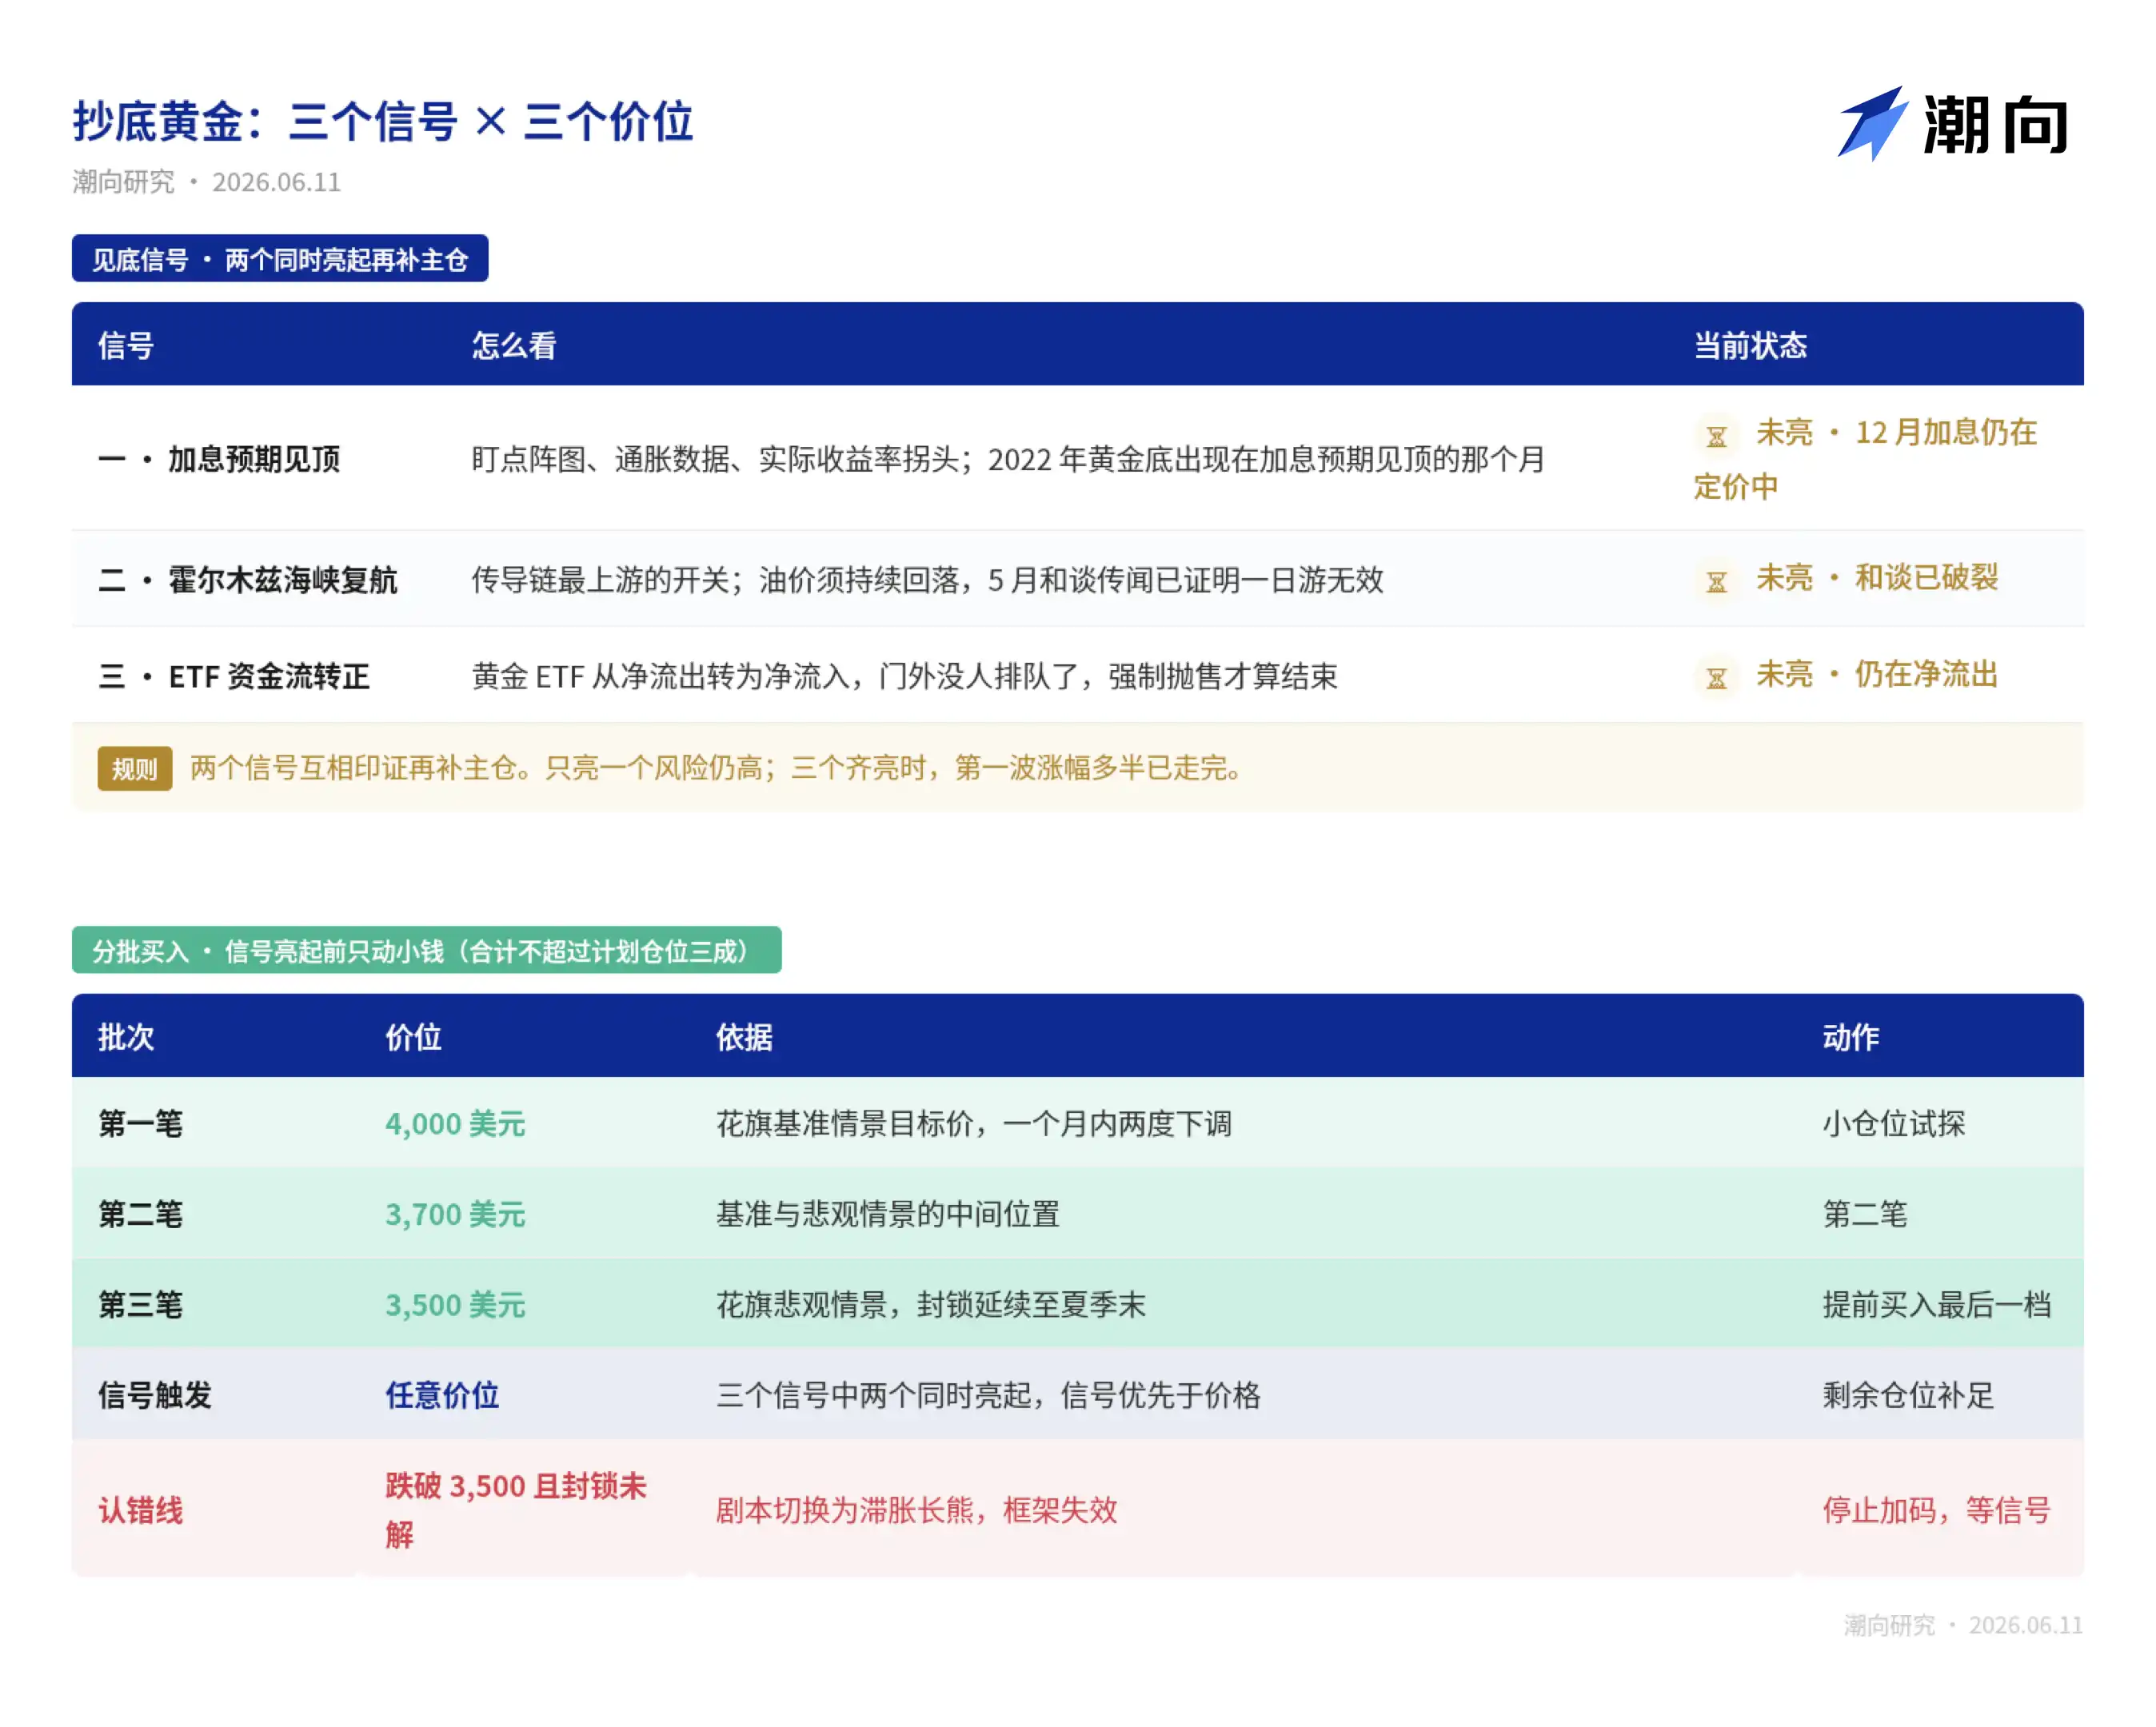
Signals discussed. Below are the author's own thoughts, not necessarily correct, for reference.

No one can precisely predict the bottom. The earlier logic is that this bear market's engine is rate hike expectations, and the market currently prices in one 25 basis point hike by year-end.

From $5,596 to the current $4,130, gold has already fallen nearly 26%, digesting most of the shift from "no hikes" to "one hike." If rate hike expectations don't worsen further, the downside space is narrowing.

Several public references can help anchor the range:

Citigroup's base and pessimistic scenarios point to $4,000 and $3,500 respectively; the 2008 bear market saw a 34% gold drop, mapping to around $3,700 here; the 2022 decline was 22%, corresponding to $4,365, a level already breached.

The author's own approach is to divide into three tranches within this range: first tranche at $4,000, second at $3,700, third at $3,500, totaling no more than 30% of the planned position, each tranche prepared to potentially be held at a loss (not investment advice, personal opinion only).

Dividing into three tranches isn't because the bottom is calculated, precisely because it can't be calculated, using dispersion to hedge the cost of judgment error.

Whenever two of the above three signals light up simultaneously, allocate the remaining position fully. By then, the price will likely have already moved off the lowest point, but trading a small portion of gains for certainty is the most cost-effective part of the entire approach. However, if $3,500 is breached and the Strait blockade isn't lifted, stop adding to early purchases and simply wait for signals.

Finally, buying gold in turbulent times isn't wrong; but watching interest rates is more useful than watching war.

Disclosure: The author holds gold.

The views expressed in this article are solely those of the author and do not constitute any investment advice. Price levels, signal frameworks, and position strategies mentioned are personal analysis records and should not be used as trading basis.

Markets involve risks; make decisions independently.

Data Sources: First Financial · National Business Daily · Lanjinger News · Cailian Press · Sina Finance · CME FedWatch · Refinitiv (LSEG) · FactSet · Citigroup Research Report · CITIC Securities Research Report · Yahoo Finance Market Data

Chaoxiang Research · June 2026

Kripto yang Sedang Tren

Pertanyaan Terkait

QAccording to the article, what is the primary factor driving the current bear market in gold, rather than geopolitical conflict?

AThe primary factor driving the gold bear market is monetary policy and interest rate expectations. The article argues that rising interest rates increase the opportunity cost of holding non-yielding gold, and that market expectations have shifted from anticipating rate cuts pre-conflict to pricing in future rate hikes post-conflict, which undermines gold's foundation.

QWhat event in late January 2026 initially triggered the sharp reversal in gold prices from their all-time high?

AThe sharp reversal was triggered on January 30, 2026, when former U.S. President Trump nominated Kevin Warsh, known for his hawkish stance, as the next Federal Reserve Chair. This news caused the gold price to plunge nearly $670 within 30 hours, marking a record single-day drop since 1983.

QThe article mentions that gold's correlation with the Nasdaq 100 reached an extremely high level recently. What does this high correlation indicate about the market environment?

AThe near-perfect correlation (0.91) between gold futures and the Nasdaq 100 index indicates a market-wide deleveraging event. Investors facing margin calls are forced to sell their most liquid assets—including gold and tech stocks—to raise cash, regardless of the assets' fundamental qualities.

QBased on historical precedents from 2008 and 2022 cited in the article, what has consistently signaled a bottom for gold prices?

AHistorically, the bottom for gold prices has been signaled by a policy拐点 (inflection point), not by the end of geopolitical conflicts. In 2008, the bottom came with the Fed's shift to extreme monetary easing. In 2022, the bottom coincided with peak inflation and peak interest rate hike expectations.

QWhat are the three key signals the author suggests watching to identify a potential turning point for gold?

AThe three key signals are: 1) Peak interest rate hike expectations (when the market stops pricing in further rate increases). 2) The reopening of the Strait of Hormuz, which would lower oil prices and inflation pressures. 3) A reversal in Gold ETF fund flows from net outflows to net inflows, indicating the end of forced selling.

Bacaan Terkait

Setelah Tiga Kuartal Berturut-Turut Turun, Bisakah Pasar Kripto Menyambut Jendela Stabilitas di Kuartal Ketiga?

Pasar kripto mengalami kuartal terburuk sejak 2022, dengan kapitalisasi pasar turun 12.6% menjadi $2.1 triliun, didorong oleh keluarnya modal dan penurunan volume perdagangan. Bitcoin dan Ethereum masing-masing jatuh 14.2% dan 25.4% di kuartal kedua. Aliran keluar bersih dari ETF Bitcoin AS mencapai $4.67 miliar, menandakan tekanan jual yang berkelanjutan. Faktor utama meliputi terputusnya hubungan dengan saham AS, kebijakan moneter Federal Reserve yang ketat, dan pelepasan aset oleh perusahaan seperti Strategy. Proses legislasi UU CLARITY yang akan memberikan kejelasan regulasi terhambat, meningkatkan premi risiko di sektor ini. Namun, ada tanda-tanda potensi stabilisasi. Aliran keluar ETF yang besar secara historis sering terjadi di akhir fase penurunan, dan para pemegang Bitcoin jangka panjang mulai menambah kepemilikan lagi. Sementara sebagian besar sektor menyusut, pasar prediksi dan aset koleksi yang ditokenisasi mencatat pertumbuhan signifikan. Pandangan untuk kuartal ketiga sangat bergantung pada pertemuan Fed akhir Juli. Sinyal kebijakan yang lunak dapat mendukung pemulihan Bitcoin, sementara sikap yang hawkish dapat memicu konsolidasi lebih lanjut. Meskipun tantangan regulasi tetap ada, indikator teknis seperti harga Bitcoin yang mendekati rata-rata bergerak 200-mingguannya menunjukkan dasar jangka panjang belum rusak. Logika pasar telah bergeser dari mengandalkan narasi ke faktor fundamental seperti kebijakan dan ekspektasi suku bunga.

marsbit1j yang lalu

Setelah Tiga Kuartal Berturut-Turut Turun, Bisakah Pasar Kripto Menyambut Jendela Stabilitas di Kuartal Ketiga?

marsbit1j yang lalu

The SpaceX Trade, Terbuka: SPCXON Mulai Diperdagangkan di WEEX

SpaceX meluncurkan IPO terbesar dalam sejarah pada Juni 2026, namun akses bagi banyak pedagang terhambat oleh batasan regional dan prosedur broker. WEEX kini menghadirkan SPCXON/USDT di pasar spotnya, sebuah instrumen tokenisasi yang memungkinkan paparan terhadap pergerakan harga SpaceX melalui akun kripto yang diselesaikan dengan USDT, tanpa memerlukan broker AS atau pembiayaan bank. SPCXON adalah produk tokenisasi yang mencerminkan ekonomi kepemilikan SpaceX bagi pedagang yang memenuhi syarat di luar AS, dengan dividen diinvestasikan kembali. Aset ini diperdagangkan di WEEX sebagai pasangan spot dengan USDT, tersedia selama jam pasar, memberikan akses mudah bagi trader kripto. Kasus investasi untuk SpaceX didasarkan pada pertumbuhan pendapatan Starlink dan pencapaian Starship, meskipun valuasinya yang tinggi (sekitar 90-110 kali pendapatan) telah memperhitungkan eksekusi sempurna selama bertahun-tahun. Faktor seperti jumlah saham publik yang terbatas dan masa buka kunci (unlock) insider pertama menjadi pertimbangan penting. Penting untuk diingat bahwa SPCXON memberikan paparan, bukan kepemilikan langsung atas saham atau hak suara. Harganya dapat diperdagangkan pada premium atau diskon terhadap nilai aset bersih. WEEX menawarkan akses ke berbagai aset TradFi yang ditokenisasi seperti ini dalam satu akun terpadu, bersama dengan pasar futures dan kampanye perdagangan dengan pool hadiah.

TheNewsCrypto1j yang lalu

The SpaceX Trade, Terbuka: SPCXON Mulai Diperdagangkan di WEEX

TheNewsCrypto1j yang lalu

Momen Perdagangan BIT: BTC Masih Tertekan oleh EMA 200 Mingguan, Setelah Ditolak Mungkin Kembali Turun, Saham Penyimpanan dan Semikonduktor yang Melonjak Malam Kemudian Mulai Anjlok di Pasar Malam

**PASAR KRIPTO & SAHAM: BTC Hadapi Resistensi, Saham Semikonduktor Turun di Perdagangan Malam** Pasar kripto melanjutkan pemulihan, dengan harga Bitcoin bertahan di sekitar $66,000 setelah rebound lebih dari 15% dari titik terendah Juli. Namun, BTC menghadapi **tembok resistensi kuat di dekat $68,000**, yang bertepatan dengan biaya rata-rata investor selama lima bulan terakhir dan titik gagalnya rebound pertengahan Juni. Secara teknis, perhatian tertuju pada **200 EMA mingguan (~$68,328) sebagai level kunci**. Jika BTC ditolak di level ini, potensi penurunan menuju support $63,000 terbuka. Analis menyoroti volume rendah dan penurunan open interest futures di CME, menandakan rebound ini lebih dipicu likuiditas rendah musim panas daripada awal bull run penuh. Di pasar saham AS, **indeks futures utama turang** setelah sesi kemarin yang kuat. Sektor semikonduktor dan penyimpanan (storage), yang melonjak pada hari Selasa (contoh: Micron +12%), **mengalami koreksi di perdagangan malam (night trading)**. ETF semikonduktor turun 2,22% dan saham Micron turun 2,29%. Meski begitu, ada sorotan positif seperti **Super Micro Computer (SMCI)** yang naik lebih dari 15% setelah melaporkan pandangan pendapatan yang kuat dan pesanan baru yang sangat besar, mengonfirmasi permintaan server AI tetap solid. Kekhawatiran makro muncul dari **kenaikan harga minyak mentah (di atas $91)** akibat ketegangan geopolitik dan **lonjakan imbal hasil (yield) obligasi pemerintah AS**, dengan imbal hasil 10-tahun mencapai sekitar 4,64%. Faktor-faktor ini dapat menambah tekanan inflasi dan membatasi ruang gerak pasar saham. Saham terkait kripto seperti Coinbase dan Robinhood naik kuat didorong oleh perkembangan regulasi yang lebih jelas di AS. Di Asia, **Korea Selatan** dan **Jepang** menunjukkan kinerja beragam. Indeks KOSPI Korea naik didukung pemulihan saham semikonduktor, sementara pasar Jepang melemah dengan **Yen terus melemah ke level terendah sejak 1986**, meningkatkan kekhawatiran akan intervensi bank sentral. **Yang Perlu Diperhatikan Selanjutnya:** * **22 Juli:** Acara AI AMD, rilis laporan keuangan dari Google (Alphabet), Tesla, IBM. * **23 Juli:** Keputusan suku bunga Bank Sentral Eropa (ECB), data klaim pengangguran AS, laporan keuangan Intel. * Perkembangan lebih lanjut dari **harga minyak, imbal hasil obligasi, dan dinamika Yen Jepang** akan menjadi penentu sentimen pasar risiko secara keseluruhan.

marsbit1j yang lalu

Momen Perdagangan BIT: BTC Masih Tertekan oleh EMA 200 Mingguan, Setelah Ditolak Mungkin Kembali Turun, Saham Penyimpanan dan Semikonduktor yang Melonjak Malam Kemudian Mulai Anjlok di Pasar Malam

marsbit1j yang lalu

Mantan Ketua CFTC dan Presiden Circle, Tarbert: Satu Pihak Menasihati Anda untuk Berpikir Jangka Panjang, di Sisi Lain Menguangkan $30 Juta Sendiri

Penulis: Zen, PANews Heath Tarbert, mantan Ketua CFTC dan Presiden Circle, baru-baru ini menyerukan kepada investor untuk mengadopsi pandangan jangka panjang terhadap saham Circle, meskipun harganya telah turun 70% dari puncaknya. Namun, ia sendiri secara konsisten menjual saham CRCL sejak perusahaan go public, menguangkan sekitar $30 juta tanpa pernah membeli saham tambahan di pasar terbuka. Tarbert, yang bergabung dengan Circle pada Juli 2023 dan menjadi Presiden pada awal 2025, dikenal sebagai pendukung kuat narasi "jangka panjang" perusahaan. Namun, sehari sebelum IPO Circle, ia menetapkan rencana perdagangan 10b5-1 untuk menjual hingga 353.290 saham dalam setahun. Dalam 13 bulan setelah IPO, ia menjual lebih dari 360.000 saham, termasuk penjualan tunggal senilai $11,5 juta pada Maret 2026. Ia bahkan menetapkan rencana 10b5-1 kedua untuk menjual hingga 160.000 saham lagi pada akhir tahun 2026. Langkah Tarbert ini menuai kecaman karena dianggap tidak konsisten dengan pesan "jangka panjang" yang ia sampaikan kepada publik. Perjalanan kariernya sering dikaitkan dengan "revolving door" antara regulator dan dunia keuangan. Setelah mengundurkan diri sebagai Ketua CFTC pada Maret 2021, ia bergabung dengan Citadel Securities hanya 27 hari kemudian sebagai Kepala Penasihat Hukum, tepat saat perusahaan itu menghadapi pengawasan ketat terkait peristiwa GameStop. Di Citadel, ia juga mendukung undang-undang yang memperluas wewenang CFTC atas pasar crypto, sementara Citadel diketahui berencana berekspansi ke aset kripto. Tarbert kemudian pindah ke Circle pada 2023, membantu perusahaan mengatasi tantangan regulasi dan akhirnya go public melalui IPO langsung. Meskipun sangat berharga bagi perusahaan, tindakannya menjual saham dalam jumlah besar sambil mendorong investor untuk bertahan menimbulkan pertanyaan tentang komitmennya yang sebenarnya terhadap masa depan jangka panjang Circle.

marsbit2j yang lalu

Mantan Ketua CFTC dan Presiden Circle, Tarbert: Satu Pihak Menasihati Anda untuk Berpikir Jangka Panjang, di Sisi Lain Menguangkan $30 Juta Sendiri

marsbit2j yang lalu

Gate Research Institute: Produk Keuangan Kripto Menggulirkan Gelombang "Wall Street-ization", Kompetisi atau Integrasi?

**Ringkasan: Gelombang "Wall Street-ization" Produk Keuangan Kripto: Kompetisi atau Integrasi?** Artikel ini membahas fenomena konvergensi antara keuangan tradisional (TradFi) dan keuangan kripto (Crypto). Meskipun Bitcoin awalnya dirancang sebagai sistem peer-to-peer yang terdesentralisasi dan bebas dari perantara seperti bank, pasar kripto kini semakin diintegrasikan ke dalam infrastruktur keuangan tradisional. **Tren "Wall Street-ization":** Dimulai dengan disetujuinya ETF spot Bitcoin pada 2024, aset kripto kini dikemas menjadi produk seperti ETF (oleh BlackRock, Fidelity, dll.), futures, dan sekuritisasi aset riil (RWA) seperti obligasi pemerintah yang ditokenisasi. Ini memberikan akses yang mudah dan teregulasi bagi investor institusional, tetapi juga berarti kekuasaan atas penerbitan, penentuan harga, kustodian, dan distribusi aset kripto semakin bergeser ke lembaga keuangan besar. **Dua Jalur Konvergensi (1+1>2):** Artikel ini menyoroti dua arah integrasi: 1. **Dari CEX ke TradFi:** Dilambangkan oleh **Gate.io**, yang berkembang dari bursa kripto menjadi platform multi-aset. Gate kini menawarkan perdagangan saham nyata (AS, Hong Kong, Korea) menggunakan USDT, menyediakan akses tanpa batas waktu ke pasar tradisional. 2. **Dari TradFi ke Crypto:** Dilambangkan oleh **Robinhood**, platform broker tradisional yang memperluas layanannya ke aset kripto (termasuk melalui akuisisi Bitstamp) dan mengembangkan produk seperti token saham di blockchain. **Tujuan Bersama: Akun Keuangan "Super" Terpadu:** Kedua jalur ini bertujuan menciptakan **akun keuangan generasi berikutnya yang terpadu**. Pengguna di masa depan mungkin dapat memperdagangkan Bitcoin, saham Apple, ETF, emas, dan obligasi pemerintah yang ditokenisasi dalam satu antarmuka yang sama, menggunakan stablecoin sebagai lapisan dana. **RWA dan Obligasi Pemerintah di On-Chain sebagai Lapisan Tengah:** Tokenisasi aset dunia nyata, terutama obligasi pemerintah AS, menyediakan aset berpenghasilan rendah risiko di ekosistem on-chain. Pasar ini tumbuh pesat (naik 40% pada paruh pertama 2026) meskipun pasar kripto turun, menunjukkan permintaan nyata. **Kesimpulan:** "Wall Street-ization" bukanlah pengambilalihan sepihak, melainkan **transformasi timbal balik**. TradFi dan Crypto saling melengkapi: Crypto mendapatkan akses ke likuiditas, kepatuhan, dan jaringan distribusi yang luas, sementara TradFi mengadopsi efisiensi, kecepatan, dan pasar 24/7 dari Crypto. Hasil akhirnya adalah pembentukan **pasar modal terpadu yang lebih efisien dan global**, di mana batas antara aset tradisional dan kripto semakin kabur.

marsbit2j yang lalu

Gate Research Institute: Produk Keuangan Kripto Menggulirkan Gelombang "Wall Street-ization", Kompetisi atau Integrasi?

marsbit2j yang lalu

Trading

Spot

Artikel Populer

Cara Membeli WAR

Selamat datang di HTX.com! Kami telah membuat pembelian WAR (WAR) menjadi mudah dan nyaman. Ikuti panduan langkah demi langkah kami untuk memulai perjalanan kripto Anda.Langkah 1: Buat Akun HTX AndaGunakan alamat email atau nomor ponsel Anda untuk mendaftar akun gratis di HTX. Rasakan perjalanan pendaftaran yang mudah dan buka semua fitur.Dapatkan Akun SayaLangkah 2: Buka Beli Kripto, lalu Pilih Metode Pembayaran AndaKartu Kredit/Debit: Gunakan Visa atau Mastercard Anda untuk membeli WAR (WAR) secara instan.Saldo: Gunakan dana dari saldo akun HTX Anda untuk melakukan trading dengan lancar.Pihak Ketiga: Kami telah menambahkan metode pembayaran populer seperti Google Pay dan Apple Pay untuk meningkatkan kenyamanan.P2P: Lakukan trading langsung dengan pengguna lain di HTX.Over-the-Counter (OTC): Kami menawarkan layanan yang dibuat khusus dan kurs yang kompetitif bagi para trader.Langkah 3: Simpan WAR (WAR) AndaSetelah melakukan pembelian, simpan WAR (WAR) di akun HTX Anda. Selain itu, Anda dapat mengirimkannya ke tempat lain melalui transfer blockchain atau menggunakannya untuk memperdagangkan mata uang kripto lainnya.Langkah 4: Lakukan trading WAR (WAR)Lakukan trading WAR (WAR) dengan mudah di pasar spot HTX. Cukup akses akun Anda, pilih pasangan perdagangan, jalankan trading, lalu pantau secara real-time. Kami menawarkan pengalaman yang ramah pengguna baik untuk pemula maupun trader berpengalaman.

322 Total TayanganDipublikasikan pada 2024.12.11Diperbarui pada 2026.06.02

Cara Membeli WAR

Diskusi

Selamat datang di Komunitas HTX. Di sini, Anda bisa terus mendapatkan informasi terbaru tentang perkembangan platform terkini dan mendapatkan akses ke wawasan pasar profesional. Pendapat pengguna mengenai harga WAR (WAR) disajikan di bawah ini.

活动图片













