Mapping Volatility Through Time: Implied Volatility Heatmaps

insights.glassnodeDipublikasikan tanggal 2026-03-23Terakhir diperbarui pada 2026-03-23

Abstrak

Glassnode introduces two new implied volatility (IV) heatmap metrics—IV Moneyness Heatmap and IV Delta Heatmap—that visualize how options markets price risk across strikes and maturities over time, rather than at a single point. These tools help identify volatility regimes, such as periods of calm, stress, and transitions between them. The heatmaps display IV using color gradients, with red indicating high volatility and blue indicating low volatility. Key patterns include elevated put-side IV during drawdowns (signaling hedging demand), tail-risk repricing in deep out-of-the-money options, and regime shifts that inform trading strategies like hedging in low-vol environments or selling premium in high-vol periods. Available in Glassnode Studio, these metrics provide a dynamic view of market expectations and risk sentiment.

Options markets encode information about how participants expect prices to move. With the release of our interpolated IV metrics earlier this year, users gained access to a clean, structured volatility surface across deltas and maturities.

Now, we are extending that foundation with a new set of metrics that track how implied volatility evolves over time: the IV Moneyness Heatmap and the IV Delta Heatmap.

These metrics allow you to observe how the market prices expected movement across strikes and maturities; not just at a single point in time, but across weeks, months, and years.

Explore the live metrics in Glassnode Studio. Now available to Professional plan users for all major liquid markets, with 10-minute, hourly, and daily resolutions.

Explore heatmaps

From Snapshots to Regimes

A single IV curve gives insight into how the market is pricing risk right now. But since markets are dynamic, a snapshot view misses the broader context: Was volatility rising or falling into this point? Has the skew been shifting gradually or did it change suddenly?

The IV Heatmap captures these dynamics by plotting implied volatility across strikes over time. Instead of a single curve, it provides a continuous map that reveals volatility regimes: extended periods of calm, episodes of stress, and the transitions between them.

This allows us to observe how the market priced the buildup to a major move, how quickly fear dissipated after a drawdown, or whether elevated put demand persisted for days or weeks. Such patterns are hidden in a single snapshot view.

The IV Moneyness Heatmap

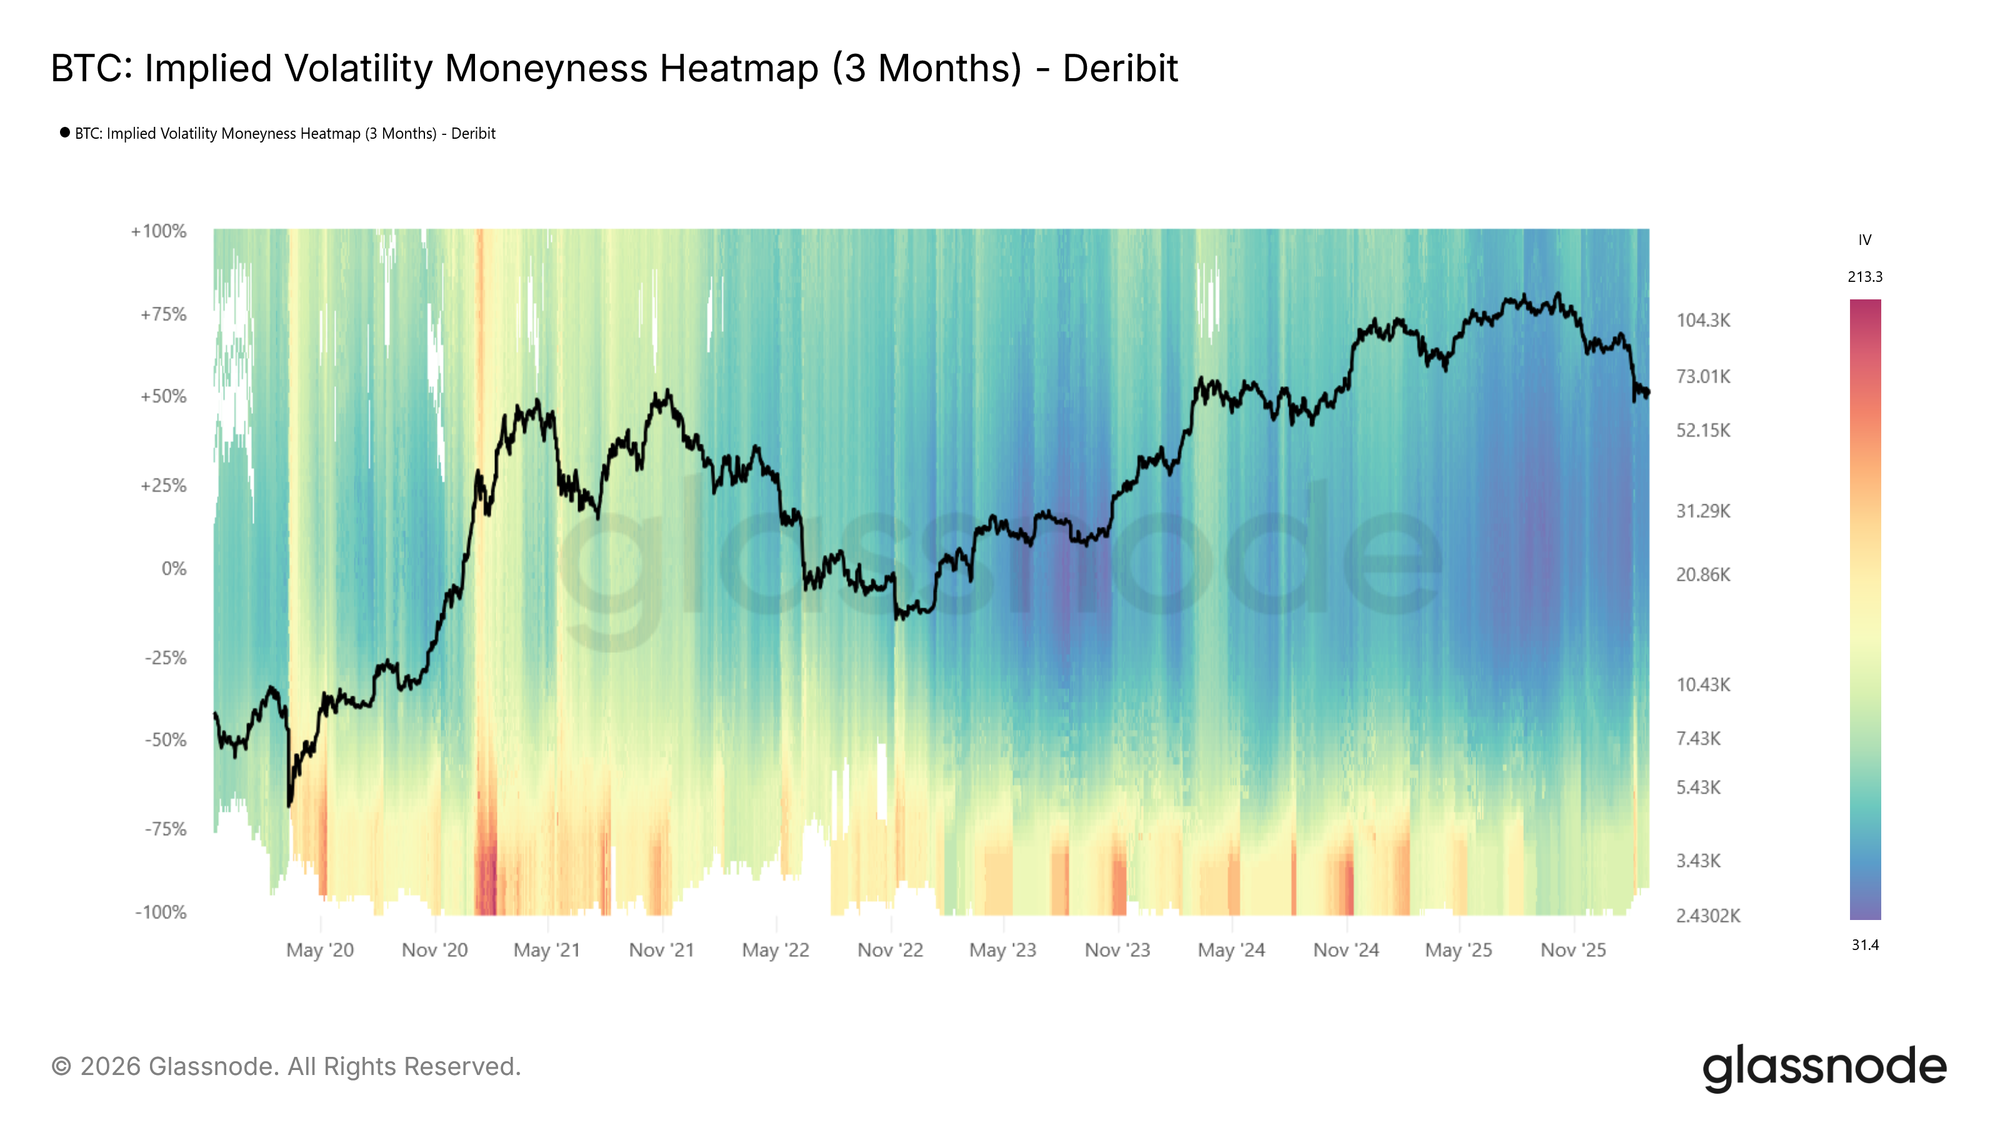
The moneyness heatmap plots implied volatility as a function of distance from spot price (% from spot) over time. Moneyness ranges from -100% to +100%, with puts below the center line (negative moneyness) and calls above it (positive moneyness). The at-the-money level runs horizontally through the middle. Warmer colors (red to dark red) indicate higher IV, while cooler colors (blue to dark blue) indicate lower IV.

IV is sampled at each target maturity and interpolated across moneyness to produce a smooth, continuous surface. The metric is available at four standardized tenors (1 week, 1 month, 3 months, and 6 months) with lookback windows ranging from 1 month to the full available history.
Visit live chart

Looking at the BTC moneyness heatmap (3m tenor), volatility regimes are clearly visible: elevated IV in 2021, a return to high volatility in spring 2024 and again around the turn of 2025, followed by a sharp compression into a very low-vol environment (dark blue).

How to read it:

  • Dark blue across both sides indicates a low-volatility regime, where the market expects limited movement.
  • Red bands on the put side (below center) signal elevated demand for downside protection.
  • Asymmetry between the put and call sides reflects directional skew, showing how much more the market is willing to pay for protection versus upside exposure.
  • Vertical color shifts, or abrupt changes in intensity across all moneyness levels, mark regime transitions.

The IV Delta Heatmap

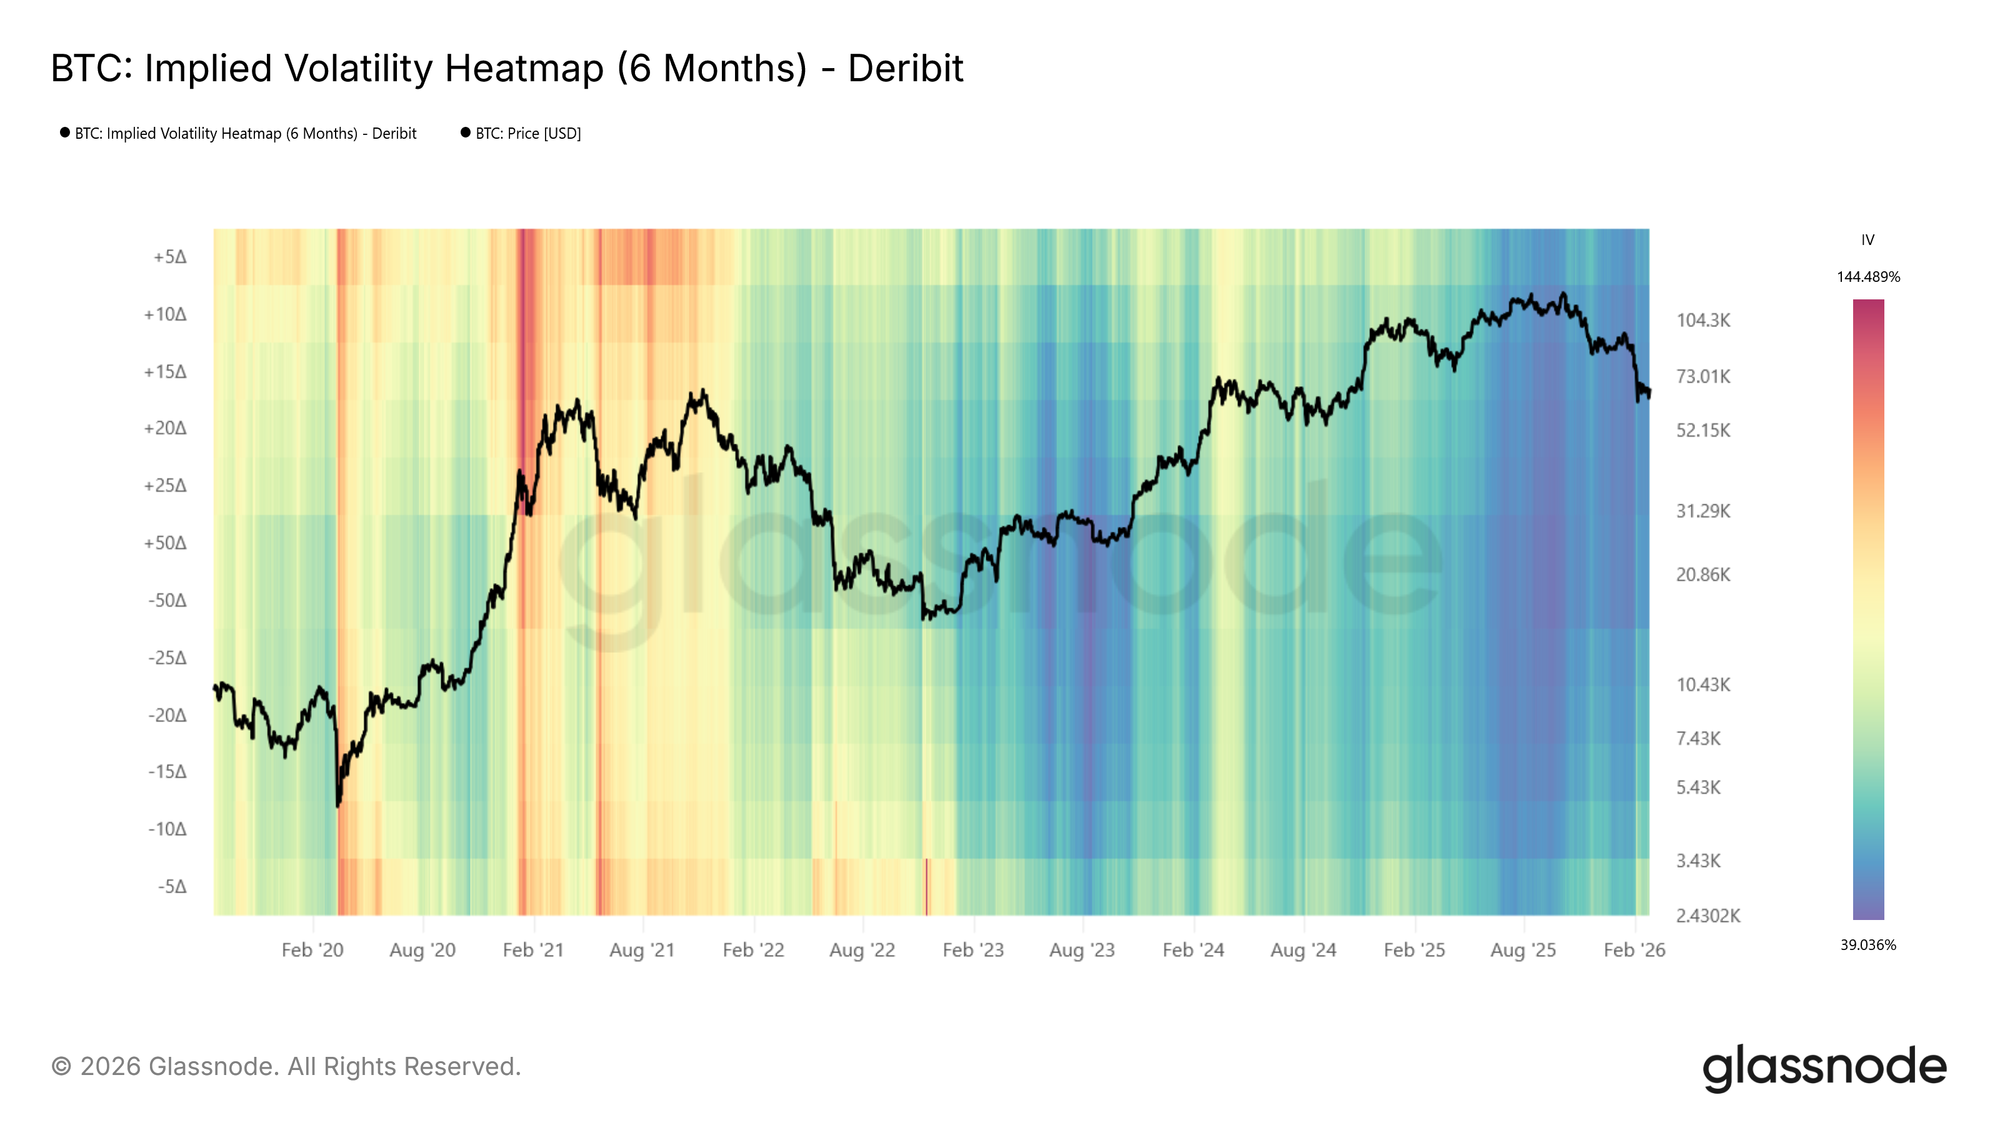
The moneyness heatmap shows IV at fixed distances from spot, a natural and intuitive way to view the surface. The same information can also be expressed in terms of delta, which normalizes each strike by its probability of expiring in the money. The IV Delta Heatmap applies this representation, built on the interpolated IV metrics described in this metric launch article. Deltas range from 5D puts to 50D (at-the-money) to 5D calls, across the same tenors and lookback windows.
Visit live chart

Examining the BTC delta heatmap (6m tenor), one notable feature emerges: during the 2021 bull run, call-side IV (above center, particularly the 5D call region) was significantly elevated compared to put-side IV. The market was pricing in large upside moves, reflecting the euphoric momentum of that period. This call-side dominance is a pattern that tends to appear during strong rallies and is clearly visible in the delta representation.

Reading the Heatmap: Patterns and Implications

Below, we identify some of the primary observable patterns in the heatmaps, describe how they present, and outline their practical relevance.

Elevated Put-Side IV: Risk Hedging in Action
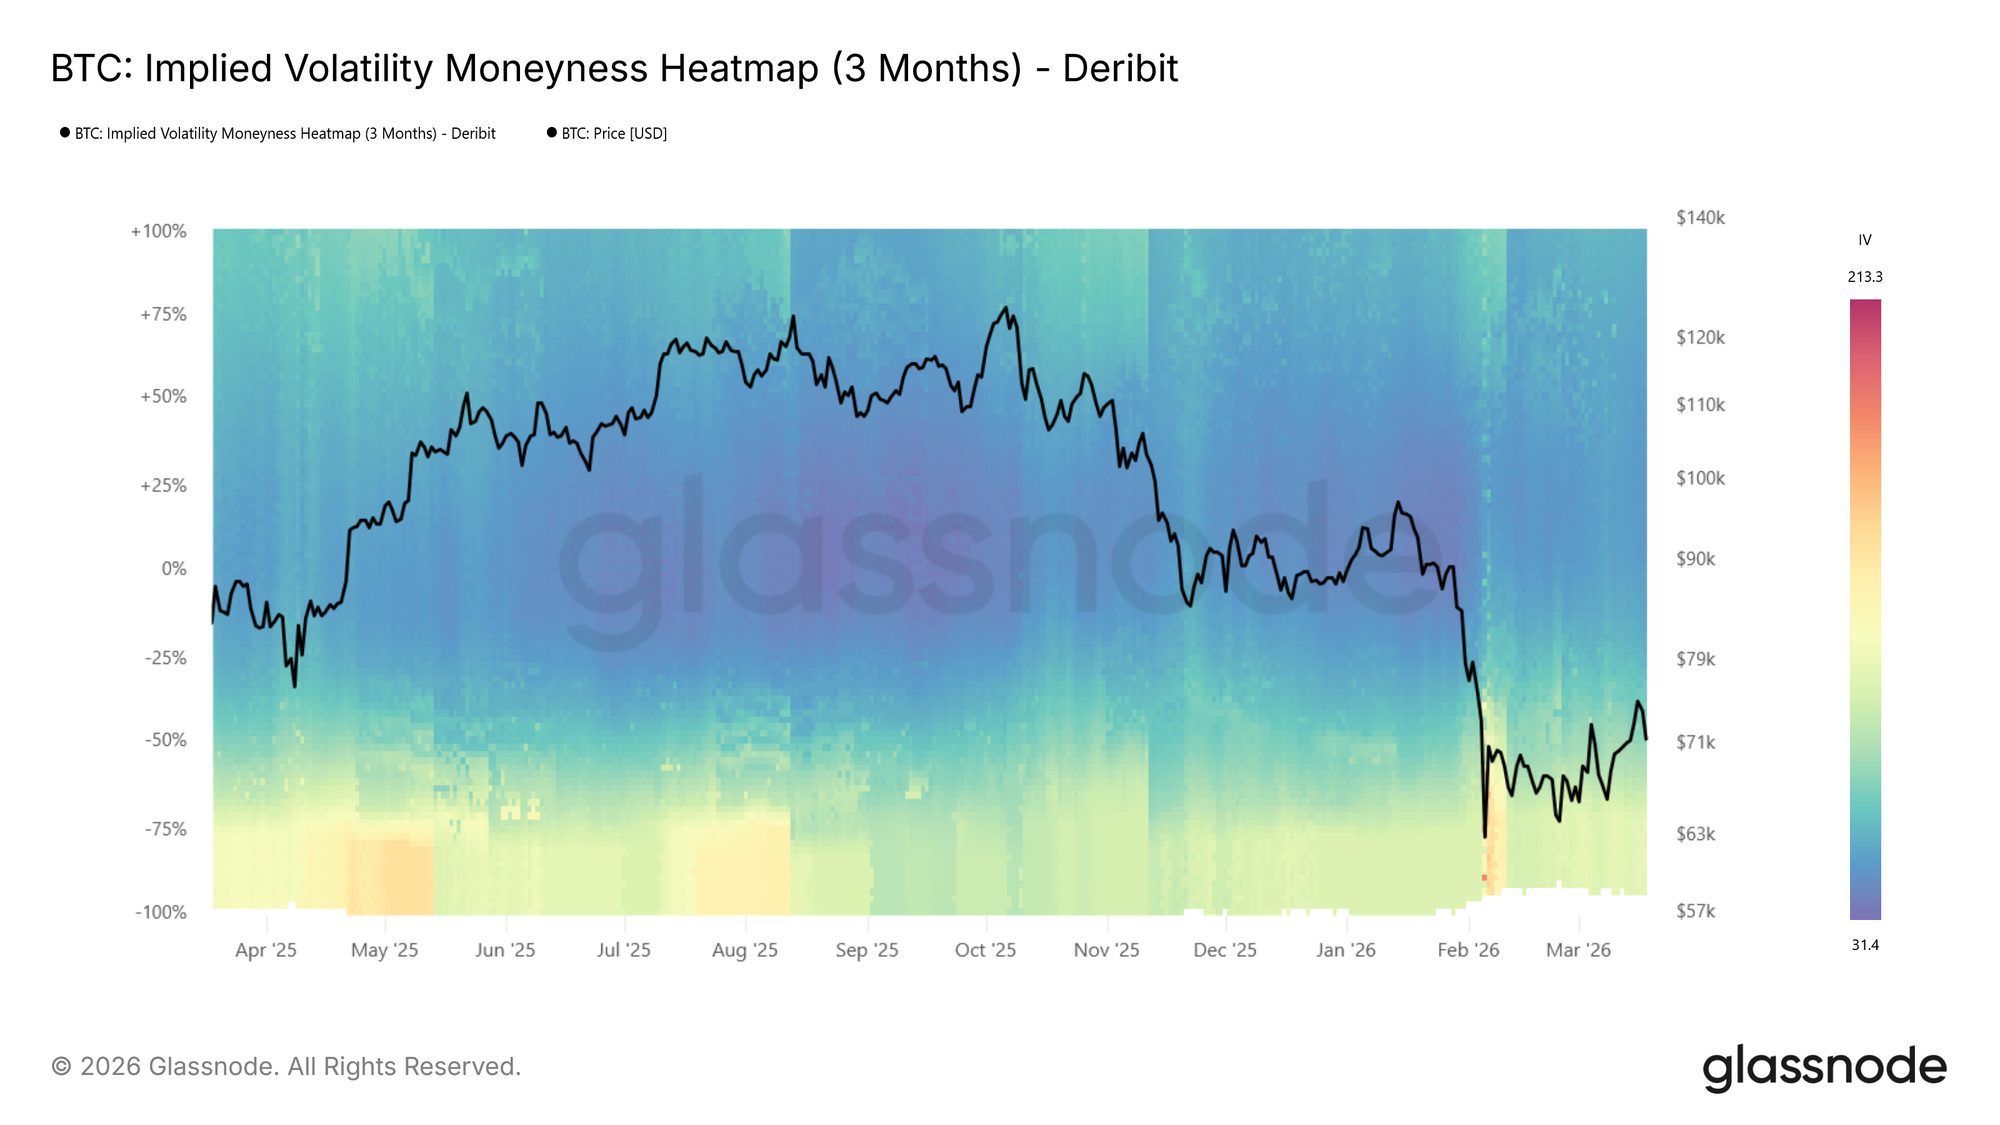
During the recent drop to $60k the put side IVs spiked strongly, shown by the transition to warm colours on the put side as price moved lower in the BTC moneyness heatmap (3m tenor) above.

During sharp drawdowns, risk hedging activity increases. Put demand rises as participants seek downside protection, pushing implied volatility higher on the put side. On the heatmap, this appears as a warm band emerging below the center line where colors were previously neutral, often intensifying to dark red as price falls further.

This is also reflected in rising expected price dispersion. Higher IV across a broader range of strikes signals growing uncertainty about where price will settle.

📈 Trading implications: Elevated put-side IV during drawdowns confirms active hedging demand. If the red band persists, the market is pricing continued risk. If it fades quickly, fear may be receding.

Tail Risk Repricing: When Outer Strikes Light Up

Sometimes the most telling signal is not where IV is already elevated, but where it wasn’t and suddenly is. During calm markets, deep OTM strikes tend to show very low IV because few participants are actively pricing or hedging at those levels. When that changes, and previously dark regions of the heatmap begin to brighten, the market is repricing tail risk.

This is distinct from a general rise in volatility. A broad increase lifts the entire surface. Tail repricing, by contrast, shows up as the warm band widening vertically into moneyness levels that had been ignored. Participants are starting to consider outcomes they had previously deemed too unlikely to hedge against.

📈 Trading implications: Watch the edges of the heatmap. If warm colors begin creeping into deep OTM levels that were previously dark blue, the market is assigning meaningful probability to larger moves. On the put side, this typically accompanies severe stress as participants hedge against outsized drawdowns. On the call side, the same pattern can emerge during euphoric rallies as the market starts pricing in large upside moves.

Low-Volatility Regimes: Cheap Protection, Expensive Later

Extended periods of subdued IV appear as dark blue across the heatmap. These regimes often correspond to consolidation phases, where the market expects limited movement in either direction.

📈 Trading implications: Crucially, low IV means option premiums are compressed. For hedgers, this presents an opportunity: downside protection via puts is relatively cheap, making it an attractive time to insure portfolios. For directional traders, buying options (calls or puts) in a low-vol environment is a pure volatility play: if IV expands, the position benefits regardless of direction.

However, prolonged compression often precedes volatility expansion. Here, it makes sense to watch for the first signs of color shifting from dark blue toward red as an early warning.

High-Volatility Regimes: Income Generation

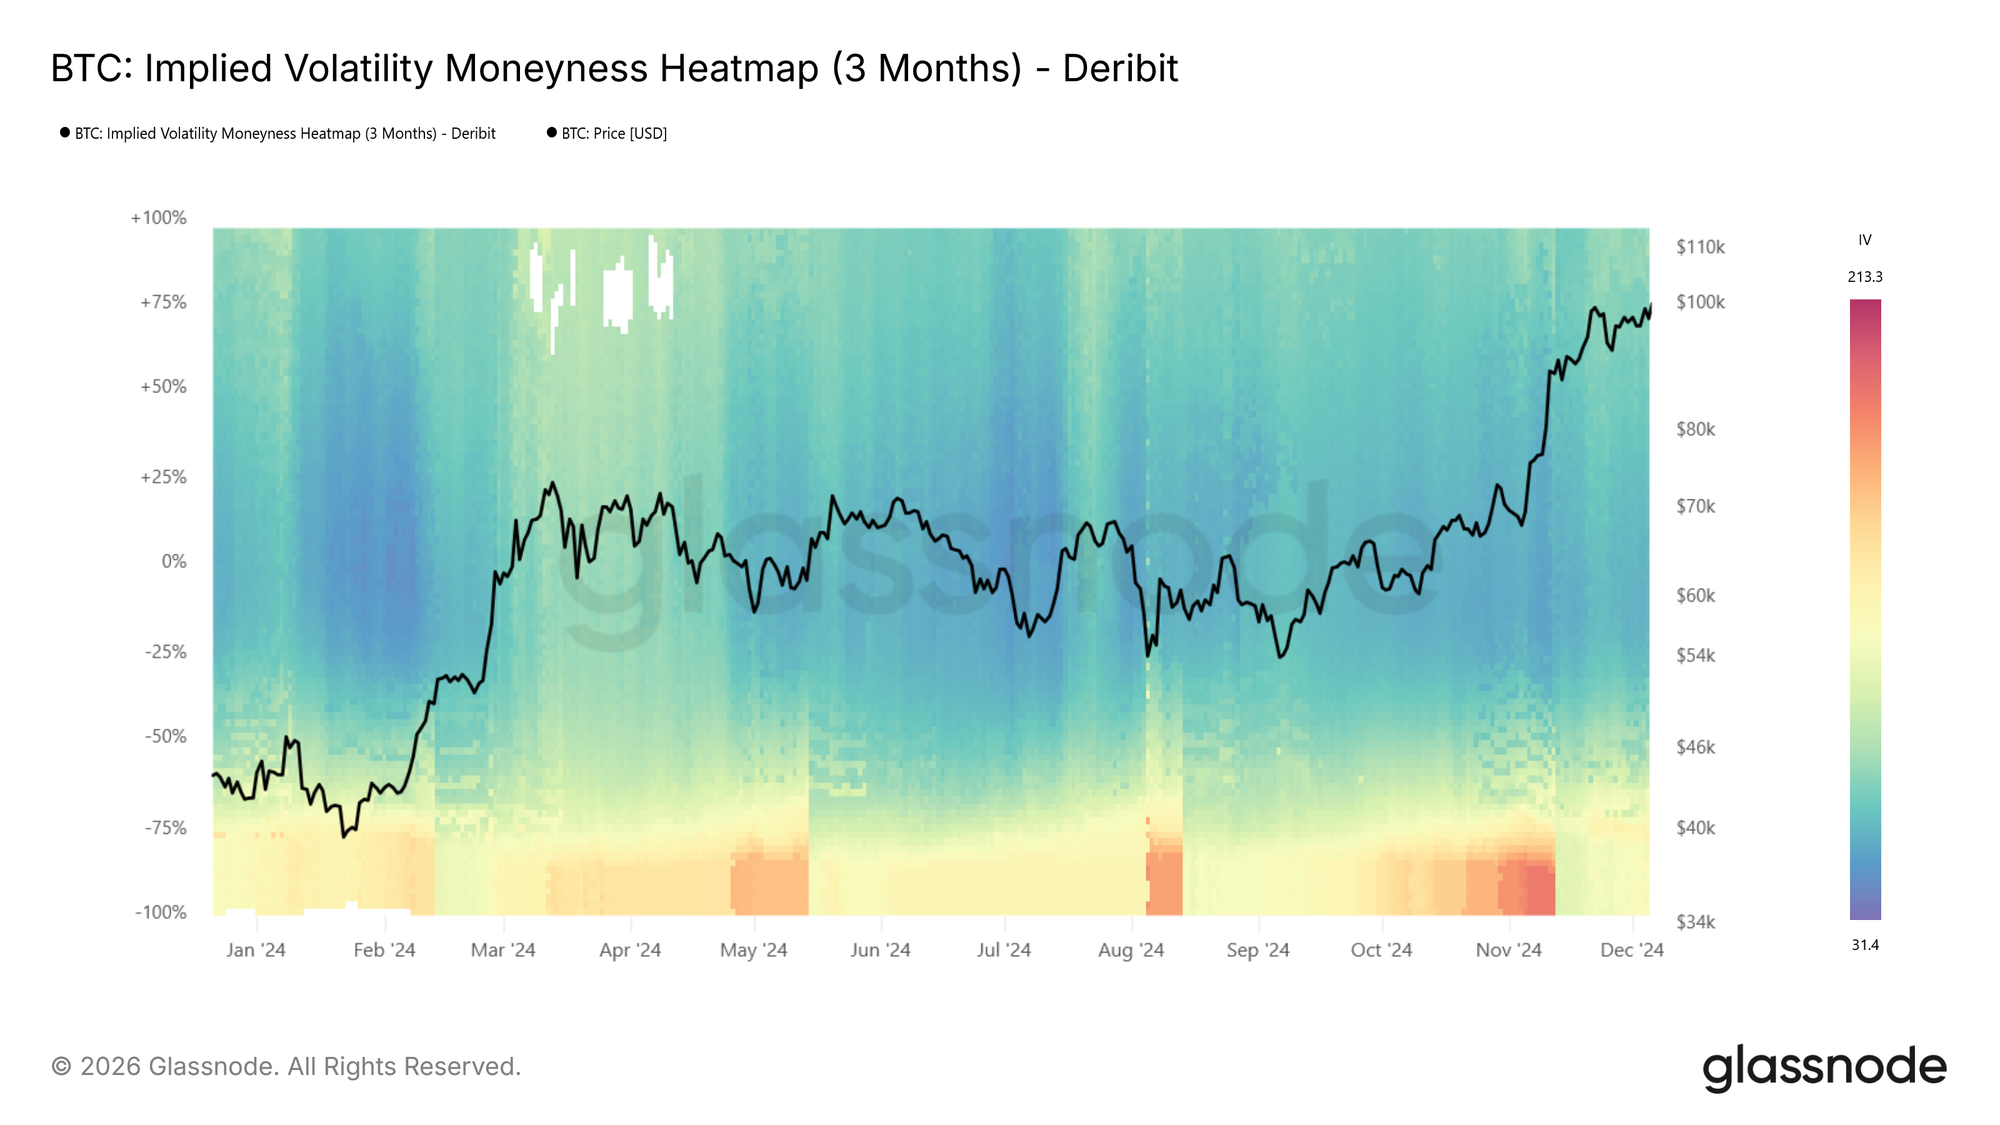
The inverse holds as well. When the heatmap is dominated by warm colors across a wide range of strikes, option premiums are elevated. This creates opportunities for income-oriented strategies: selling options (covered calls, cash-secured puts) captures rich premiums, and benefits from the eventual mean-reversion of volatility back toward lower levels.

At BTC moneyness heatmap (3m tenor) below, we see an example showing a transition from hot (red) to cool (blue), e.g., the local top in spring 2024 followed by IV compression.
Regime Transitions

The most actionable signals often come at transition points: when the heatmap shifts from blue to red (or vice versa) across multiple moneyness levels simultaneously. Unlike a transient spike that fades within a day or two, a regime transition is a sustained shift in the baseline level of expected volatility.

📈 Trading implications: Regime shifts warrant reassessing position sizing, hedge ratios, and strategy selection. A transition from low to high vol may favor momentum and long-volatility positions, while the reverse may favor mean-reversion and premium-selling strategies.

Vol Regime Quick Reference
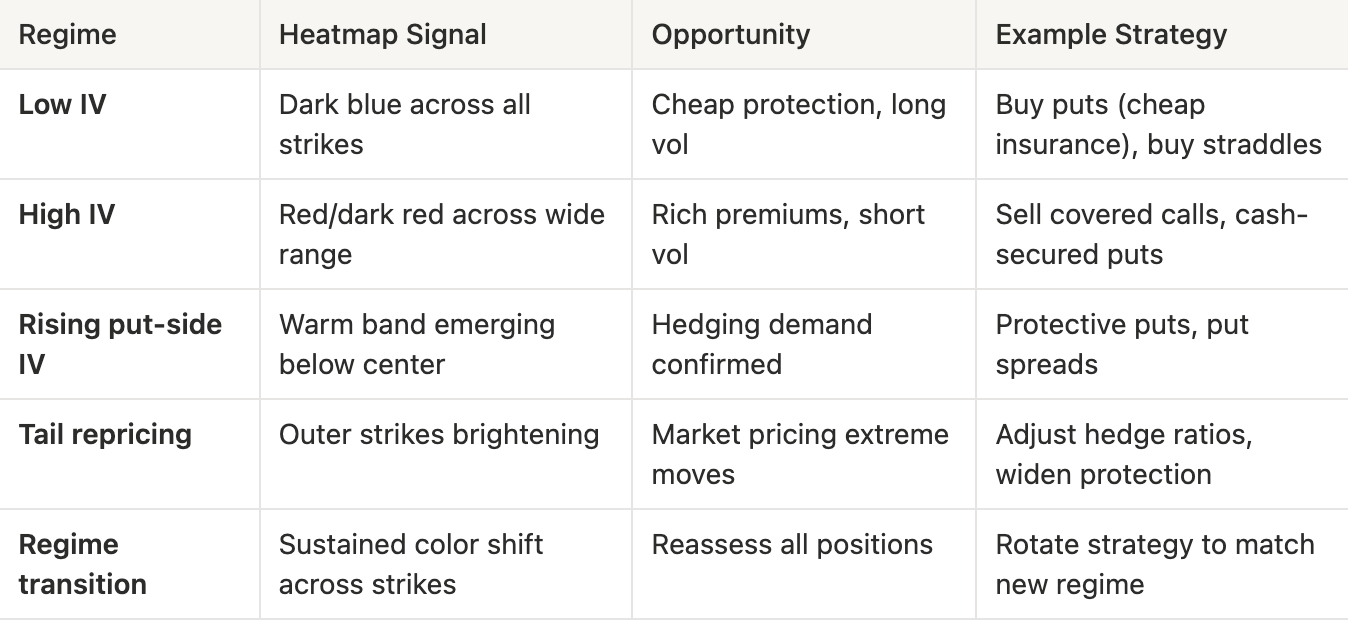
What to look for:

  • Color intensity changes: Shifts in the overall level of expected volatility
  • Put/call asymmetry: Directional risk sentiment. Is the market more concerned about downside or upside?
  • Term structure divergence: Compare the 1-week heatmap to the 3-month heatmap. If front-end IV spikes while longer-dated IV stays flat, the market sees the stress as temporary
  • Width of elevated regions: A narrow red band at specific moneyness levels suggests targeted hedging; broad red indicates widespread uncertainty

Conclusion

The IV Moneyness Heatmap and IV Delta Heatmap bring a temporal dimension to volatility analysis. Rather than asking “what does the vol surface look like now?”, you can now ask “how has it changed, and what regime are we in?”

Whether you are a discretionary trader identifying volatility regimes, or a systematic fund screening for vol regime transitions via our API, these heatmaps provide a structured, visual lens into how the options market prices risk over time.

If you want to learn more about our options data and metric offering, or gain access to these metrics, contact our dedicated team today.


  • Follow us on X for timely market updates and analysis
  • Join our Telegram channel for regular market insights
  • For on-chain metrics, dashboards, and alerts, visit Glassnode Studio

Disclaimer: This report is for informational and educational purposes only. The analysis represents a limited case study with significant constraints and should not be interpreted as investment advice or definitive trading signals. Past performance patterns do not guarantee future results. Always conduct thorough due diligence and consider multiple factors before making investment decisions.


Pertanyaan Terkait

QWhat are the two new metrics introduced in the article for tracking implied volatility over time?

AThe two new metrics are the IV Moneyness Heatmap and the IV Delta Heatmap.

QHow does the IV Moneyness Heatmap visually represent different levels of implied volatility?

AIt uses a color scale where warmer colors like red to dark red indicate higher implied volatility, and cooler colors like blue to dark blue indicate lower implied volatility.

QAccording to the article, what does a persistent red band on the put side of the heatmap typically indicate?

AA persistent red band on the put side indicates elevated demand for downside protection, signaling that the market is pricing in continued risk or fear.

QWhat trading opportunity does a low-volatility regime (dark blue on the heatmap) present for hedgers?

AIn a low-volatility regime, option premiums are compressed, making downside protection via puts relatively cheap. This presents an attractive opportunity for hedgers to insure their portfolios at a lower cost.

QWhat is a key difference between a general rise in IV and the repricing of tail risk as shown on the heatmap?

AA general rise in volatility lifts the entire IV surface uniformly. In contrast, tail risk repricing appears as a warm band widening vertically into deep out-of-the-money strikes that were previously dark blue, indicating the market is starting to assign meaningful probability to larger, previously ignored moves.

Bacaan Terkait

Dialog dengan Ray Dalio: Saat Ini Berada dalam Gelembung AI, 1% Portofolio Investasi Adalah Bitcoin

Sumber: The Diary Of A CEO Ray Dalio, pendiri Bridgewater Associates yang meramalkan krisis keuangan 2008, memperingatkan bahwa ledakan AI saat ini menunjukkan tanda-tanda klasik gelembung ekonomi yang dapat pecah dan memicu resesi. Dalam wawancara podcast, dia menjelaskan dinamika "siklus besar" yang didorong oleh ketimpangan kekayaan, defisit pemerintah, dan perubahan geopolitik. Dalio mengidentifikasi pola di mana antusiasme berlebihan terhadap teknologi revolusioner baru, seperti AI, menyebabkan harga aset melambung dan pinjaman berlebihan. Ketika kondisi berubah (seperti kenaikan suku bunga atau kebutuhan tunai), gelembung ini dapat pecah, menyebabkan penurunan harga aset, kerugian luas, dan kontraksi ekonomi. Untuk melindungi kekayaan di masa ketidakpastian, Dalio sangat menekankan pentingnya **diversifikasi portofolio**—termasuk saham, obligasi, emas, dan real estat—daripada mengandalkan uang tunai saja. Dia mengungkapkan bahwa sekitar **1% portofolionya adalah Bitcoin**, yang diakuinya sebagai aset keras, tetapi dia lebih menyukai **emas fisik** karena sejarahnya sebagai penyimpan nilai dan aset bebas liabilitas. Mengenai dampak AI, Dalio percaya bahwa teknologi ini akan menggantikan tidak hanya tenaga fisik tetapi juga kemampuan kognitif manusia, berpotensi memperlebar kesenjangan antara pemilik modal dan pekerja. Masa depan akan menguntungkan mereka yang dapat memadukan kecerdasan manusia (seperti emosi dan intuisi) dengan kemitraan AI. Secara geopolitik, Dalio menggambarkan dunia yang memasuki fase "penurunan" dalam tatanan global, dengan Amerika Serikat menghadapi tantangan internal dan eksternal, termasuk konflik seperti di Iran yang mengungkap kelemahannya. Dia memprediksi dunia mungkin menjadi lebih terregionalisasi di masa depan. Secara keseluruhan, kunci untuk navigasi melalui periode kompleks ini adalah pemahaman akan pola sejarah, adaptasi, dan diversifikasi yang cermat.

marsbit3j yang lalu

Dialog dengan Ray Dalio: Saat Ini Berada dalam Gelembung AI, 1% Portofolio Investasi Adalah Bitcoin

marsbit3j yang lalu

Rekor! Beli Bersih Asing 7,2 Triliun Won dalam Sehari, Wall Street: Tekanan Likuiditas di Pasar Saham Korea Telah Mereda

**Ringkasan: Rekor Pembelian Asing dan Peningkatan Likuiditas di Pasar Saham Korea** Aliran modal asing menunjukkan perubahan signifikan di pasar saham Korea (KOSPI). Pada 31 Juli, investor asing melakukan pembelian bersih rekor sebesar 7,2 triliun Won Korea dalam sehari, menandai pembalikan dari tren penjualan bersih besar-besaran dalam beberapa bulan terakhir. Secara bulanan, penjualan bersih asing menyusut drastis menjadi 9,8 triliun Won di Juli, turun dari 48,4 triliun dan 44,5 triliun Won pada Juni dan Mei. Tekanan penjualan dari lembaga domestik juga mereda. Dana pensiun dan reksa dana domestik justru menjadi pembeli bersih 1,0 triliun Won di Juli, setelah dua bulan sebelumnya menjadi penjual bersih. Faktor pendukung lainnya adalah peraturan baru dari Komisi Jasa Keuangan (FSC) yang memberlakukan syarat lebih ketat bagi investor ritel untuk masuk ke ETF leverage saham tunggal, yang langsung mengurangi volume perdagangan instrumen tersebut hingga sekitar 50%. Kebijakan ini diperkirakan dapat menekan volatilitas pasar. Citigroup mempertahankan target indeks KOSPI di level 10.000 poin, menyoroti memudarnya angin penentu likuiditas. Analis mereka menilai faktor fundamental seperti industri chip memori yang solid, valuasi historis yang rendah, fundamental ekonomi Korea yang kuat, dan dukungan kebijakan berpotensi menjadi pendorong bagi pasar.

marsbit3j yang lalu

Rekor! Beli Bersih Asing 7,2 Triliun Won dalam Sehari, Wall Street: Tekanan Likuiditas di Pasar Saham Korea Telah Mereda

marsbit3j yang lalu

Pembaruan! AI Generasi Berikut OpenAI Pecahkan 10 Masalah Kelas Medali Fields

**OpenAI Model Astra Pecahkan 10 Masalah Matematika Kelas Fields Medal!** OpenAI mengumumkan terobosan besar dari model internal terbarunya, Astra. Model ini dilaporkan telah membuat kemajuan signifikan dalam **10 masalah matematika yang belum terpecahkan**, dengan biaya komputasi hanya sekitar **$2000**. Hasilnya dipublikasikan dalam makalah setebal 249 halaman. Beberapa pencapaian utama meliputi: 1. **Menyelesaikan masalah "non-sofic group"** yang diajukan Mikhail Gromov tahun 1999, dengan membangun contoh kelompok yang tak hingga dan finitely presented yang bukan sofic. Ini dianggap sebagai kemajuan bersejarah. 2. **Memecahkan batas lama dalam masalah pengepakan bola berdimensi tinggi** (sphere packing), meningkatkan batas yang telah bertahan sejak 1978 untuk dimensi tak hingga. 3. **Menyangkal dugaan "Connes Rigidity"** dengan membangun keluarga tak terhitung dari kelompok berbeda yang menghasilkan aljabar von Neumann yang sama persis. Semua bukti telah diverifikasi menggunakan asisten pembuktian formal Lean 4, memastikan ketepatannya. Para ahli matematika menyebut temuan ini sebagai **momen bersejarah**, setara dengan prestasi penghargaan Fields Medal, dan menandai kemampuan AI untuk melakukan penalaran matematika mendalam di berbagai bidang. OpenAI juga membagikan proses penalaran model, menunjukkan langkah maju yang besar menuju AGI (Artificial General Intelligence).

marsbit4j yang lalu

Pembaruan! AI Generasi Berikut OpenAI Pecahkan 10 Masalah Kelas Medali Fields

marsbit4j yang lalu

Bagaimana Membuat Diri Sendiri Tak Tergantikan oleh Kecerdasan Buatan

**Ringkasan: Bagaimana Membuat Diri Anda Tak Tergantikan oleh AI** Artikel ini membahas ancaman nyata dalam era AI: bukan kehilangan pekerjaan, tetapi "perbudakan gaji"—ketergantungan pada sistem dan orang lain untuk bertahan hidup. Solusinya adalah menjadi "individu super" yang "tak bisa dipekerjakan" dengan membangun bisnis atau karya sendiri. Kunci untuk bertahan dan berkembang di masa depan bukan sekadar keterampilan teknis, tetapi menguasai lima elemen yang sulit digantikan AI: 1. **Otonomi (Agency):** Kemampuan bertindak tanpa menunggu perintah. 2. **Rasa (Taste):** Pengalaman untuk mengetahui apa yang bernilai untuk ditawarkan. 3. **Kemampuan Persuasi (Persuasion):** Keterampilan menarik perhatian dan pengakuan. 4. **Ketekunan (Persistence):** Memahami bahwa kegagalan adalah bagian dari proses. 5. **Iterasi (Iteration):** Kemampuan memperbaiki kesalahan berdasarkan umpan balik. Lima elemen ini dapat dikembangkan dengan **membuat konten** (media). Dibandingkan pemrograman (code), konten lebih unggul karena nilainya subjektif, membutuhkan penilaian manusia, dan merupakan alat distribusi yang ampuh untuk membangun koneksi dan otoritas. Untuk memulai transformasi: 1. **Ubah lingkungan** Anda secara drastis untuk memicu perubahan identitas. 2. **Gali "bahan mentah"** Anda: Identifikasi pengetahuan mendalam, masalah yang pernah Anda selesaikan, dan minat unik masa kecil Anda. 3. **Temukan "poros pemikiran balik"**: Tentukan pendapat kontra-intuitif atau keyakinan Anda yang bertentangan dengan arus utama dalam bidang Anda. 4. **Luncurkan ide pertama** Anda besok. Gabungkan jawaban dari langkah 2 dan 3, lalu publikasikan. Umpan balik nyata dari dunia adalah guru terbaik. Intinya, bangunlah *karier seumur hidup* yang autentik berdasarkan pengalaman dan sudut pandang unik Anda. Dengan memanfaatkan AI sebagai alat dan fokus pada pengembangan diri yang tak tergantikan, Anda dapat mengambil kendali atas hidup dan masa depan Anda.

marsbit5j yang lalu

Bagaimana Membuat Diri Sendiri Tak Tergantikan oleh Kecerdasan Buatan

marsbit5j yang lalu

Kunci Bitcoin Disimpan Offline Berkat Lemparan Dadu, Tetapi Tidak Semua Orang Akan Melakukannya

Berdasarkan insiden kerentanan generator angka acak pada perangkat hardware wallet Coldcard, artikel ini membahas metode pembuatan kunci Bitcoin menggunakan dadu untuk menghasilkan entropi mandiri. Claude Shannon mengukur ketidakpastian dengan konsep entropi, di mana satu lemparan dadu enam sisi setara dengan sekitar 2,585 bit. Praktik melempar dadu 50 hingga 99 kali dapat menghasilkan frasa pemulihan 12 kata yang aman (128 bit entropi), melampaui ketergantungan pada generator perangkat. Namun, insiden Coldcard mengungkap bahwa meskipun seed utama dibuat dari dadu aman, fungsi lain seperti dompet kertas, kunci kloning, dan password masih berpotensi menggunakan generator cacat. Peneliti keamanan Kevin Loaec menekankan bahwa perlindungan hanya berlaku untuk seed utama, bukan keseluruhan sistem. Proses manual ini membutuhkan ketelitian tinggi, rentan kesalahan, dan tidak praktis bagi kebanyakan pengguna baru. Oleh karena itu, meski kuat secara matematis, metode ini lebih cocok untuk pengguna berpengalaman. Artikel menyarankan pemilik Coldcard untuk memperbarui firmware, memeriksa fungsi yang pernah digunakan, dan mempertimbangkan skema multisignature dengan perangkat dari produsen berbeda untuk mitigasi risiko. Tujuan jangka panjang adalah perangkat yang dapat menghasilkan keacakan kuat secara mandiri, tanpa memerlukan prosedur rumit dari pengguna.

cryptonews.ru8j yang lalu

Kunci Bitcoin Disimpan Offline Berkat Lemparan Dadu, Tetapi Tidak Semua Orang Akan Melakukannya

cryptonews.ru8j yang lalu

Trading

Spot
活动图片




