Token Watch, Based on RootData, Launches Interactive Relationship Graph for Projects, Investors, and Key Figures

marsbitDipublikasikan tanggal 2026-07-27Terakhir diperbarui pada 2026-07-27

Abstrak

Token Watch, operated by Token Post, has launched a new "Interactive Relationship Graph" feature. This tool visually maps the connections between cryptocurrency projects listed on the Korean Won market, their investors, and key individuals. The graph allows users to explore investment backgrounds, see which investors co-invest in other projects, and track the past and present affiliations of core team members. Key features include the ability to filter by project, investor, or person, and to view different relationship types: general investment, lead investment, current affiliation, and past affiliation. A focus mode lets users isolate connections within two degrees of a selected node for clearer analysis. The graph is designed to help users identify co-investors, frequent VC partnerships, investor overlap between competing projects, and recurring key figures across the ecosystem. The underlying data for investors and individuals is sourced from RootData, with some verification by the Token Post editorial team. The web-based tool is available in both Korean and English. Token Watch emphasizes that the information is for reference and analysis purposes only and does not constitute investment advice.

Author: Han Jae-ho

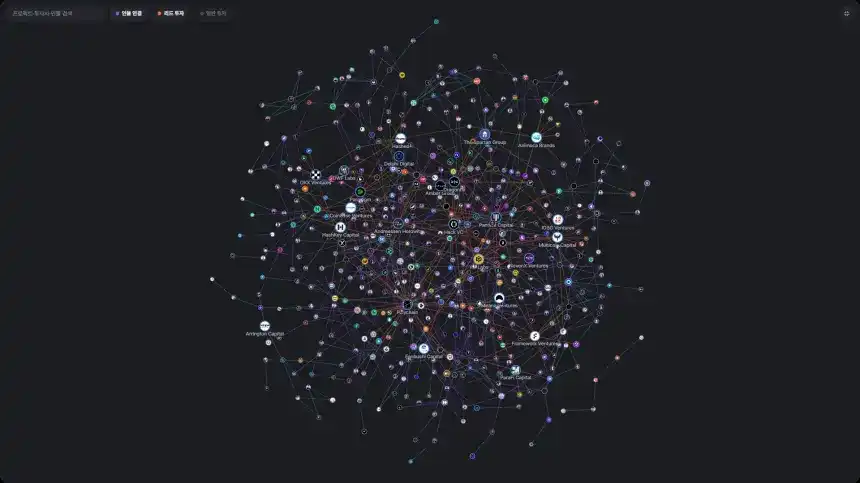
The cryptocurrency asset data platform "Token Watch," operated by Token Post, has unveiled an "Interactive Relationship Graph" feature that allows users to see the interconnected structure between projects, investors, and key figures at a glance.

This newly added relationship graph is a function that visually displays how investors and key individuals are connected, centering on cryptocurrency asset projects listed in the Korean won market. Users can not only check the investment background of a single project but also explore other projects participated in by the same investor and the past and present affiliations of individuals within the same screen.


Currently, the relationship graph shows the top 30 investors by portfolio and key figures confirmed across multiple projects. Users can directly search for projects, investors, or individuals, or filter by type to extract only the desired relationships.

The connecting lines are divided into ▲ General Investment ▲ Lead Investor ▲ Current Affiliation ▲ Past Affiliation. Through this classification, users can confirm not only which investors participated in a specific project but also who led the investment round, and the organizations with which key figures are currently or were previously associated.
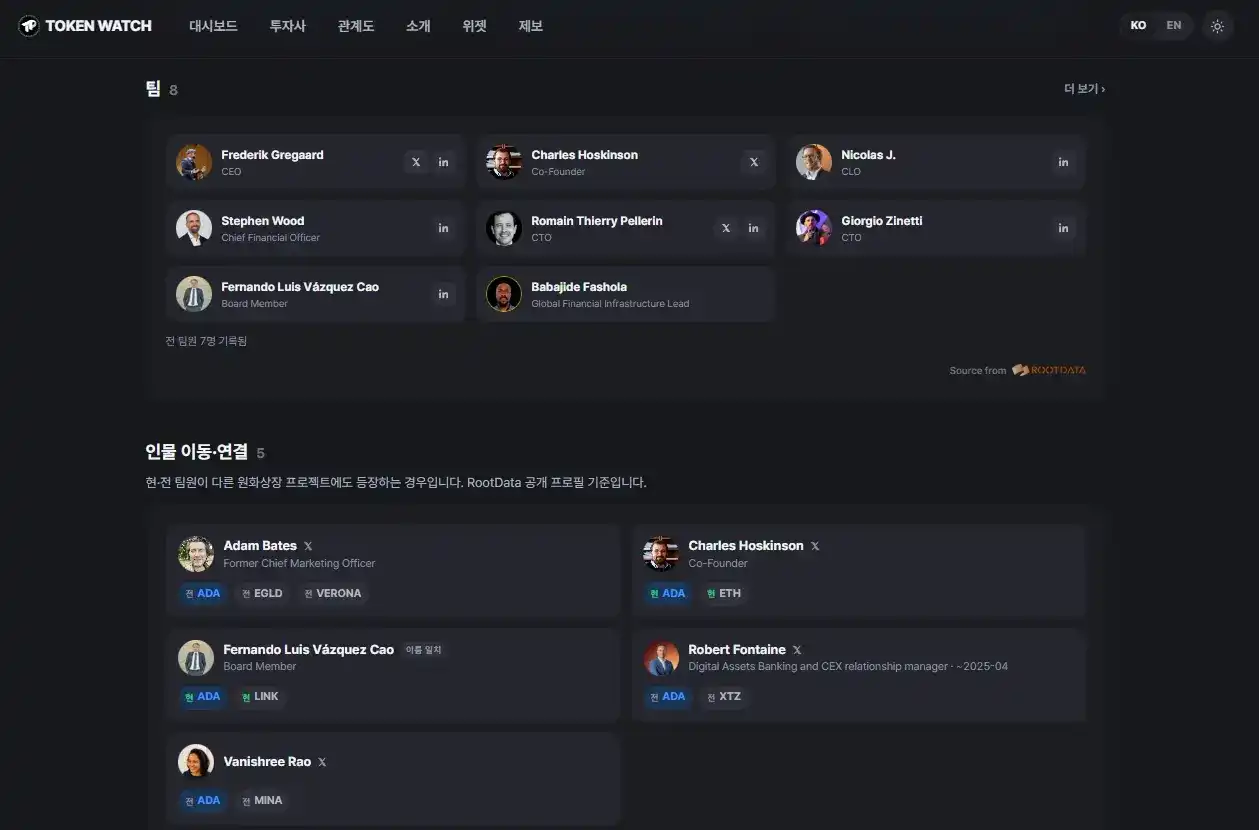
For example, selecting a specific project will display the investors in that project and related individuals. Conversely, with an investor as the center, users can view that investor's portfolio of Korean won-listed projects and co-investment relationships with other investors.

After clicking on a node, using the "View Centered on This Node" function allows users to keep only connections within two degrees of separation from the selected object. Even when the overall network appears complex, this enables quick focus on a specific project or investor, narrowing down to the core relationships. The feature also supports node dragging and screen zooming.

With this relationship graph, Token Watch moves beyond simple investor lists, allowing users to three-dimensionally explore the capital and human networks within the cryptocurrency asset market.


This feature can be used to grasp information that was difficult to confirm previously with just a project's published investor logos, such as:

  • Co-investors

  • Frequent VC co-investor combinations

  • Investor overlap between competing projects

  • Core individuals recurring across multiple projects

Particularly for investors, it can serve as a reference to verify the background of projects of interest; for journalists and researchers, it can be a tool for interviews and analysis to uncover hidden commonalities between projects; and for industry professionals and business developers, it can be used to examine connection paths between projects, investors, and key figures.
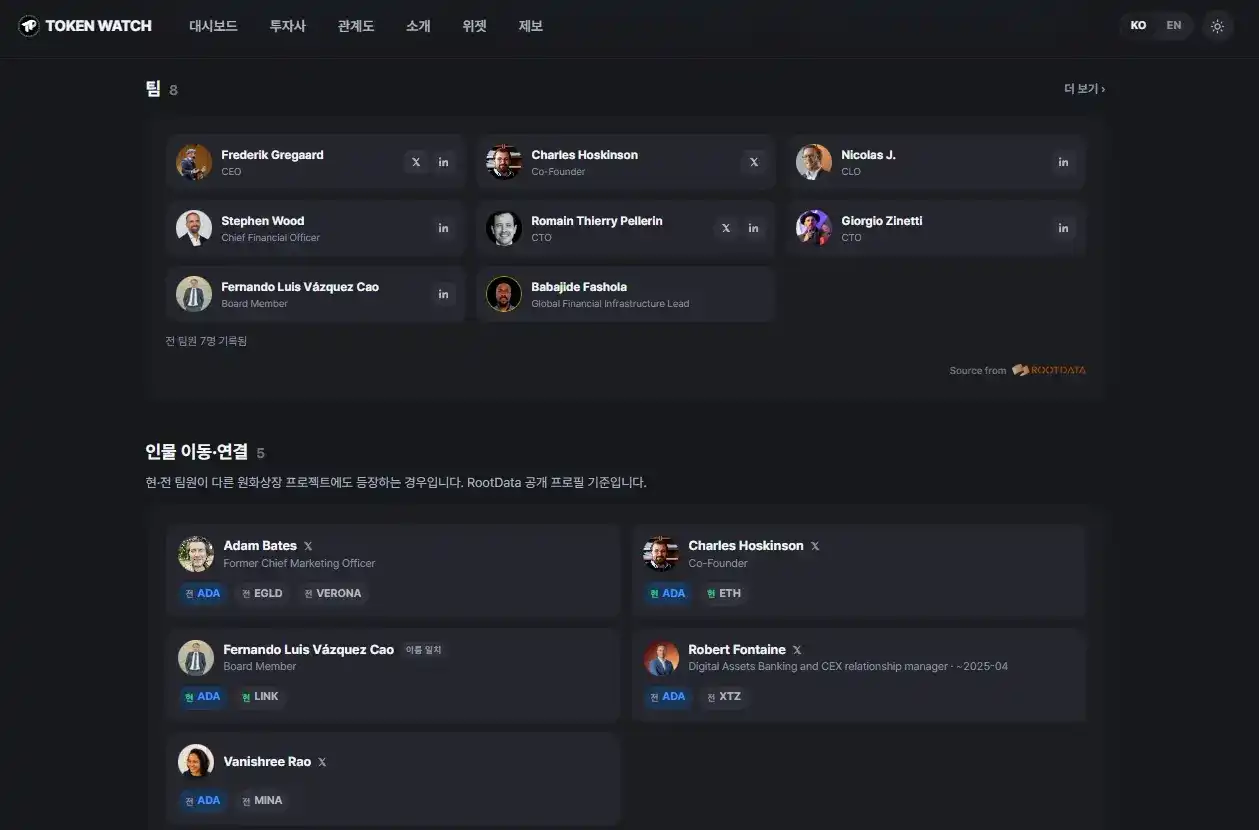
The investor and individual data used in the relationship graph is based on RootData, and some information (such as whether a project has responded) is based on records from the Token Post editorial department. Regarding individual relationships, to reduce erroneous connections of the same person, associations are made only when X account IDs match or two or more full names match.

The Token Watch relationship graph requires no additional installation and can be used directly on the web, supporting both Korean and English interfaces.

A representative from Token Post stated: "To understand a cryptocurrency asset project, one must not only look at price and listing information but also understand which capital and individuals are connected behind the project. We will continue to optimize the relationship graph so that dispersed investment and individual information can be explored intuitively."

Simultaneously, Token Watch states that the information displayed in the relationship graph may differ from the actual latest status due to variations in collection and verification timing. All data is for reference only and does not constitute investment advice.


This article is written based on market data and chart analysis and does not constitute investment advice for specific projects.

Kripto yang Sedang Tren

Pertanyaan Terkait

QWhat is the main function of the 'Interaction Relationship Map' feature launched by Token Watch?

AToken Watch launched an 'Interaction Relationship Map' feature that visually displays the interconnected structure between cryptocurrency projects, their investors, and key personnel. It allows users to see investment backgrounds, explore other projects funded by the same investor, and track the past and present affiliations of core individuals.

QWhat types of relationship lines are distinguished in the Token Watch Relationship Map?

AThe relationship lines in the map are categorized into four types: General Investment, Lead Investment, Current Affiliation, and Former Affiliation. This categorization helps users understand not only who invested in a project but also who led the investment round and the past/current organizational ties of key people.

QBased on which data provider is the investor and personnel information in the Relationship Map primarily built?

AThe investor and personnel data used in the Relationship Map is based on the data platform RootData. Additional information, such as whether a project has responded to inquiries, is based on records from the Token Post editorial team.

QWhat practical uses does the article list for the new Relationship Map feature?

AThe article lists several practical uses for the feature: identifying co-investors, spotting frequently co-investing VC combinations, observing investor overlap between competing projects, and recognizing key personnel who appear across multiple projects. It serves as a reference for investors, a research tool for journalists, and a way for professionals to explore connection paths.

QHow does the feature handle privacy and data accuracy according to the article?

ATo reduce incorrect links for individuals, connections are only made when X (formerly Twitter) accounts match or when two or more full names are identical. Token Watch also notes that the information may differ from the latest actual status due to collection and verification timing, and all data is for reference only, not constituting investment advice.

Bacaan Terkait

Prediksi Harga Cardano: Naik 800% atau Turun Lagi – Mana Analis yang Benar Pahami ADA?

Harga Cardano (ADA) diperdagangkan di $0,1643 pada 29 Juli, setelah memantul dari area kesenjangan nilai wajar (FVG) antara $0,1450 dan $0,1515. Pola segitiga yang terbentuk sejak pertengahan Juli telah ditembus ke bawah. Analisis teknis menunjukkan level resistensi terdekat di EMA 20-hari ($0,1654) dan EMA 50-hari ($0,1737). Sementara itu, level dukungan kunci berada di $0,1563 dan $0,1513. Dua pandangan analis yang bertentangan muncul: 1. **Cheeky Crypto** sangat optimis, menyebut harga saat ini sebagai kesempatan "masuk generasi" yang bisa menghasilkan keuntungan hingga 800%. Argumennya didasarkan pada akumulasi oleh pemilik dompet besar (paus) dan fundamental jaringan Cardano yang kuat. 2. **LuckSide Crypto** lebih berhati-hati, menyoroti faktor eksternal yang menekan harga: ketegangan geopolitik dengan Iran dan penundaan pemungutan suara **RUU CLARITY** di Senat AS, yang sangat dinantikan industri kripto. Di sisi fundamental, pasokan stablecoin di Cardano telah melonjak tiga kali lipat menjadi lebih dari $55 juta dalam setahun. Jaringan ini juga mengumumkan kemitraan baru dengan Reef Data. **Proyeksi Harga:** - **Skenario Positif:** Jika dukungan FVG bertahan, RUU CLARITY mendapatkan momentum, dan FOMC mempertahankan suku bunga, ADA bisa menguji ulang level EMA 20-hari dan 50-hari. - **Skenario Negatif:** Jika pemulihan gagal dan berita geopolitik atau regulasi buruk muncul, ADA berisiko turun menuju level dukungan $0,1563 hingga $0,1513.

cryptonews.ru16m yang lalu

Prediksi Harga Cardano: Naik 800% atau Turun Lagi – Mana Analis yang Benar Pahami ADA?

cryptonews.ru16m yang lalu

Prediksi Harga XRP: Apakah XRP Mendekati Titik Terendah Sejarah dengan Dibukanya Akses Retail di Hong Kong?

Harga XRP diperdagangkan di $1,0873 pada 29 Juli, berusaha memantul dalam pola *descending wedge* yang telah membatasi pergerakannya sejak puncak Mei. Indikator RSI bulanan mencapai level *oversold* paling ekstrem dalam sejarah aset ini, bahkan melebihi level saat krisis COVID-19 tahun 2020. XRP telah turun 72% dari rekor tertingginya. Secara teknis, tren masih bearish dengan resistensi langsung di EMA 20-hari ($1,0983) dan SuperTrend ($1,1621). Dukungan kunci berada di sekitar $1,05 dan level psikologis $1,00. Sementara itu, analisis derivatif menunjukkan posisi long dan short ritel hampir seimbang, mengindikasikan hati-hati sebelum keputusan FOMC. Di tengah tekanan harga, muncul perkembangan fundamental positif: OSL Hong Kong menjadi bursa pertama di wilayah itu yang membuka perdagangan ritel untuk XRP, menempatkannya bersama BTC, ETH, dan SOL sebagai aset kripto yang disetujui untuk investor ritel di platform tersebut. Penyelesaian transaksi dilakukan langsung melalui XRP Ledger. Aliran spot bersih XRP juga menunjukkan pola *outflow* yang konsisten dari bursa pada Juli, yang secara historis dapat dianggap sebagai sinyal akumulasi tersembunyi di balik penurunan harga. **Proyeksi Harga:** * **Skenario Naik:** Breakout di atas garis tren wedge ($1,10), didorong oleh akumulasi karena RSI ekstrem dan permintaan baru dari akses ritel di Hong Kong, menuju target resistensi di $1,1315 (EMA 50-hari) dan $1,1621 (SuperTrend). * **Skenario Turun:** Penolakan harga di garis tren wedge dan keruntuhan di bawah support $1,05, menuju pengujian ulang level $1,00, jika tidak ada katalis pemulihan yang muncul.

cryptonews.ru20m yang lalu

Prediksi Harga XRP: Apakah XRP Mendekati Titik Terendah Sejarah dengan Dibukanya Akses Retail di Hong Kong?

cryptonews.ru20m yang lalu

Trading

Spot

Artikel Populer

Cara Membeli DATA

Selamat datang di HTX.com! Kami telah membuat pembelian DATA Network (DATA) menjadi mudah dan nyaman. Ikuti panduan langkah demi langkah kami untuk memulai perjalanan kripto Anda.Langkah 1: Buat Akun HTX AndaGunakan alamat email atau nomor ponsel Anda untuk mendaftar akun gratis di HTX. Rasakan perjalanan pendaftaran yang mudah dan buka semua fitur.Dapatkan Akun SayaLangkah 2: Buka Beli Kripto, lalu Pilih Metode Pembayaran AndaKartu Kredit/Debit: Gunakan Visa atau Mastercard Anda untuk membeli DATA Network (DATA) secara instan.Saldo: Gunakan dana dari saldo akun HTX Anda untuk melakukan trading dengan lancar.Pihak Ketiga: Kami telah menambahkan metode pembayaran populer seperti Google Pay dan Apple Pay untuk meningkatkan kenyamanan.P2P: Lakukan trading langsung dengan pengguna lain di HTX.Over-the-Counter (OTC): Kami menawarkan layanan yang dibuat khusus dan kurs yang kompetitif bagi para trader.Langkah 3: Simpan DATA Network (DATA) AndaSetelah melakukan pembelian, simpan DATA Network (DATA) di akun HTX Anda. Selain itu, Anda dapat mengirimkannya ke tempat lain melalui transfer blockchain atau menggunakannya untuk memperdagangkan mata uang kripto lainnya.Langkah 4: Lakukan trading DATA Network (DATA)Lakukan trading DATA Network (DATA) dengan mudah di pasar spot HTX. Cukup akses akun Anda, pilih pasangan perdagangan, jalankan trading, lalu pantau secara real-time. Kami menawarkan pengalaman yang ramah pengguna baik untuk pemula maupun trader berpengalaman.

124 Total TayanganDipublikasikan pada 2026.07.01Diperbarui pada 2026.07.01

Cara Membeli DATA

Diskusi

Selamat datang di Komunitas HTX. Di sini, Anda bisa terus mendapatkan informasi terbaru tentang perkembangan platform terkini dan mendapatkan akses ke wawasan pasar profesional. Pendapat pengguna mengenai harga DATA (DATA) disajikan di bawah ini.

活动图片