Monad eyes all-time high: Accumulation surges as MON bulls test key resistance

ambcryptoDipublikasikan tanggal 2026-04-09Terakhir diperbarui pada 2026-04-09

Abstrak

Monad (MON) has surged 13% in 24 hours, emerging as a top market performer. The rally is supported by strong accumulation, with the Accumulation/Distribution indicator and Money Flow Index (MFI) both trending upward, indicating sustained buying pressure and capital inflows. However, the price faces a key resistance zone, and the Bollinger Bands suggest MON is overbought, signaling potential for a short-term pullback. Breaking this resistance is crucial for a sustained upward move toward its all-time high, which would require a 56% increase and an additional $851 million in market capitalization. This depends on continued bullish sentiment across spot and futures markets, as well as broader crypto market stability.

Monad [MON] could rank among the market’s top gainers if bullish strength persists, especially as the asset posts a 13% gain over the past day, placing it among the leading performers in the crypto market over the last 24 hours.

However, the rally still faces a major obstacle, as price trades within a resistance block expected to cap further upside. The key question is whether Monad can break above this level and open a path toward its all-time high.

Monad rallies on the back of accumulation

The recent surge in accumulation has supported MON’s upward momentum, and current indicators suggest that this trend may not slow down soon.

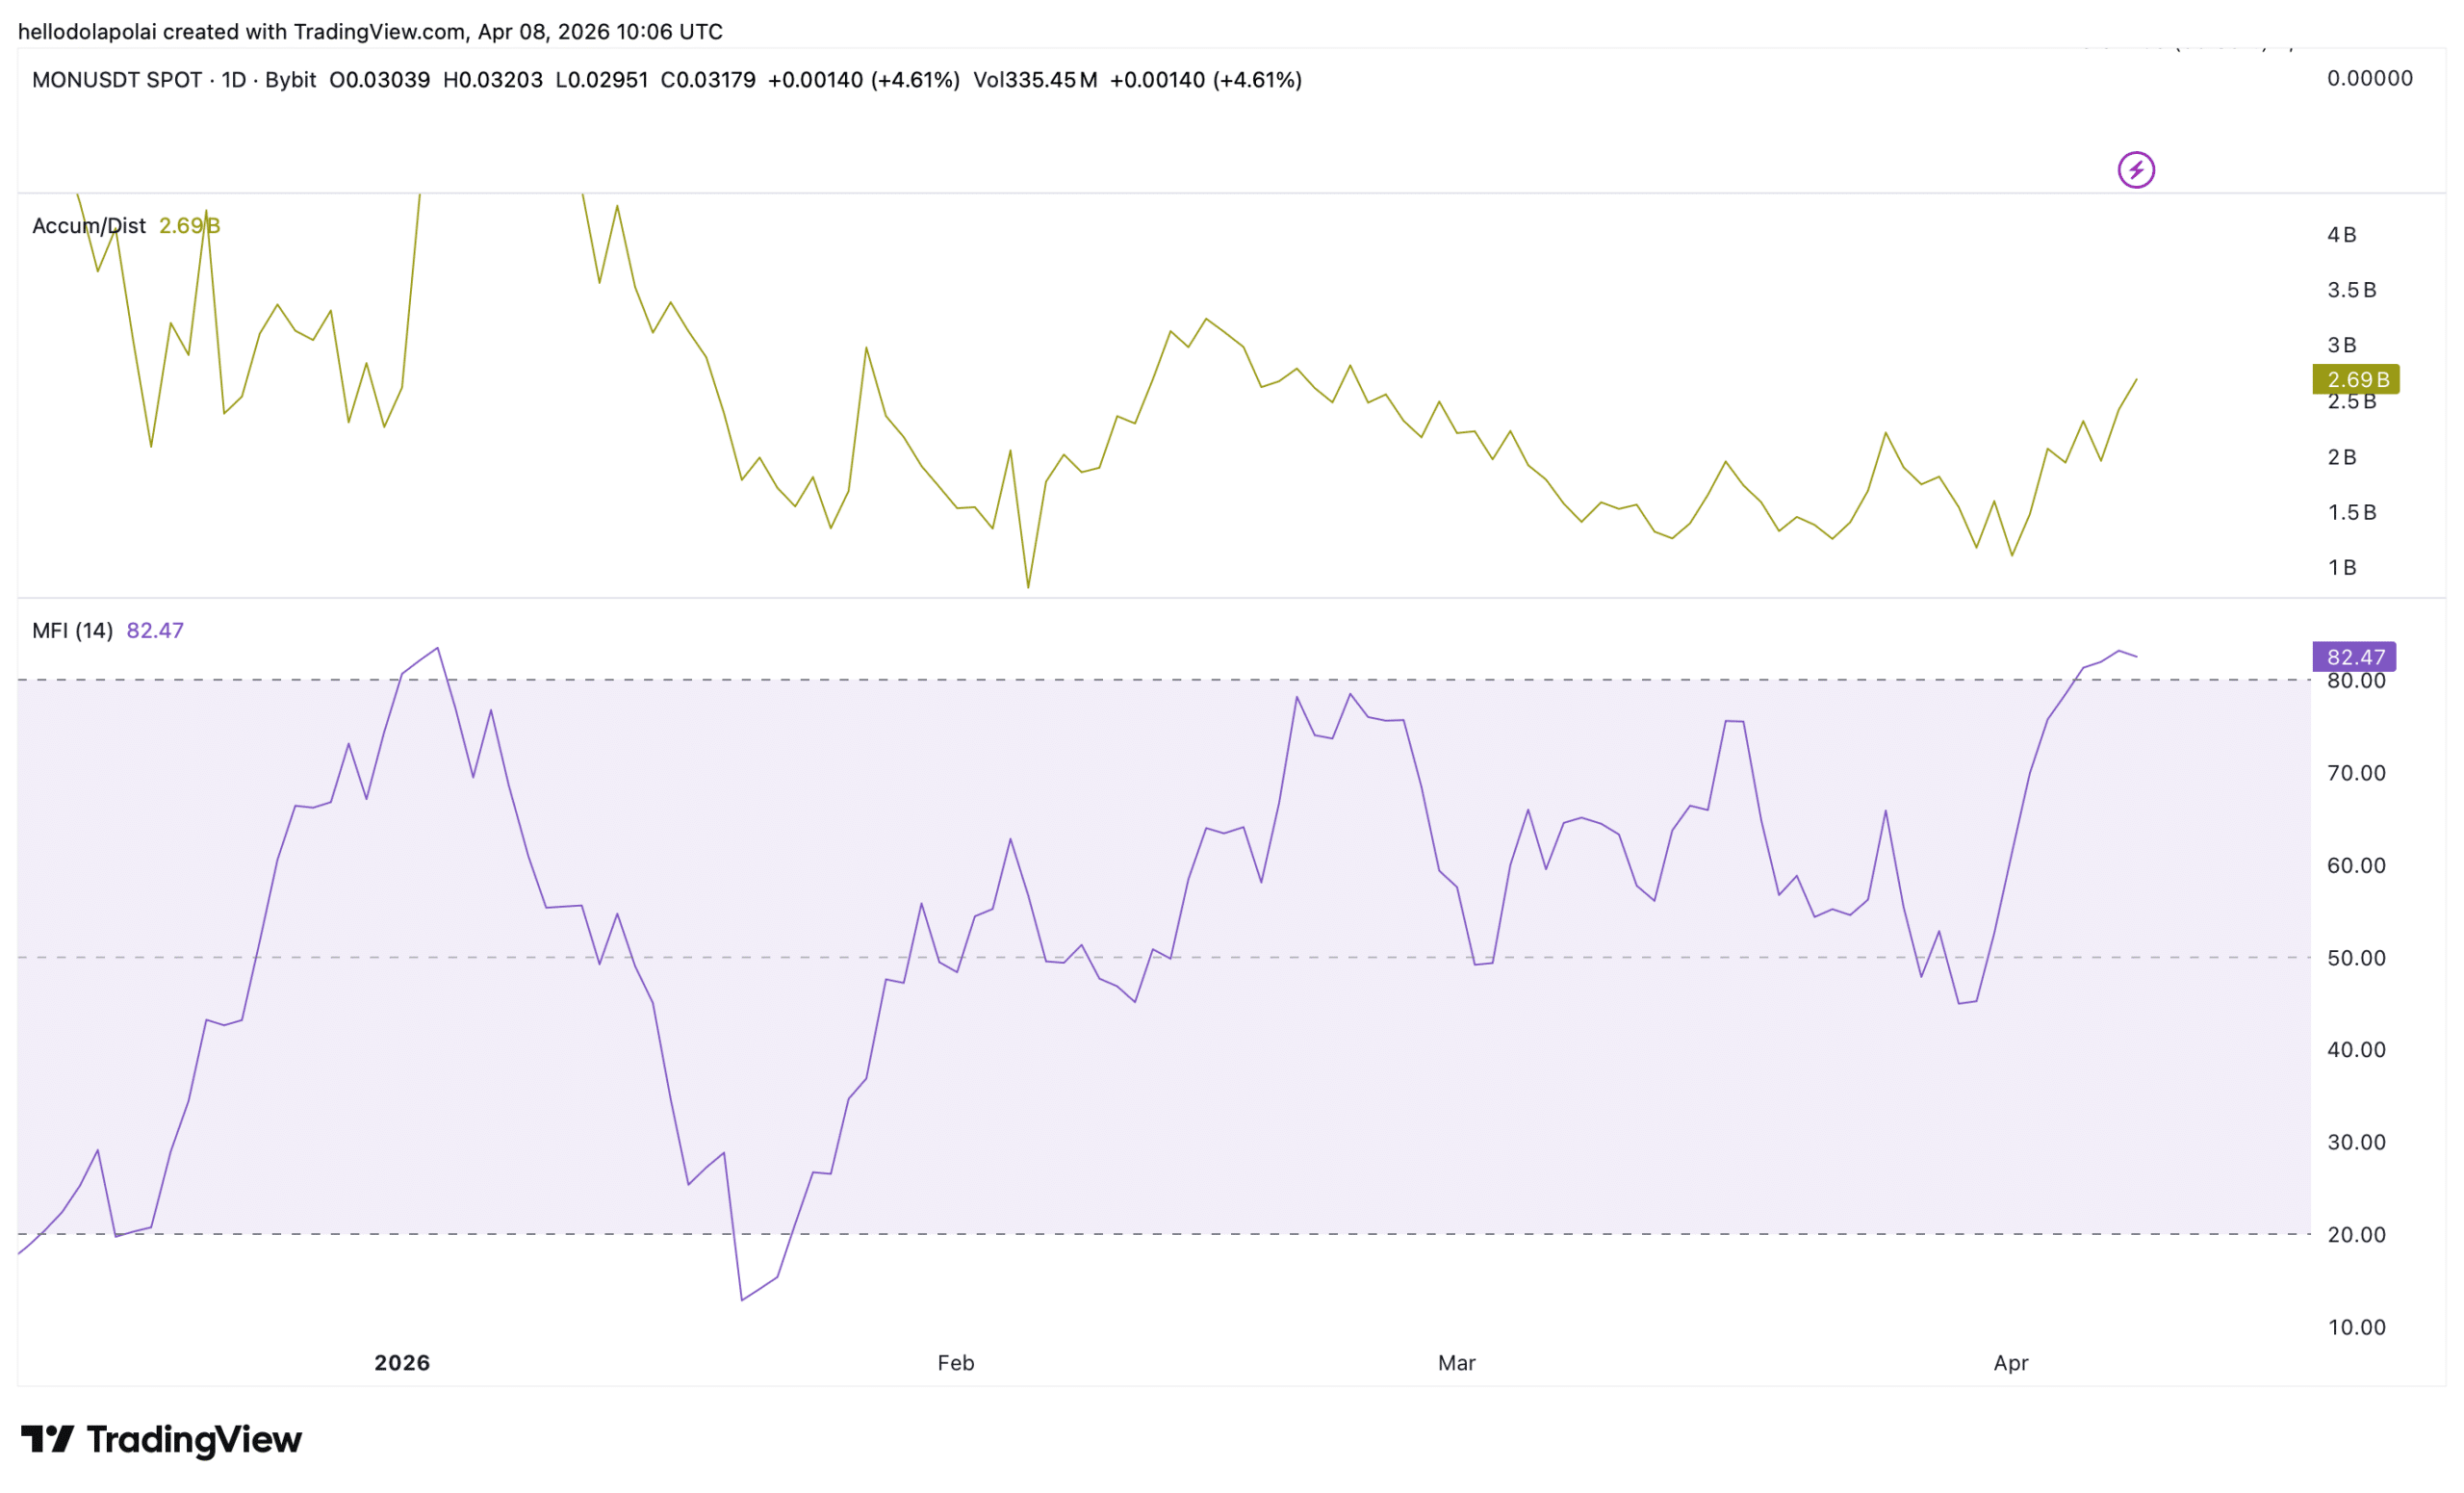
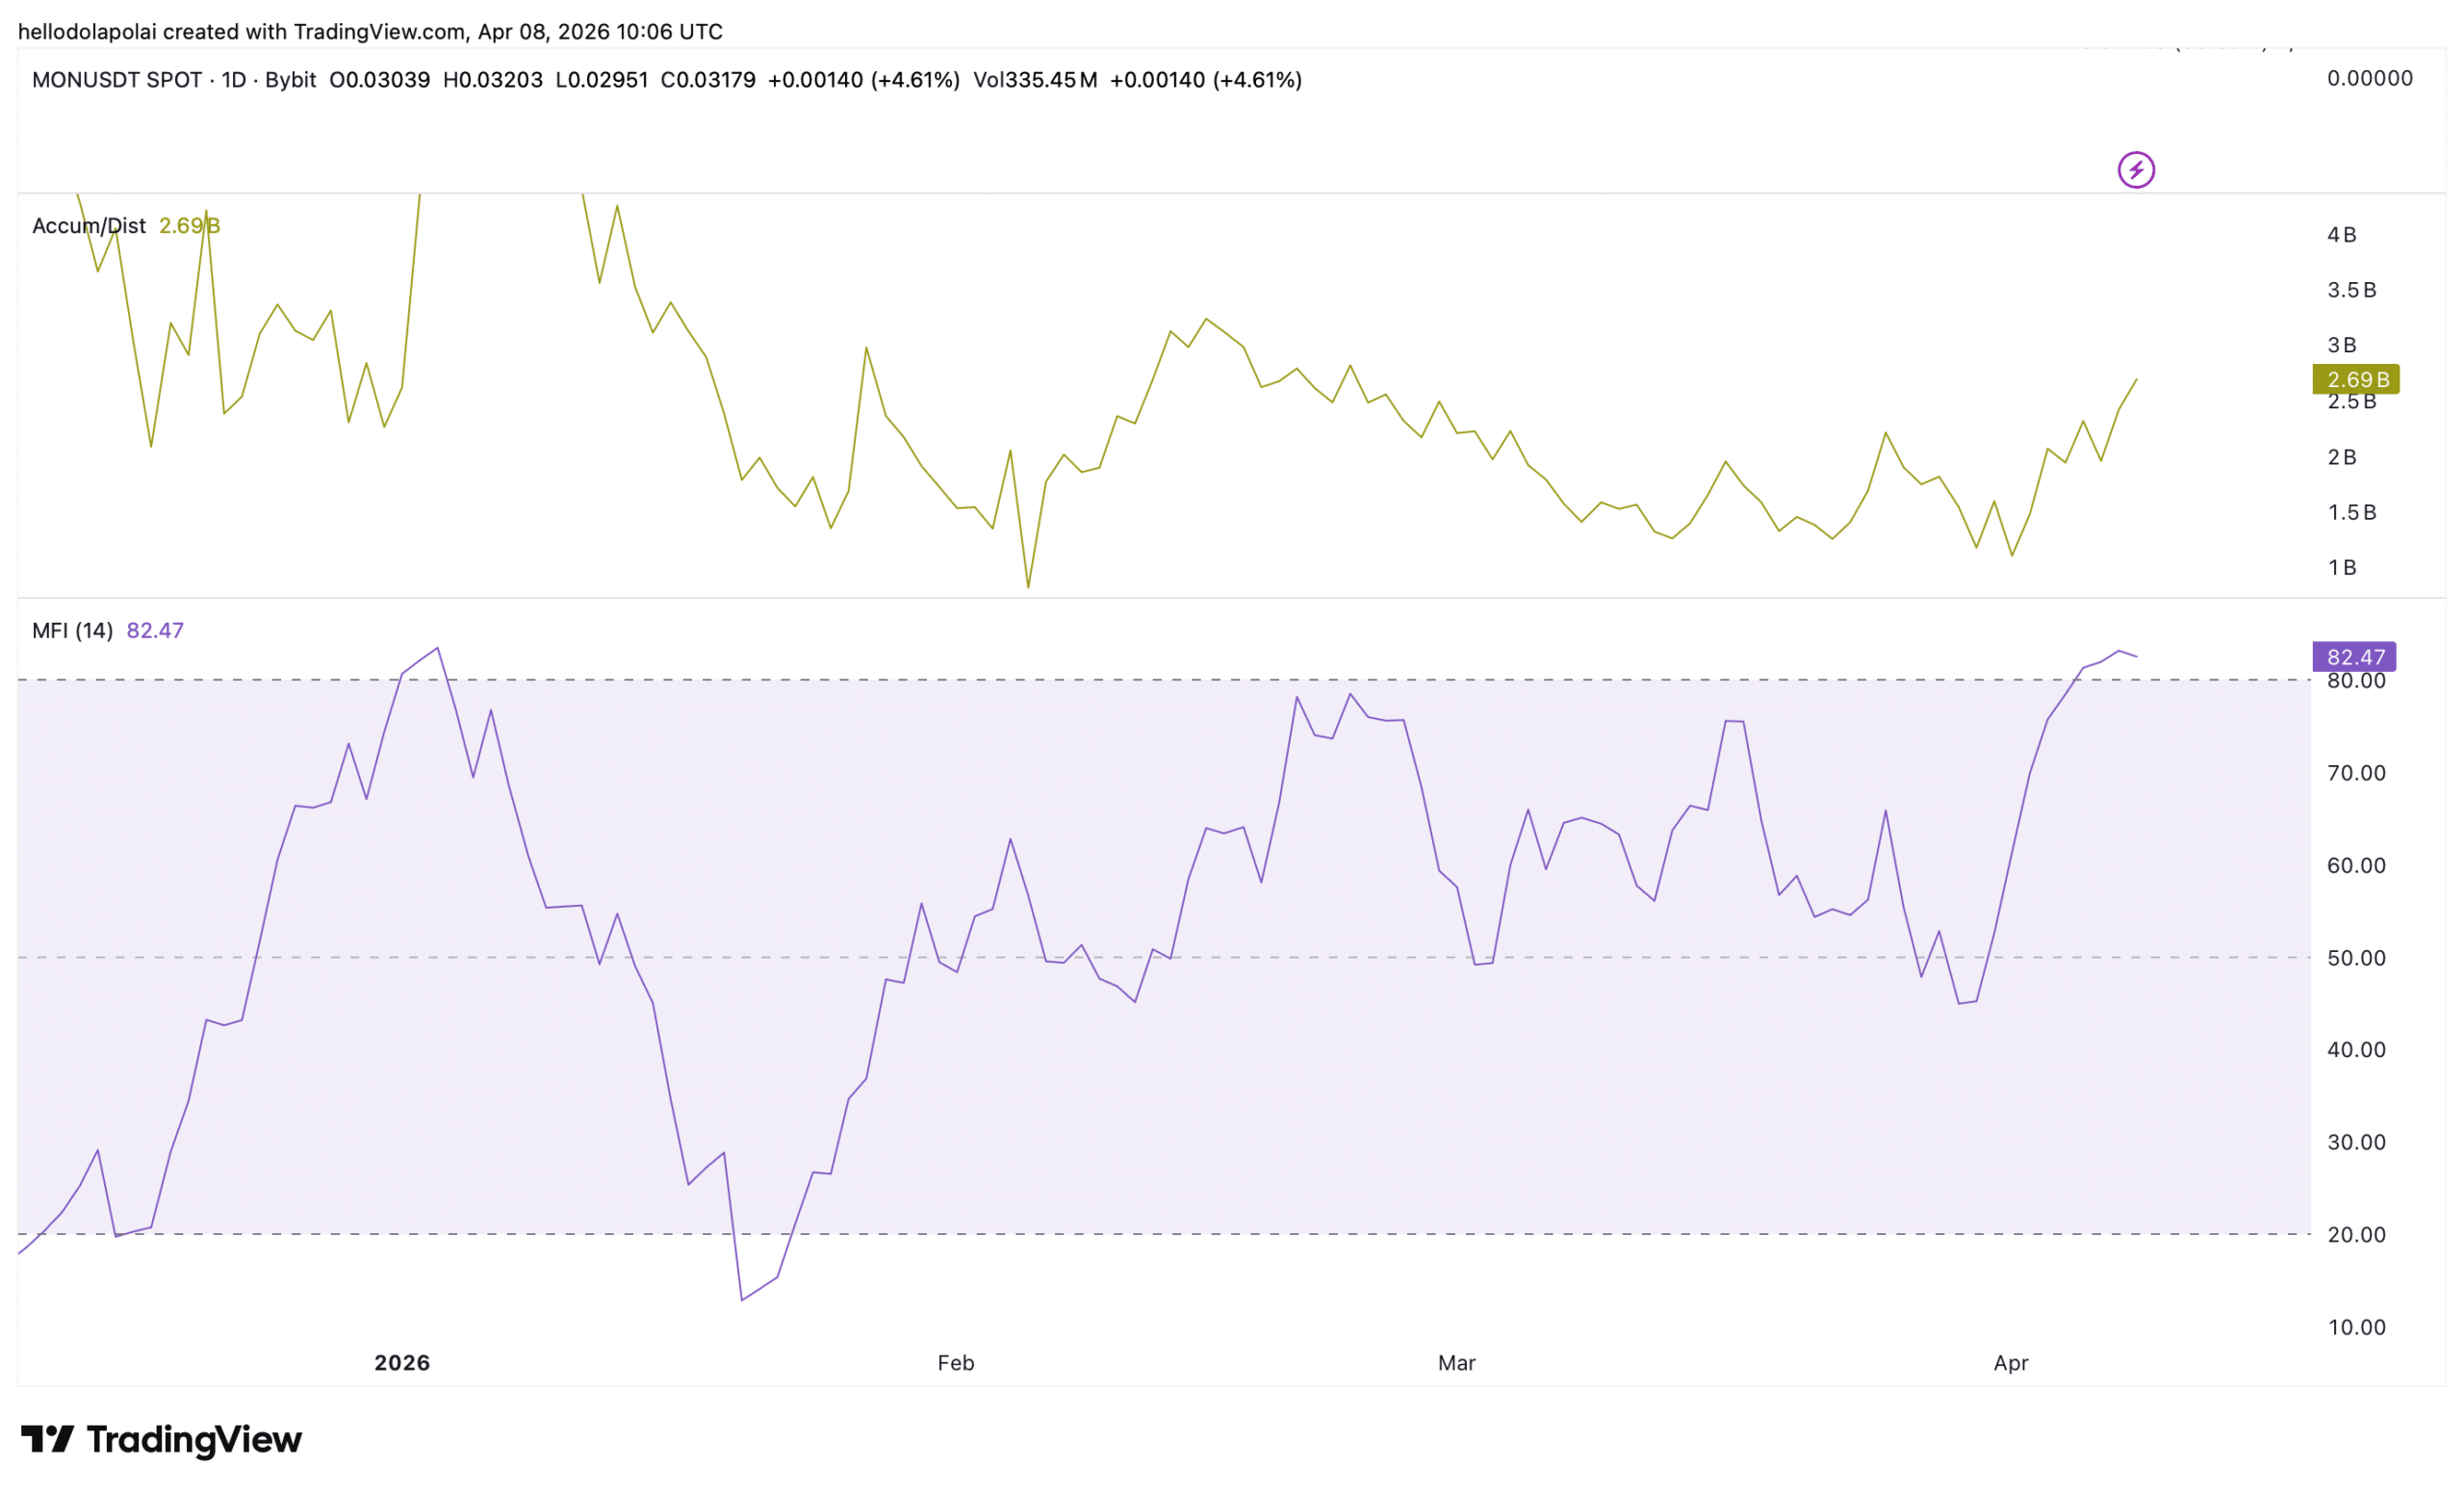
The Accumulation/Distribution indicator continues to trend higher, showing that as price increases, investors keep buying. Trading volume has also strengthened, exceeding 2.69 billion over the past day.

Accumulation tells only part of the story. The Money Flow Index (MFI), which tracks capital inflow and outflow, also indicates stronger inflows over the same period.
Source: TradingView

The MFI remains slightly above the 80 level and trends upward, suggesting that investors are positioning for further upside gains.

While this outlook remains bullish, market volatility requires close attention, as sentiment can shift quickly, particularly with the broader market still in a bearish phase.

Warning signs emerge

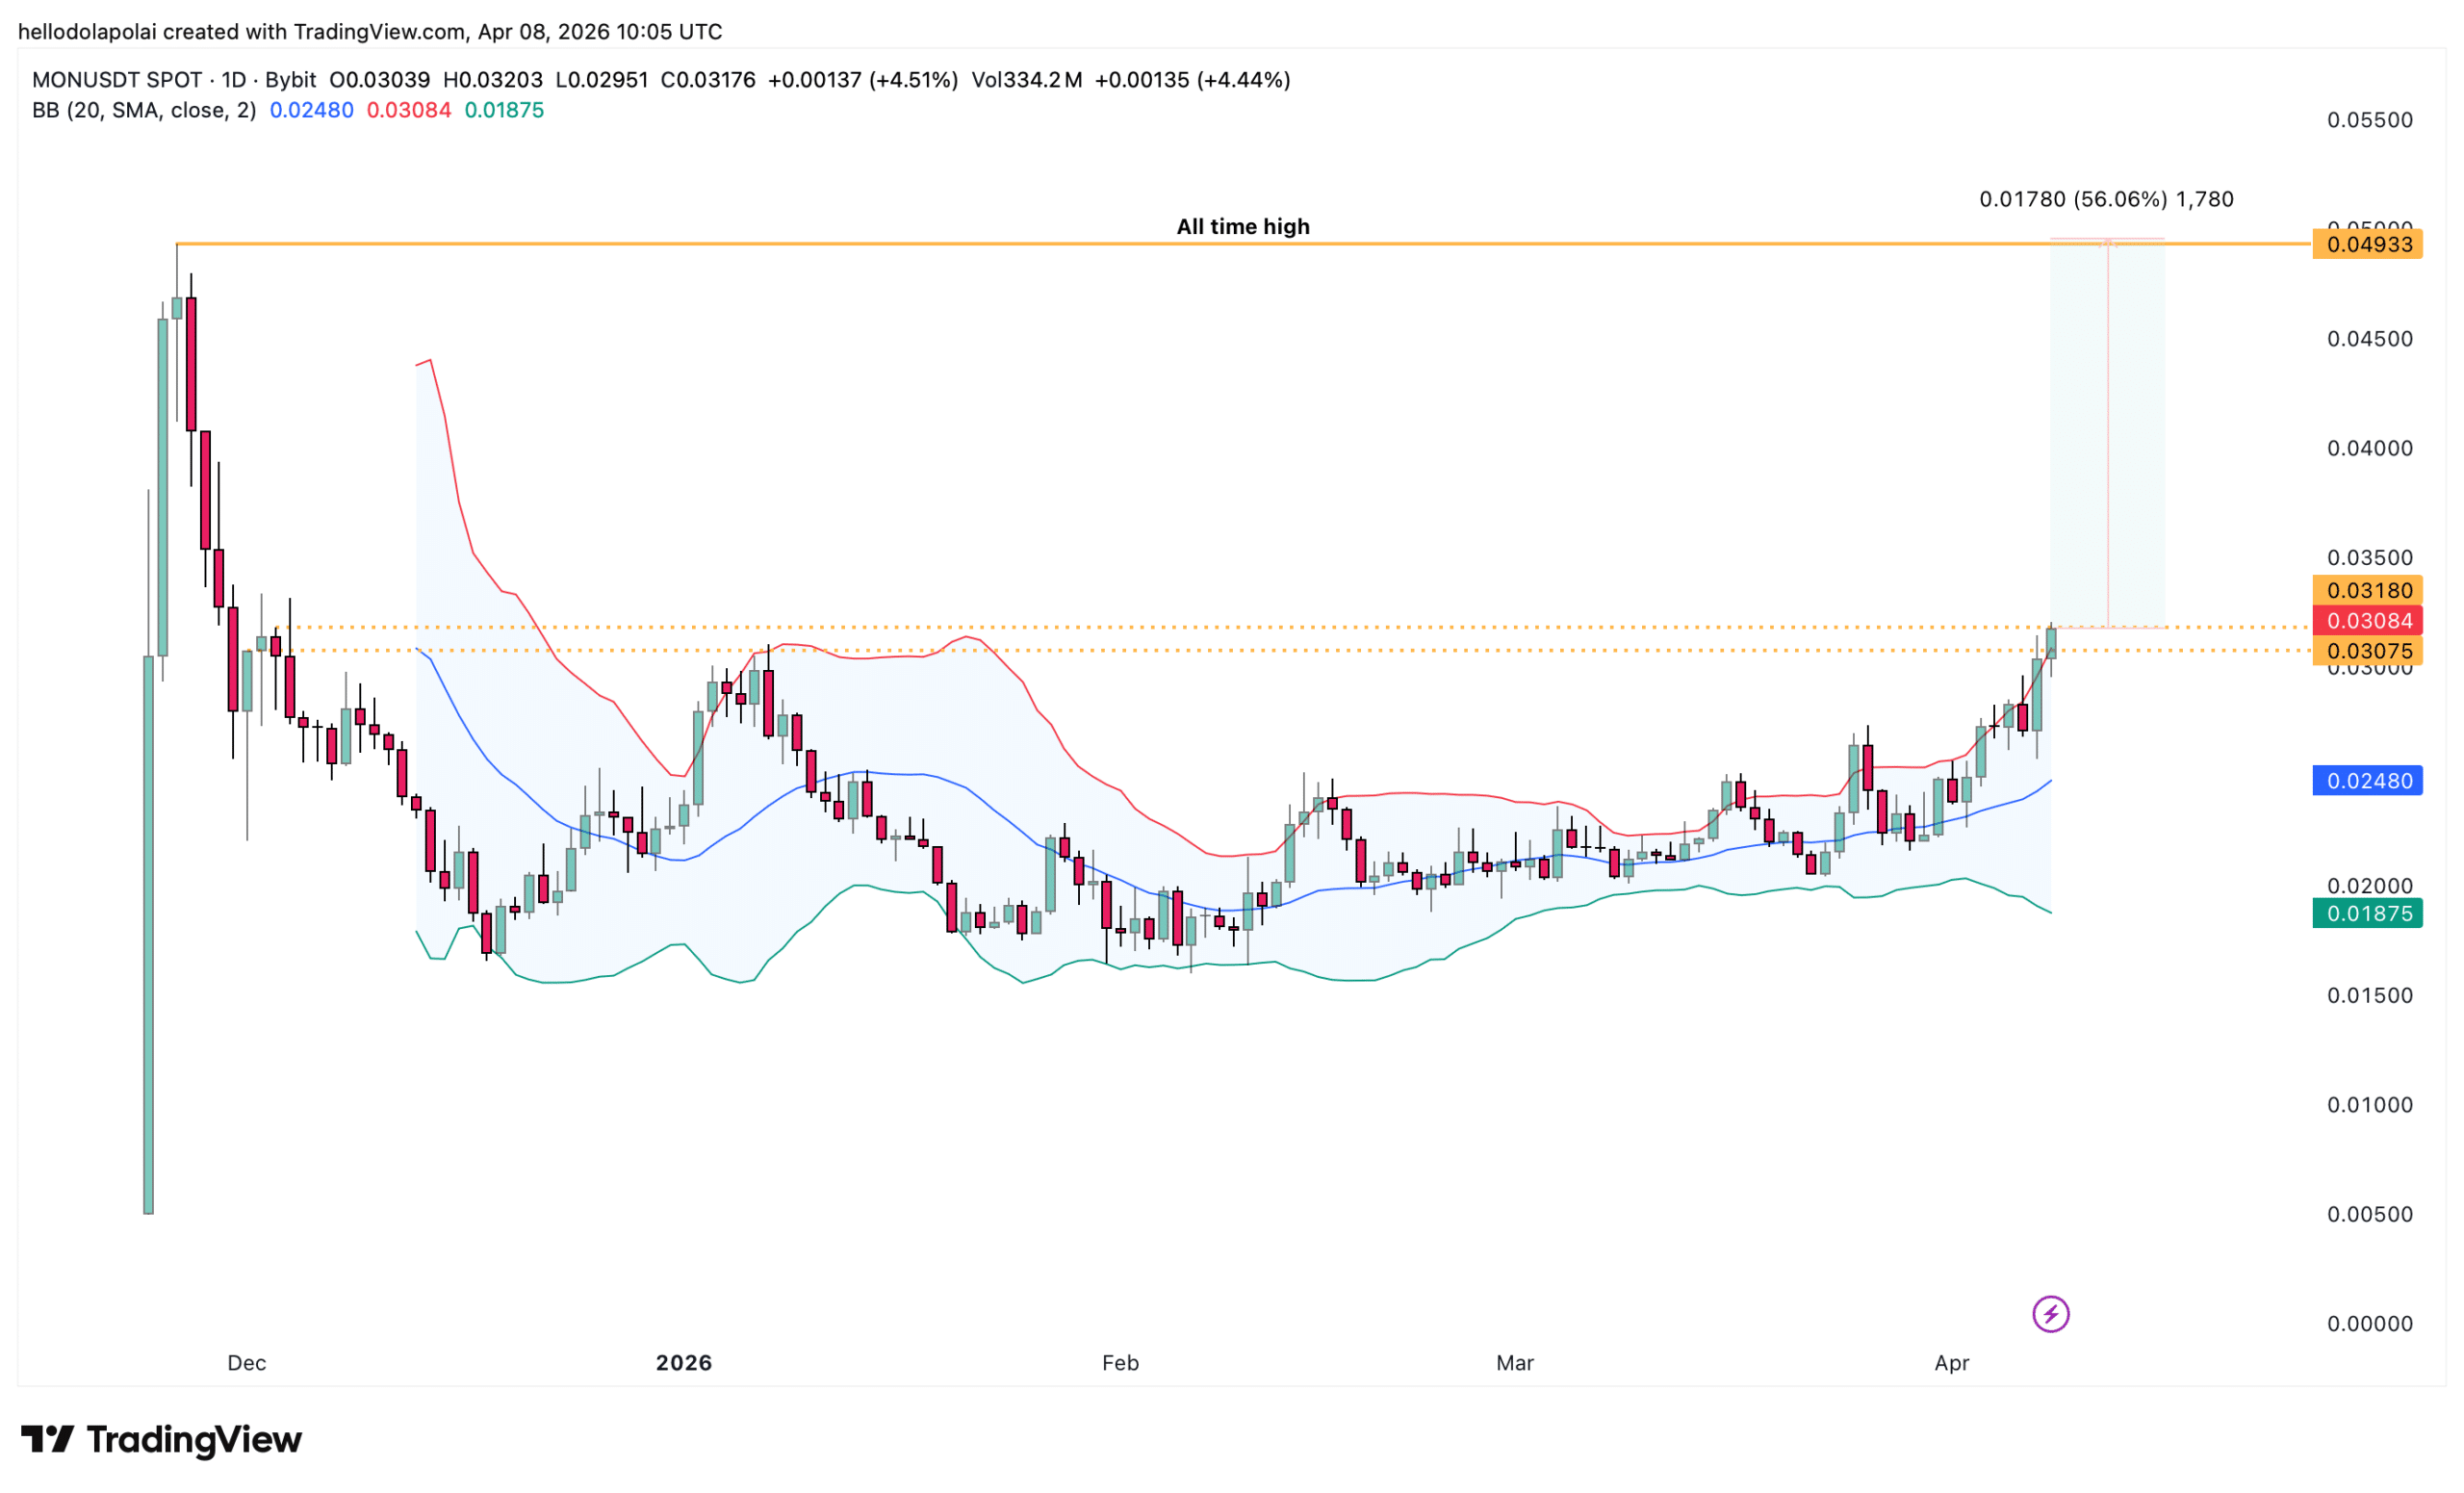
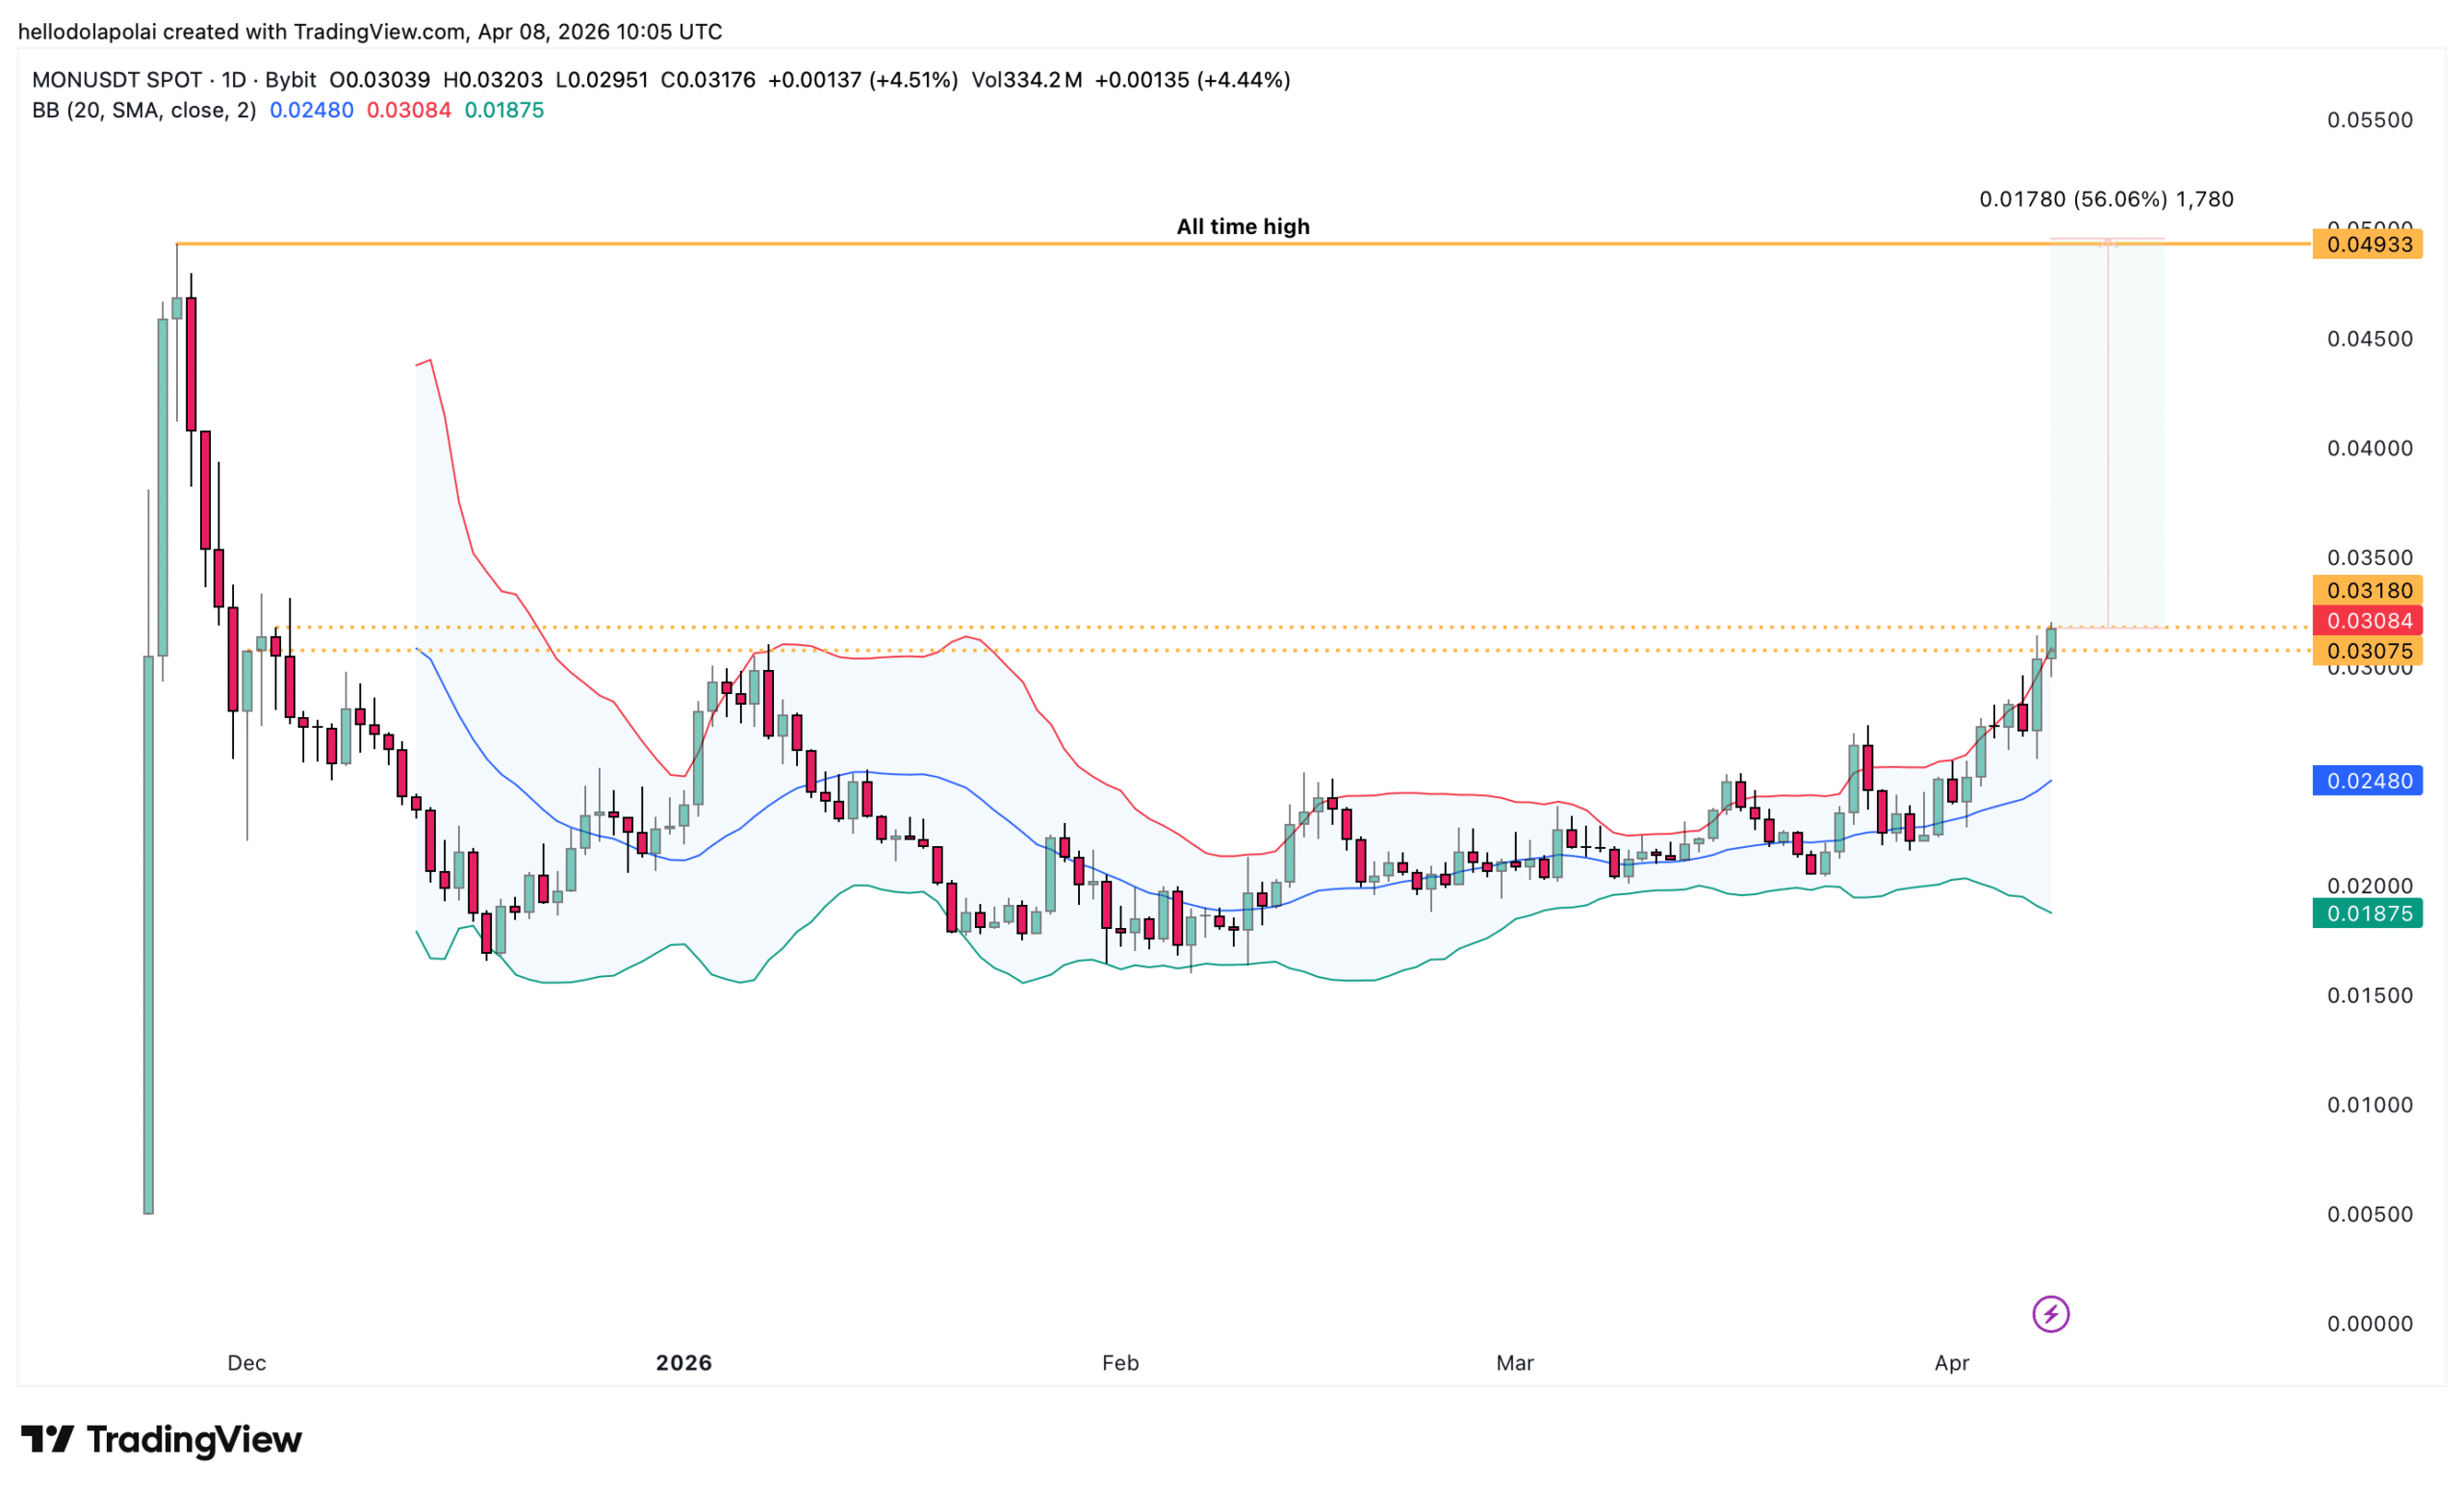
Bullish positioning comes with caution. The Bollinger Bands indicator, which measures whether an asset is overbought or oversold, shows that MON has entered the overbought region.

This level, marked by the upper band, suggests that buying pressure could weaken, potentially leading to a pullback toward lower levels, though not necessarily an immediate reversal.
Source: TradingView

This aligns with the resistance zone on the chart, which could act as a strong barrier and push prices lower. In that scenario, MON could form lower lows or continue to range, with the latter more likely if accumulation continues to build.

On the other hand, a breakout would significantly strengthen MON’s structure. Price would face less resistance on the path higher, as fewer supply zones remain overhead.

Is an all-time high likely?

A move toward a new all-time high depends on several factors, with capital inflow remaining the most critical.

A rally from the current level to the all-time high represents roughly a 56% increase. With a market capitalization of $1.52 billion, this would require an additional $851 million, pushing total valuation toward $2.37 billion.

For this to materialize, bullish sentiment must align across multiple fronts. Spot market accumulation must remain strong, perpetual Futures should continue to support long positioning, and broader crypto market sentiment must either turn bullish or stabilize.

At present, short-term data from both perpetual and Spot markets suggests that bulls remain in control. Over the past 10 days, MON’s perpetual flows reached $12.88 million, while Spot market inflows held at $7.31 million over the past five days, according to CoinGlass.


Final Summary

  • MON extends its run as accumulation surges again, while capital inflow into the market continues to rise.
  • A key resistance obstacle remains the critical level to watch in determining whether MON can sustain a major price rally.


Pertanyaan Terkait

QWhat is the main obstacle Monad (MON) faces in its current rally according to the article?

AThe main obstacle is a key resistance block that is expected to cap further upside and could potentially push prices lower if not broken.

QWhich two indicators are highlighted as showing strong investor accumulation and capital inflow for MON?

AThe Accumulation/Distribution indicator and the Money Flow Index (MFI) both indicate strong accumulation and capital inflows.

QWhat does the Bollinger Bands indicator suggest about MON's current price level?

AThe Bollinger Bands indicator shows that the asset has entered the overbought region, suggesting buying pressure could weaken and a pullback is possible.

QHow much of a price increase is required for MON to reach a new all-time high from its current level?

AA rally from the current level to the all-time high would represent roughly a 56% increase.

QWhat are the three factors that must align for MON to achieve a new all-time high?

ASpot market accumulation must remain strong, perpetual Futures should continue to support long positioning, and broader crypto market sentiment must either turn bullish or stabilize.

Bacaan Terkait

Kenaikan 25% dalam Seminggu: Bitcoin Tembus Level $79.000 di Tengah Likuidasi Besar-Besaran Posisi Short

Bitcoin melampaui level $79.000 pada 21 Agustus, dengan kenaikan mingguan mencapai 25%. Lonjakan ini disertai likuidasi besar-besaran posisi short, lebih dari $1,2 miliar dalam 24 jam terakhir. Beberapa analis memberikan pandangan teknis: * **Crypto Candy** mencatat BTC dengan cepat mencapai target $70.700 dan $75.000. Ia memperkirakan kemungkinan koreksi jangka pendek, tetapi jika momentum bertahan, pergerakan menuju $77.000 dan kemudian $83.000 dimungkinkan selama harga tetap di atas $70.000. * **Trader Roman** mengkonfirmasi prediksinya tentang pergerakan ke $75.000, berdasarkan pola bullish. Ia juga memperkirakan koreksi kecil meski tren naik telah berlangsung lebih dari sepuluh bulan. * **Daan Crypto Trades** menyoroti upaya Bitcoin untuk bertahan di atas zona support pasar bullish dan EMA 200 mingguan. Ia menekankan pentingnya level $73.000-$74.000; penutupan mingguan di atas level ini akan menjadi sinyal positif untuk menuju tinggi Mei. Analisis AI memperingatkan bahwa lonjakan serupa pada Agustus tahun lalu diikuti oleh penurunan hampir 20%. Lonjakan tajam yang didorong oleh likuidasi sering kali bersifat sementara dan tidak selalu mencerminkan permintaan spot yang berkelanjutan. Para analis sepakat bahwa zona kunci untuk dikawasi adalah $73.000-$74.000, dengan target potensial selanjutnya di kisaran $80.000-$83.000, sambil mengakui kemungkinan koreksi jangka pendek.

cryptonews.ru23m yang lalu

Kenaikan 25% dalam Seminggu: Bitcoin Tembus Level $79.000 di Tengah Likuidasi Besar-Besaran Posisi Short

cryptonews.ru23m yang lalu

Tokenisasi RWA Masuk Tahap Selanjutnya: Keunggulan Apa yang Benar-Benar Membutuhkan Waktu untuk Dibangun?

Kerangka penerbitan tokenisasi aset dunia nyata (RWA) semakin matang, membuat proses penerbitan menjadi lebih cepat. Namun, ketika penerbitan sendiri bukan lagi hambatan utama, pertanyaan krusial muncul: apa yang terjadi *setelah* aset diterbitkan? Keunggulan kompetitif jangka panjang tidak lagi hanya terletak pada "aset apa yang diterbitkan," tetapi pada sistem operasi yang dibangun di sekitarnya dan kemampuannya bertahan melalui berbagai kondisi pasar. Industri keuangan *on-chain* memerlukan lapisan cadangan (*Reserve Layer*) yang terdiri dari aset-aset berkualitas tinggi seperti obligasi pemerintah AS jangka pendek, emas, dan perak fisik. Aset-aset ini memiliki pasar yang dalam, harga yang dapat diamati, dan standar yang diakui, membuatnya cocok sebagai aset cadangan. Sebaliknya, aset seperti kredit privat (*private credit*) lebih kompleks dan kurang memenuhi syarat sebagai cadangan karena heterogenitas dan kesulitan penilaiannya. Keunggulan sejati yang sulit direplikasi dalam RWA adalah catatan operasional jangka panjang yang terakumulasi melalui operasi yang berkelanjutan. Ini mencakup audit independen yang rutin, mekanisme penebusan yang terbukti, manajemen likuiditas, dan integrasi yang andal dengan berbagai ekosistem *DeFi*. Setiap operasi yang berhasil menambah bukti dan membangun kepercayaan pasar, menciptakan siklus penguatan: operasi berkelanjutan → akumulasi bukti → catatan operasional yang lebih kuat → integrasi yang lebih luas → utilitas yang lebih besar. Keberlanjutan jangka panjang RWA bergantung pada dua dimensi: kesesuaian aset dasar sebagai cadangan dan kemampuan operasional penerbit. Kombinasi aset cadangan berkualitas tinggi (seperti emas) dengan catatan operasional penerbit yang masih terbatas justru bisa menjadi titik perhatian, karena keandalan infrastruktur pendukung (seperti audit, penebusan, kepatuhan) baru teruji sepenuhnya dalam kondisi pasar yang menantang. Kesimpulannya, sepuluh tahun mendatang, bisnis RWA yang akan tetap dipercaya dan terintegrasi adalah mereka yang tidak hanya memilih aset cadangan berkualitas tinggi tetapi juga mampu membuktikan disiplin operasional jangka panjang melalui eksekusi yang konsisten, mengubah aset dunia nyata menjadi infrastruktur keuangan *on-chain* yang tepercaya.

marsbit38m yang lalu

Tokenisasi RWA Masuk Tahap Selanjutnya: Keunggulan Apa yang Benar-Benar Membutuhkan Waktu untuk Dibangun?

marsbit38m yang lalu

Trading

Spot
活动图片