Bitcoin Price Falters: Why Has The 5th Wave Been Elusive Below $100,000?

bitcoinistDipublikasikan tanggal 2025-04-28Terakhir diperbarui pada 2025-04-28

Abstrak

Bitcoin’s recent surge above $94,000 has brought a wave of bullish momentum across the crypto market. However, this rally has...

Trusted Editorial content, reviewed by leading industry experts and seasoned editors. Ad Disclosure

Bitcoin’s recent surge above $94,000 has brought a wave of bullish momentum across the crypto market. However, this rally has yet to gain real traction beyond $95,000. This elusive behavior is part of a wider trend that has seen the anticipated Bitcoin’s 5th wave breakout above $100,000 remain elusive.

Bitcoin’s 5th Wave Appears To Be Stretching

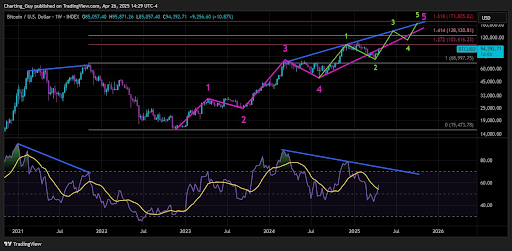
The weekly Bitcoin chart highlights a classic impulsive sequence following Elliott Wave Theory, but it is becoming increasingly clear that the 5th wave has not unfolded in a straight line. As shown in the chart below, Bitcoin entered into a 5th wave formation in the middle of 2024, right when it began its initial rally towards the $100,000 level. This 5th wave formation is the last of a series of Elliott waves that goes back as far as late 2022. 

However, the structure points toward an extended 5th wave, a phenomenon where the final upward leg stretches longer than typical, and is filled with its own sub-impulse waves. This has caused the BTC price to continue trading below $100,000.

Interestingly, Bitcoin is currently playing out its 3rd sub-impulse wave. If this extended wave plays out fully, it could line up with the traditional four-year Bitcoin cycle with a peak above $170,000. According to a crypto analyst that goes by the pseudonymous name Charting Guy on social media platform X, this could lead to major altcoin rallies in its latter stages.
Bitoin
Source: Charting Guy on X

Multiple Price Targets Offer Clues About BTC’s Path Forward

Aside from the extended 5th wave scenario, the analyst laid out other projections for Bitcoin. The $95,000 price level has been met as a target for a relief rally with Bitcoin’s latest breakout. However, surpassing this level is going to be important in maintaining bullish momentum.

The next targets outlined by the analyst include a potential double top forming around $109,000 and a bullish Fibonacci extension move toward $128,000, corresponding to the 1.414 Fibonacci level. Above that, a continued rally could push BTC toward the 1.618 Fibonacci extension near $173,000, although this upper target is more of an optimistic long-term projection at the peak of the extended 5th wave.

Despite the impressive surge in price, momentum indicators are offering a more cautious backdrop. The Relative Strength Index (RSI) on the weekly timeframe exhibits a pattern of lower highs, which may indicate a bearish divergence.

This divergence typically signals weakening internal strength within the uptrend, even though the price is making new highs. It does not invalidate the possibility of higher prices, but it increases the likelihood of corrective phases along the way, which is typical of the extended 5th wave.

At the time of writing, BTC is trading at $94,686. On-chain data shows an impending supply squeeze due to the ongoing wave of Bitcoin outflows from crypto exchanges.

Bitcoin
BTC trading at $94,736 on the 1D chart | Source: BTCUSDT on Tradingview.com
Featured image from Pixabay, chart from Tradingview.com
Editorial Process for bitcoinist is centered on delivering thoroughly researched, accurate, and unbiased content. We uphold strict sourcing standards, and each page undergoes diligent review by our team of top technology experts and seasoned editors. This process ensures the integrity, relevance, and value of our content for our readers.

Scott Matherson is a leading crypto writer at Bitcoinist, who possesses a sharp analytical mind and a deep understanding of the digital currency landscape. Scott has earned a reputation for delivering thought-provoking and well-researched articles that resonate with both newcomers and seasoned crypto enthusiasts. Outside of his writing, Scott is passionate about promoting crypto literacy and often works to educate the public on the potential of blockchain.

Bacaan Terkait

Ethereum dan Bitcoin hadapi krisis pasokan bersejarah – 2 METRIK ini ungkap langkah selanjutnya

Meskipun mengalami volatilitas pasar selama berbulan-bulan, pemegang Ethereum dan Bitcoin terus menunjukkan minat yang rendah untuk mengembalikan koin mereka ke bursa. Fenomena ini lebih dari sekadar penurunan antusiasme perdagangan investor. Persistensi penarikan koin terus mengurangi pasokan likuid yang tersedia di pasar. Saat ini, jumlah Bitcoin di bursa berada pada titik terendah sejak 2017, dan jumlah Ethereum (ETH) di bursa juga mencapai level terendah sejak 2015. Aliran bersih (Netflows) yang negatif menunjukkan bahwa pemegang institusional dan jangka panjang lebih memilih penyimpanan mandiri (seperti ETF atau treasury korporat), yang semakin mengurangi koin dari potensi penjualan dan tekanan jual jangka pendek. Di sisi Bitcoin, Pemegang Jangka Panjang (Long-Term Holders) secara konsisten menyerap pasokan yang beredar, menggeser pola dari distribusi ke akumulasi. Indikator seperti HODL Waves dan Skor Tren Akumulasi mengonfirmasi pengumpulan aset oleh dompet yang lebih kecil dan menengah. Pasokan yang dipegang Pemegang Jangka Panjang mendekati 15 juta BTC, sementara pasokan Pemegang Jangka Pendek turun menjadi sekitar 16,75 juta BTC, mengindikasikan perpindahan kepemilikan ke tangan pemegang dengan keyakinan lebih kuat. Namun, pasokan yang semakin ketat saja tidak cukup untuk mempertahankan pemulihan Bitcoin. Tren kenaikan yang berkelanjutan tetap memerlukan permintaan beli yang lebih kuat untuk menyerap likuiditas yang tersedia. Tanpa dukungan itu, Bitcoin mungkin kesulitan menjaga momentum meskipun saldo di bursa semakin langka. Jika permintaan terus pulih, pasokan likuid yang terbatas berpotensi memperkuat penemuan harga dan mendukung siklus pasar yang digerakkan oleh struktur fundamental.

ambcrypto2j yang lalu

Ethereum dan Bitcoin hadapi krisis pasokan bersejarah – 2 METRIK ini ungkap langkah selanjutnya

ambcrypto2j yang lalu

Trading

Spot
活动图片