XRP Price Breaks Above ‘Magic Line’ With Bullish Continuation Toward $3

bitcoinistDipublikasikan tanggal 2025-04-28Terakhir diperbarui pada 2025-04-28

Abstrak

The XRP price is breaking down once again after a week of upward movement triggered by Bitcoin’s price above $90,000....

Trusted Editorial content, reviewed by leading industry experts and seasoned editors. Ad Disclosure

The XRP price is breaking down once again after a week of upward movement triggered by Bitcoin’s price above $90,000. This move has solidified support for the digital asset above $2, which continues to serve as a launch point for possible price increases. However, this is not the only bullish development that has come out for XRP during this time. A crypto analyst revealed that the XRP price has now crossed an important level, and the altcoin is expected to continue on its upward momentum again.

XRP Price Breaks Magic Line

The magic line in question here is an important trend line that has helped to show the trajectory that the XRP price could possibly take from here. This was observed by crypto analyst Master Ananda, who took to the TradingView website to share this notable break. In addition to this, the altcoin is also showing some major trends that suggest that bullish pressure is still higher than that of the bears, at least for the time being.

According to the crypto analyst, it is possible that the XRP price could succumb to a retrace from here, which would be the result of a major move. However, it is not all bad, given that the retrace could end up resulting in a correction. This is because a bullish continuation is a normal occurrence after a digital asset has confirmed support, Master Ananda explained.

In terms of the current movement, the magic line refers to the top orange trend line, which has obviously been broken. For the XRP price to follow the bearish downtrend, it would have had to push lower below $2. But bulls have maintained support above $2 and triggered a breakout toward $2.2.
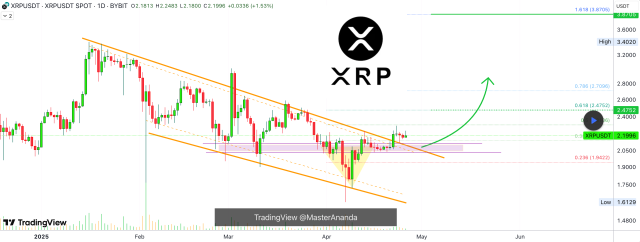
XRP price chart
Source: TradingView

“The trendline has just been broken and XRP is moving sideways, consolidating,” the crypto analyst explained. This consolidation will lead to a bullish continuation. The next move is up.” If this holds, the crypto analyst’s chart shows an at least 30% move for the XRP price that could put the altcoin above $2.8 and well on the way to $3.

Not only are the technicals pointing toward a bullish continuation, but there are other factors that are propelling bulls. For one, the announcement that the CME Group is planning to launch its own XRP futures product has boosted community morale. Furthermore, another market analyst expects the XRP price to actually reach as high as $100 if it captures only 10% of SWIFT’s volume.

XRP Price chart from TradingView.com
Bulls reclaim control of price | Source: XRPIUSDT on TradingView.com
Featured image from Dall.E, chart from TradingView.com
Editorial Process for bitcoinist is centered on delivering thoroughly researched, accurate, and unbiased content. We uphold strict sourcing standards, and each page undergoes diligent review by our team of top technology experts and seasoned editors. This process ensures the integrity, relevance, and value of our content for our readers.

Scott Matherson is a leading crypto writer at Bitcoinist, who possesses a sharp analytical mind and a deep understanding of the digital currency landscape. Scott has earned a reputation for delivering thought-provoking and well-researched articles that resonate with both newcomers and seasoned crypto enthusiasts. Outside of his writing, Scott is passionate about promoting crypto literacy and often works to educate the public on the potential of blockchain.

Bacaan Terkait

Ethereum dan Bitcoin hadapi krisis pasokan bersejarah – 2 METRIK ini ungkap langkah selanjutnya

Meskipun mengalami volatilitas pasar selama berbulan-bulan, pemegang Ethereum dan Bitcoin terus menunjukkan minat yang rendah untuk mengembalikan koin mereka ke bursa. Fenomena ini lebih dari sekadar penurunan antusiasme perdagangan investor. Persistensi penarikan koin terus mengurangi pasokan likuid yang tersedia di pasar. Saat ini, jumlah Bitcoin di bursa berada pada titik terendah sejak 2017, dan jumlah Ethereum (ETH) di bursa juga mencapai level terendah sejak 2015. Aliran bersih (Netflows) yang negatif menunjukkan bahwa pemegang institusional dan jangka panjang lebih memilih penyimpanan mandiri (seperti ETF atau treasury korporat), yang semakin mengurangi koin dari potensi penjualan dan tekanan jual jangka pendek. Di sisi Bitcoin, Pemegang Jangka Panjang (Long-Term Holders) secara konsisten menyerap pasokan yang beredar, menggeser pola dari distribusi ke akumulasi. Indikator seperti HODL Waves dan Skor Tren Akumulasi mengonfirmasi pengumpulan aset oleh dompet yang lebih kecil dan menengah. Pasokan yang dipegang Pemegang Jangka Panjang mendekati 15 juta BTC, sementara pasokan Pemegang Jangka Pendek turun menjadi sekitar 16,75 juta BTC, mengindikasikan perpindahan kepemilikan ke tangan pemegang dengan keyakinan lebih kuat. Namun, pasokan yang semakin ketat saja tidak cukup untuk mempertahankan pemulihan Bitcoin. Tren kenaikan yang berkelanjutan tetap memerlukan permintaan beli yang lebih kuat untuk menyerap likuiditas yang tersedia. Tanpa dukungan itu, Bitcoin mungkin kesulitan menjaga momentum meskipun saldo di bursa semakin langka. Jika permintaan terus pulih, pasokan likuid yang terbatas berpotensi memperkuat penemuan harga dan mendukung siklus pasar yang digerakkan oleh struktur fundamental.

ambcrypto19m yang lalu

Ethereum dan Bitcoin hadapi krisis pasokan bersejarah – 2 METRIK ini ungkap langkah selanjutnya

ambcrypto19m yang lalu

Trading

Spot
活动图片