Executive Summary
- Hash Rate remains just shy of ATHs, as continued investment by Miners demonstrates immense conviction in the Bitcoin Network despite depressed revenues.
- Investor interactions with exchanges are in decline, with contracting volumes across the board, suggesting there is a diminished appetite for investors and trade.
- Both the Bitcoin and Ethereum ETFs are exhibiting outflows, however, investor interest in the Bitcoin ETFs remain significantly larger in scale and magnitude.
Miners
Miners remain fundamental participants in the Bitcoin network and act as the primary production source for new coins. Miners provide the hashing power used to discover the next valid block, with the network autonomously rewarding them with newly issued coins and transaction fees.
This makes mining an exceptionally challenging industry, as they have control over neither the input cost of energy nor the output cost of BTC.
Despite choppy and uncertain market conditions, Bitcoin miners have continued to install new ASIC hardware, pushing the overall hash rate higher (14D-MA), reaching 666.4EH/s, and just 1% shy of the ATH.
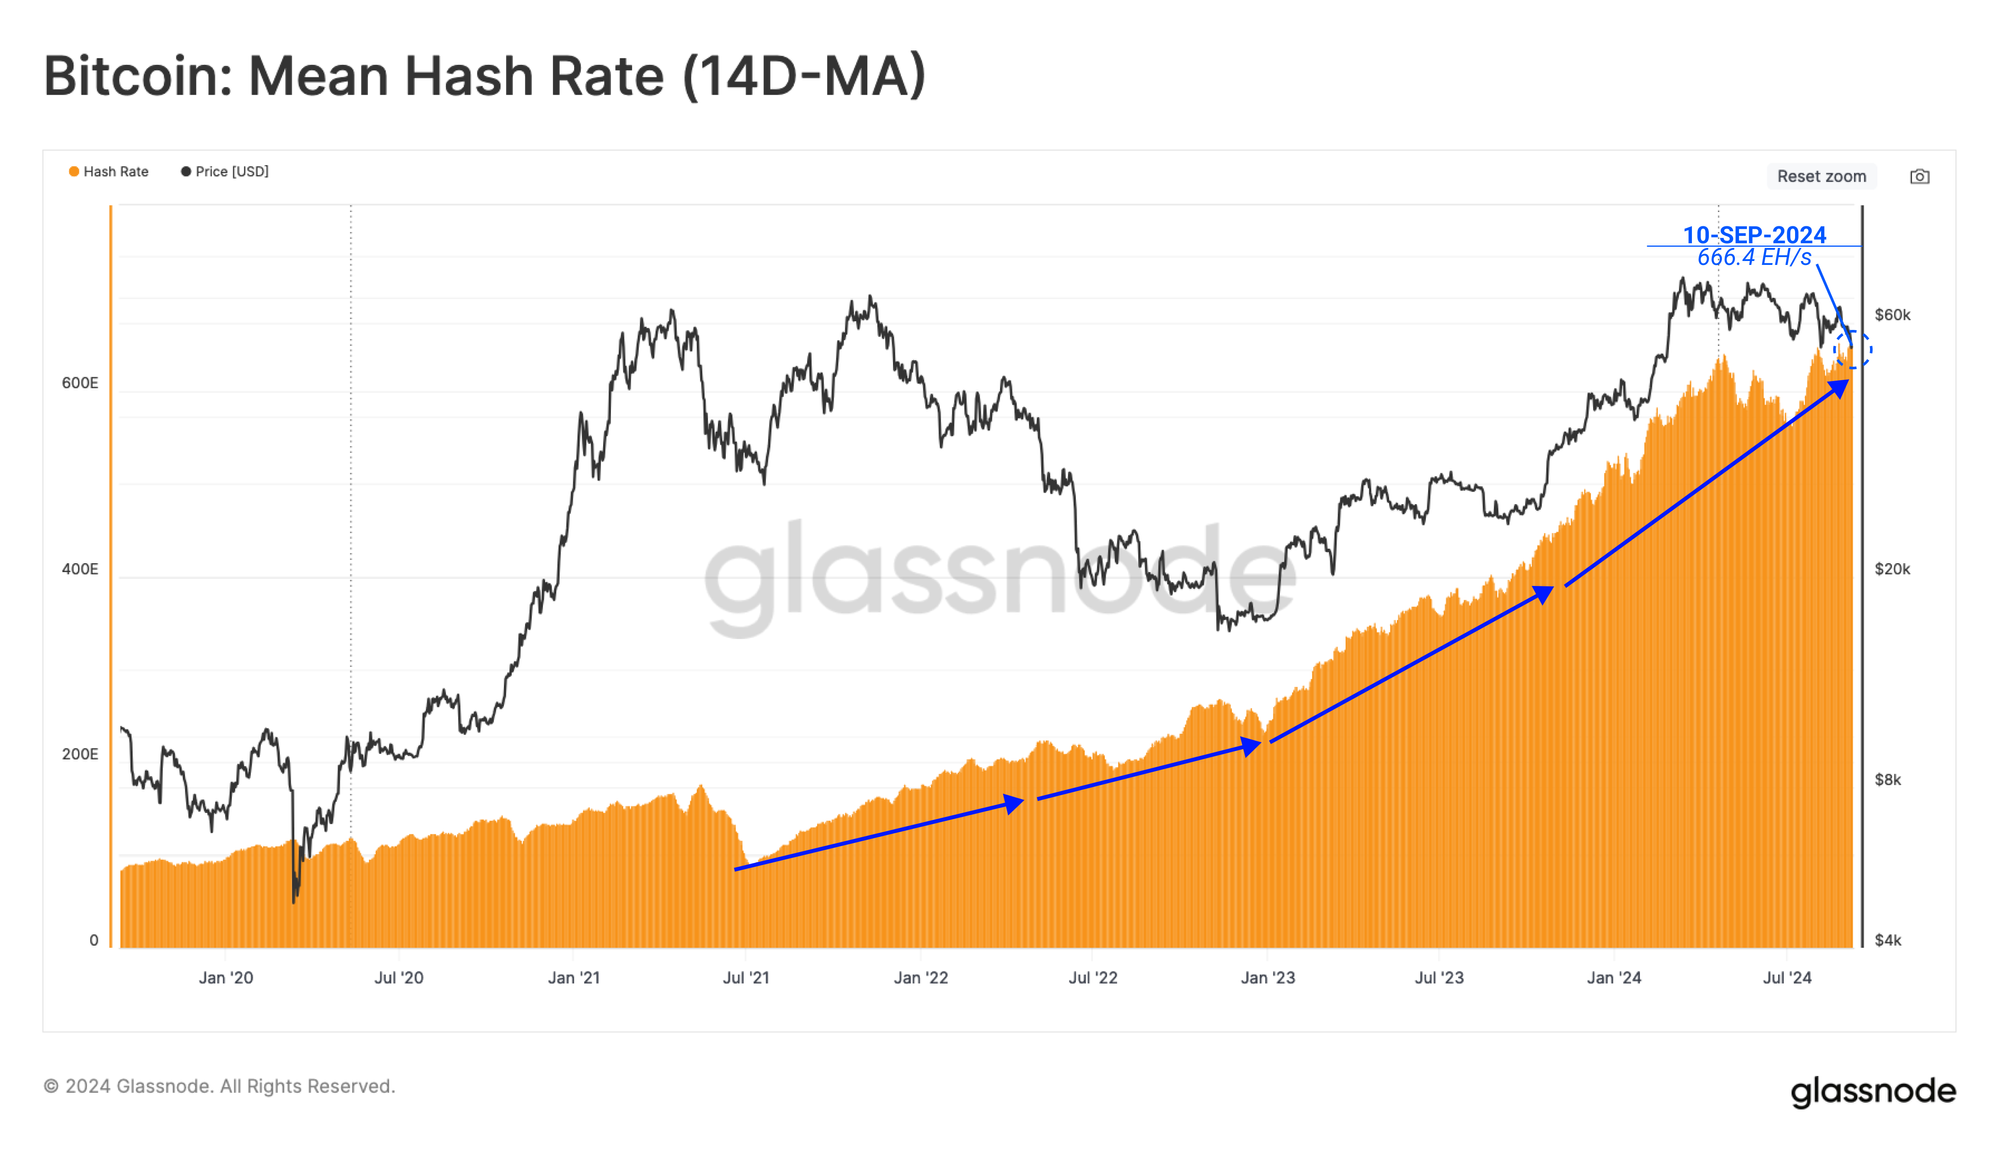
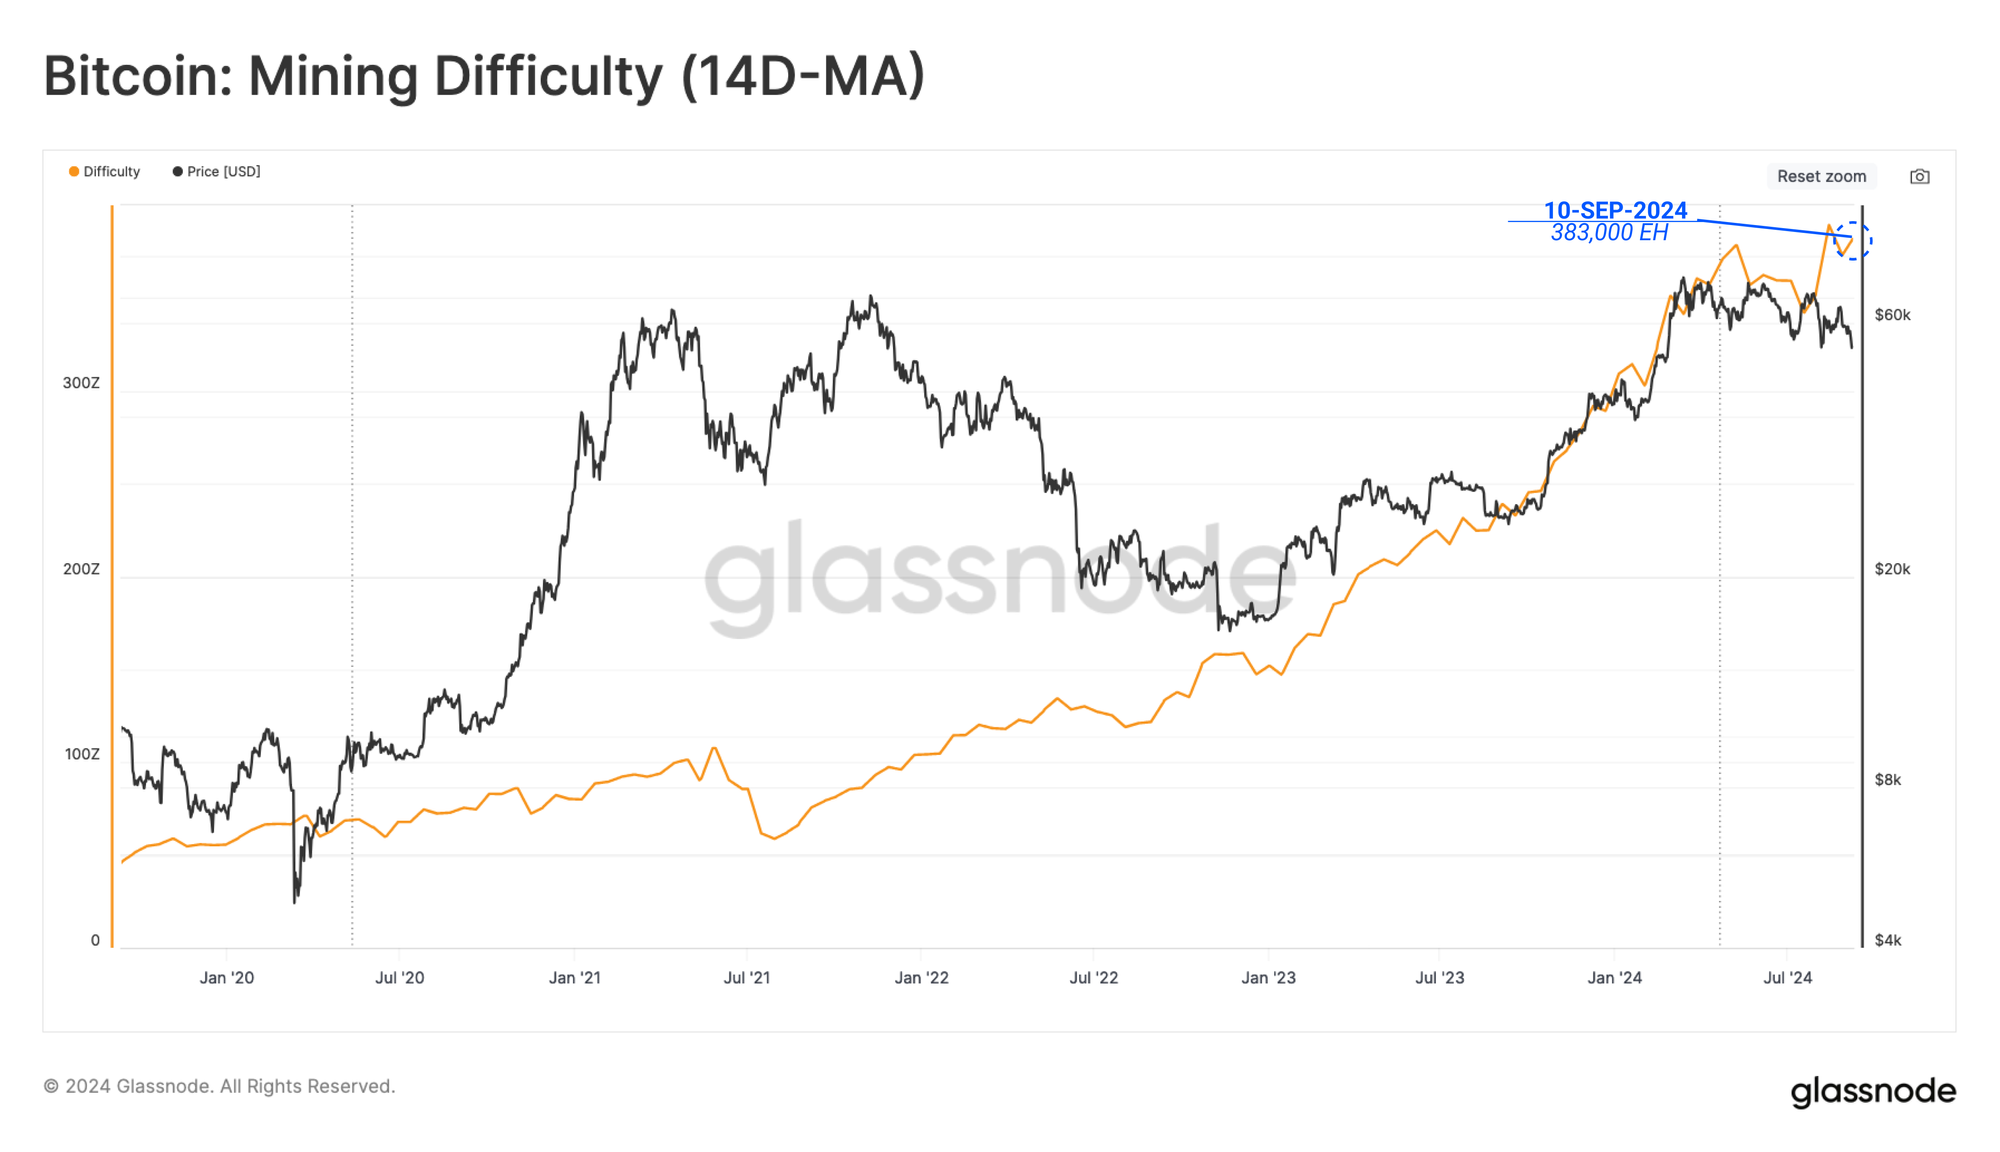
As the hash rate increases, so does the target Difficulty to successfully mine a valid block. The Bitcoin protocol automatically adjusts the difficulty to account for rising and falling hash rate on the network.
Presently, the average required number of hashes to mine a block is 338k exahash. This is the second largest difficulty throughout Bitcoin’s lifespan, highlighting the ever-growing competitiveness of the mining industry.
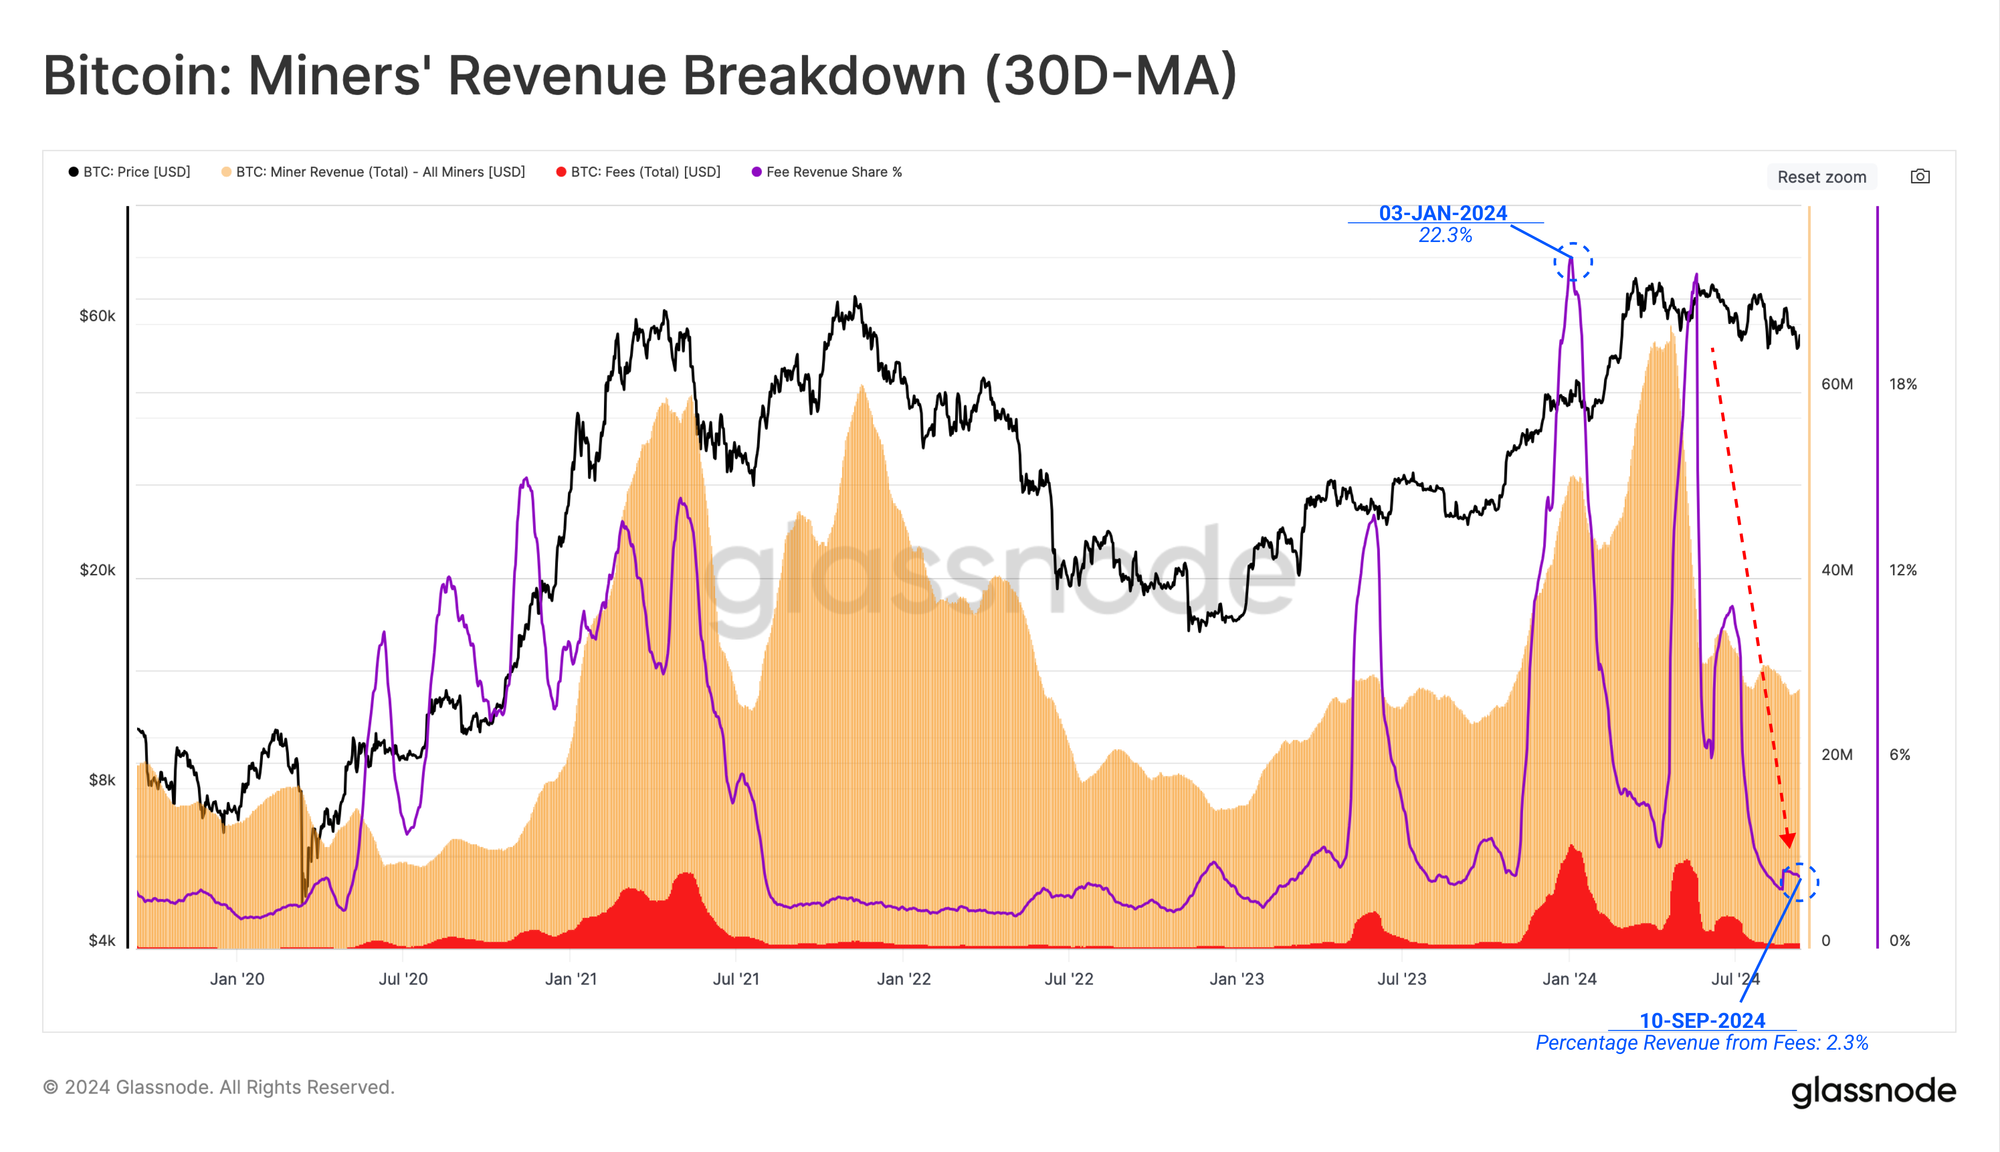
Nevertheless, a significant decline in Miner Revenue can be seen since the market price peaked at a new ATH in March. A significant portion of this revenue decline can be attributed to falling fee pressure. This is driven by declining demand for monetary transfers and falling fees generated from Runes and Inscription-related transactions.
Miner revenue associated with the block subsidy remains relatively high due to spot prices trading above $55k, however remain around 22% below the previous ATH.
- Block Subsidy Revenue: $824M
- Transaction Fee Revenue: $20M
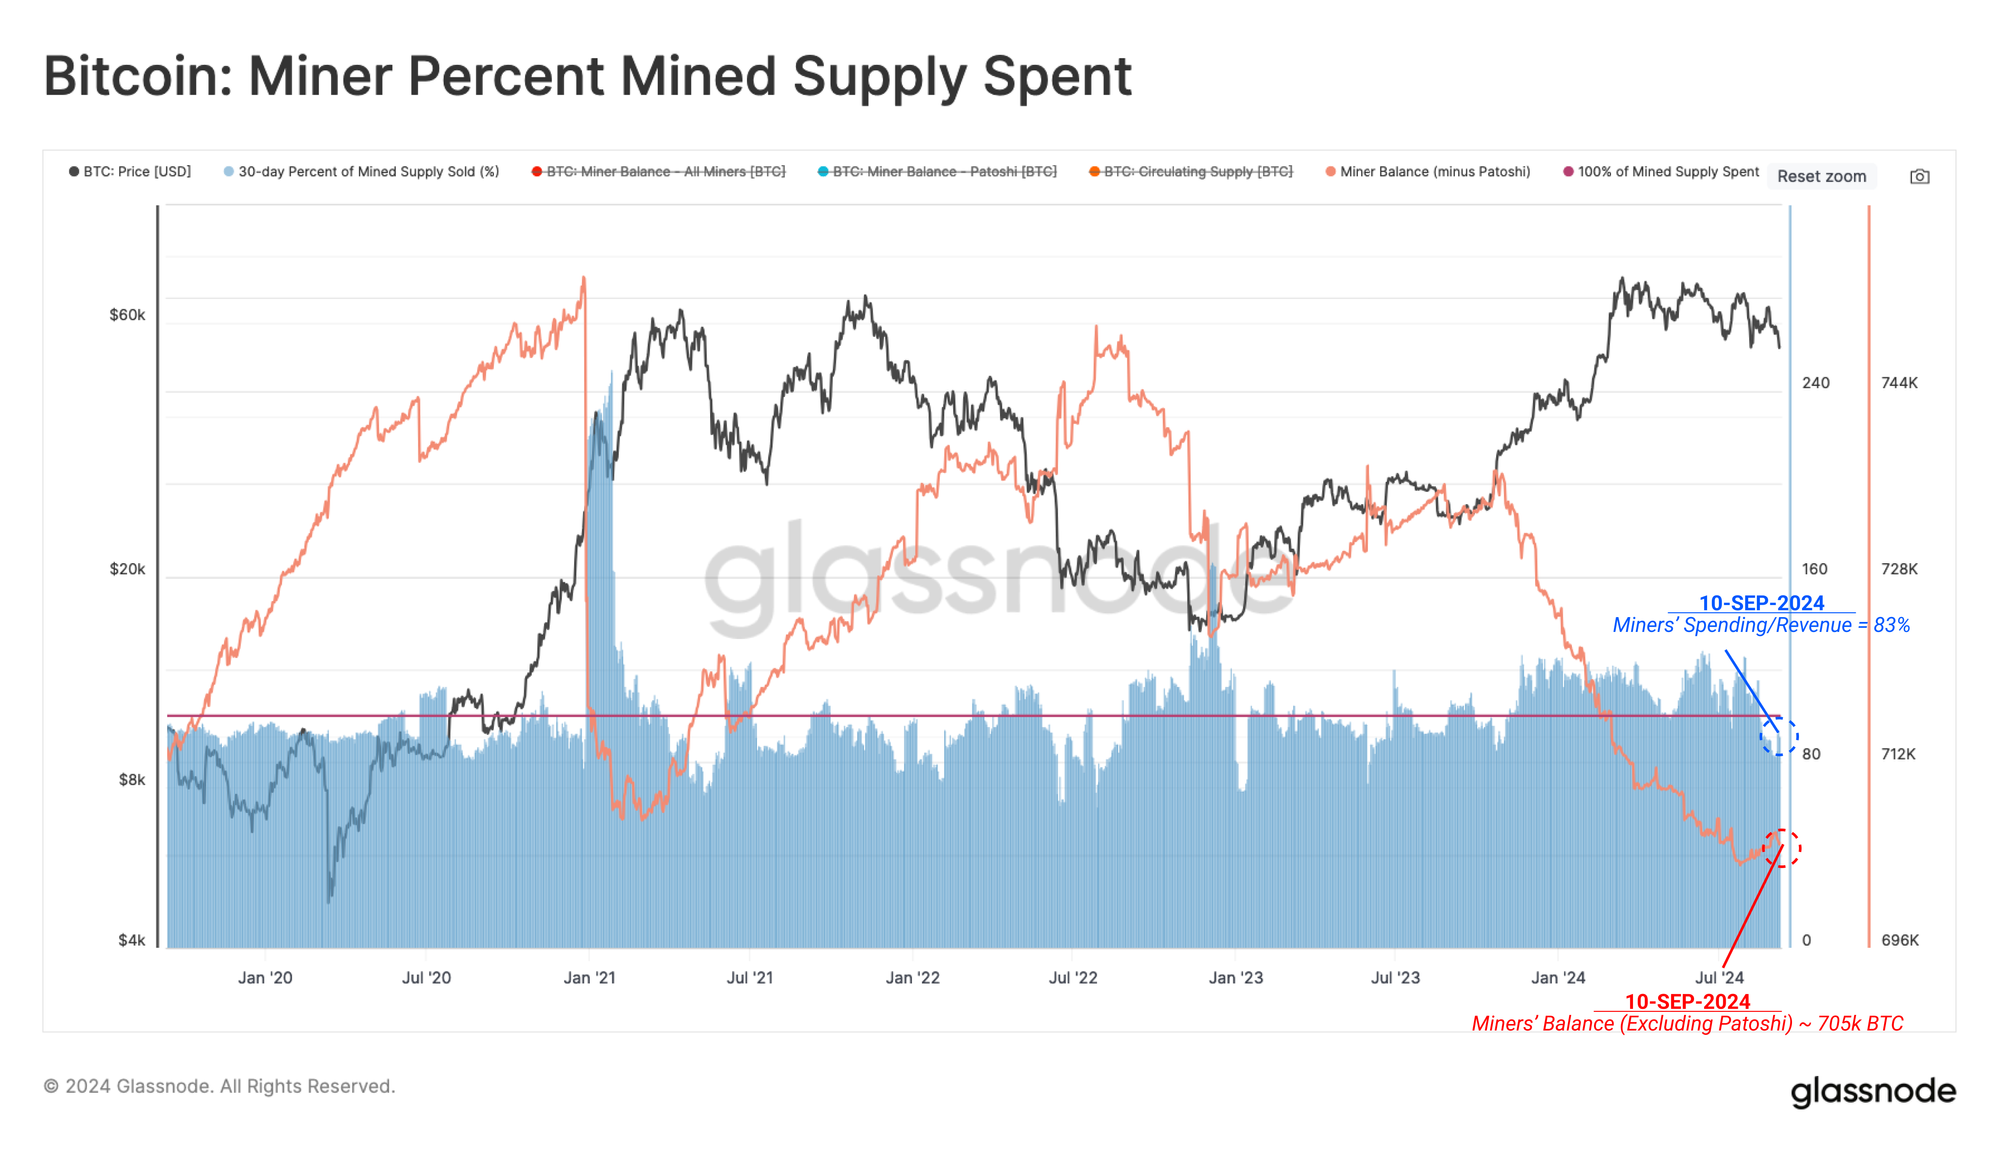
As revenues decline, we can infer that a degree of income stress may start to develop. We can estimate the percentage of the mined supply spent by miners over a 30-day window to measure whether this is the case.
Due to the competitive and capital-intensive nature of the mining industry, miners have historically needed to distribute a majority of the coins mined to cover input costs. Interestingly, Miners have transitioned from net distribution over the mined supply to now retaining a portion of mined supply in their treasury reserves.
This highlights an interesting development, as Miners tend to be pro-cyclical, being sellers during drawdowns and HODLers during uptrends. The uptick in hash rate and difficulty represents an increasingly expensive production cost for BTC, which may adversely affect miner profitability in the near future.
Settlement Slowdown
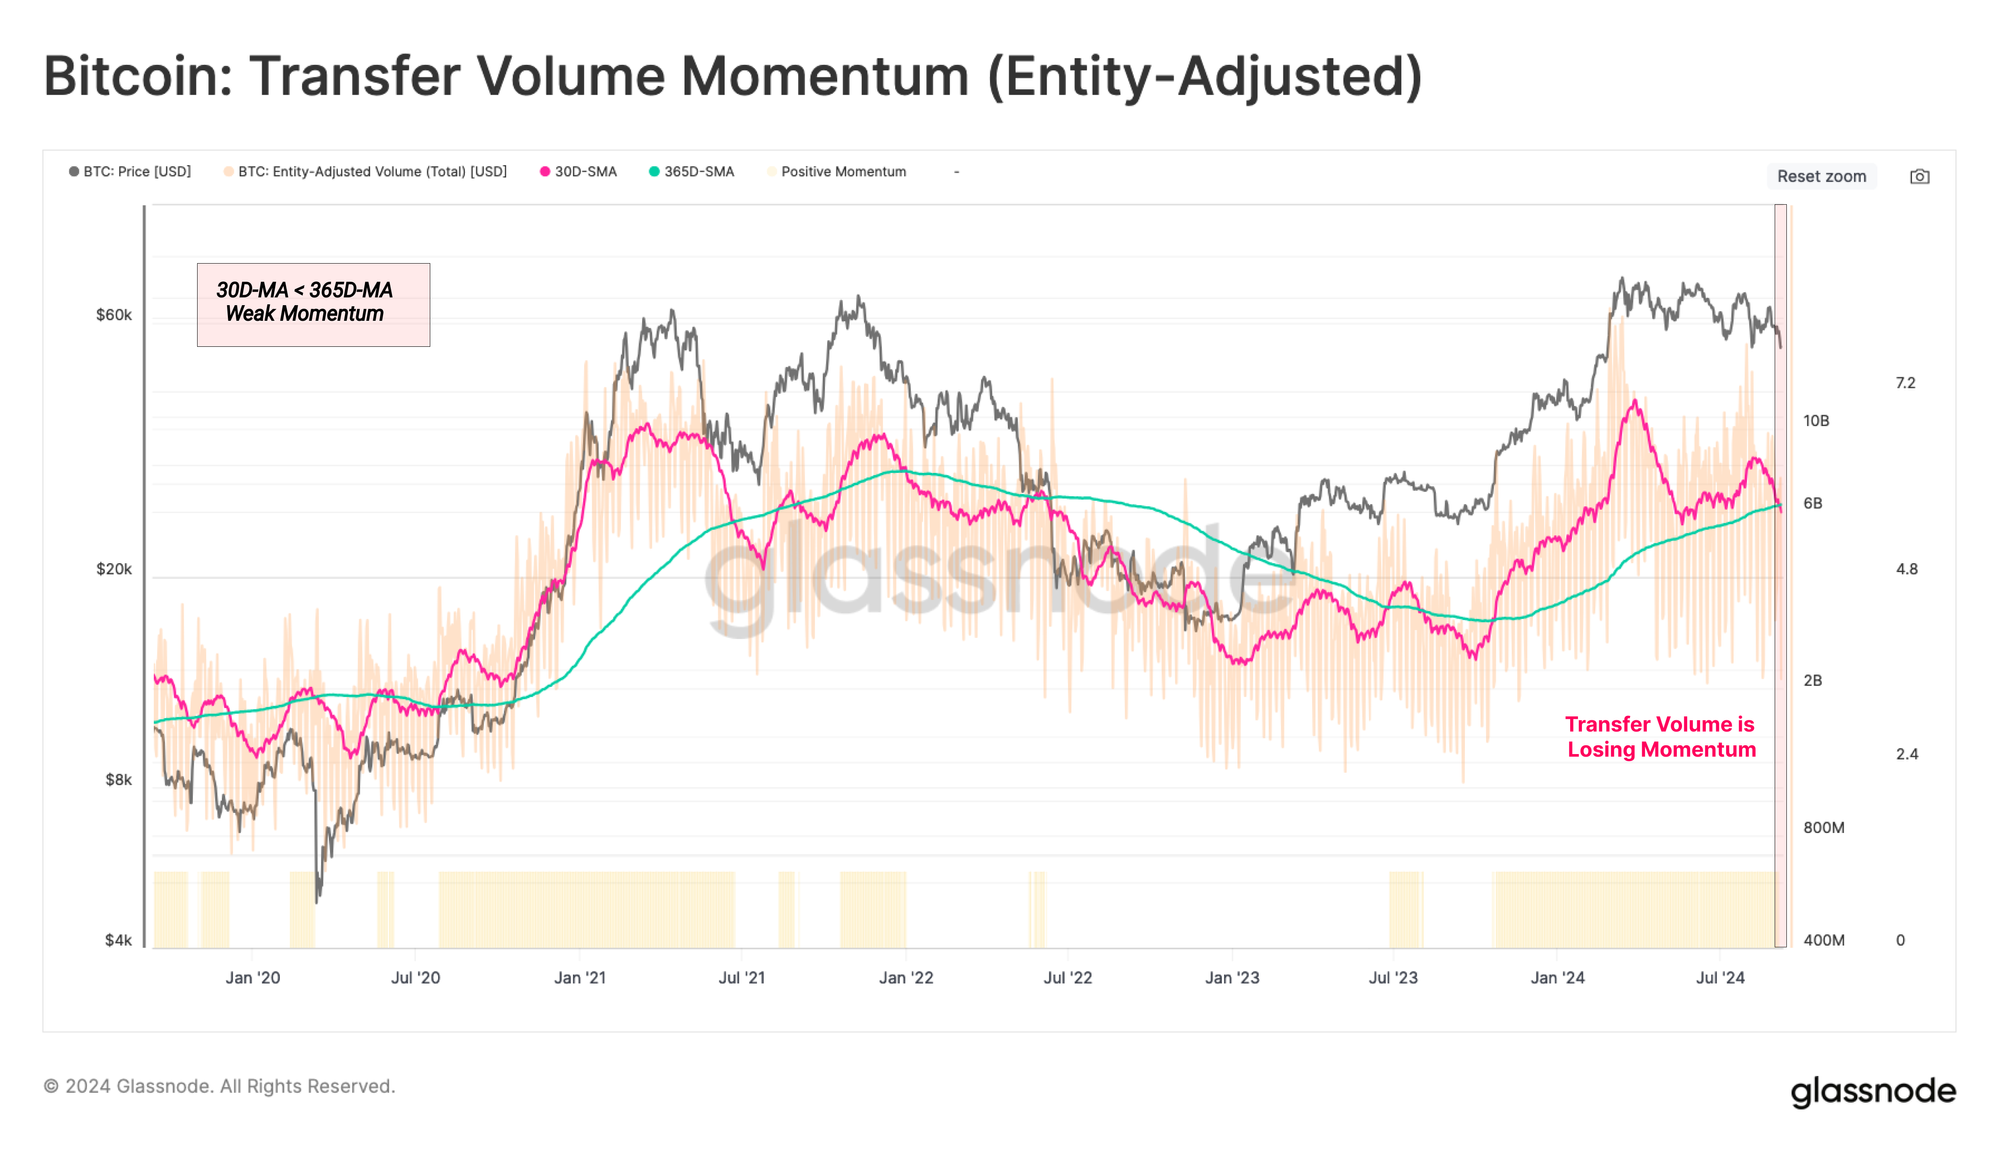
The magnitude of volume settled on-chain can also provide colour into the degree of network adoption and health. When filtering for entity-adjusted volume, the network is currently processing and settling around $6.2B worth of transaction volume per day.
However, settlement volume is beginning to fall towards its yearly average, suggesting a marked cooling off in network usage and throughput. Generally speaking, this is a net negative observation.
Reduced Trading Appetite
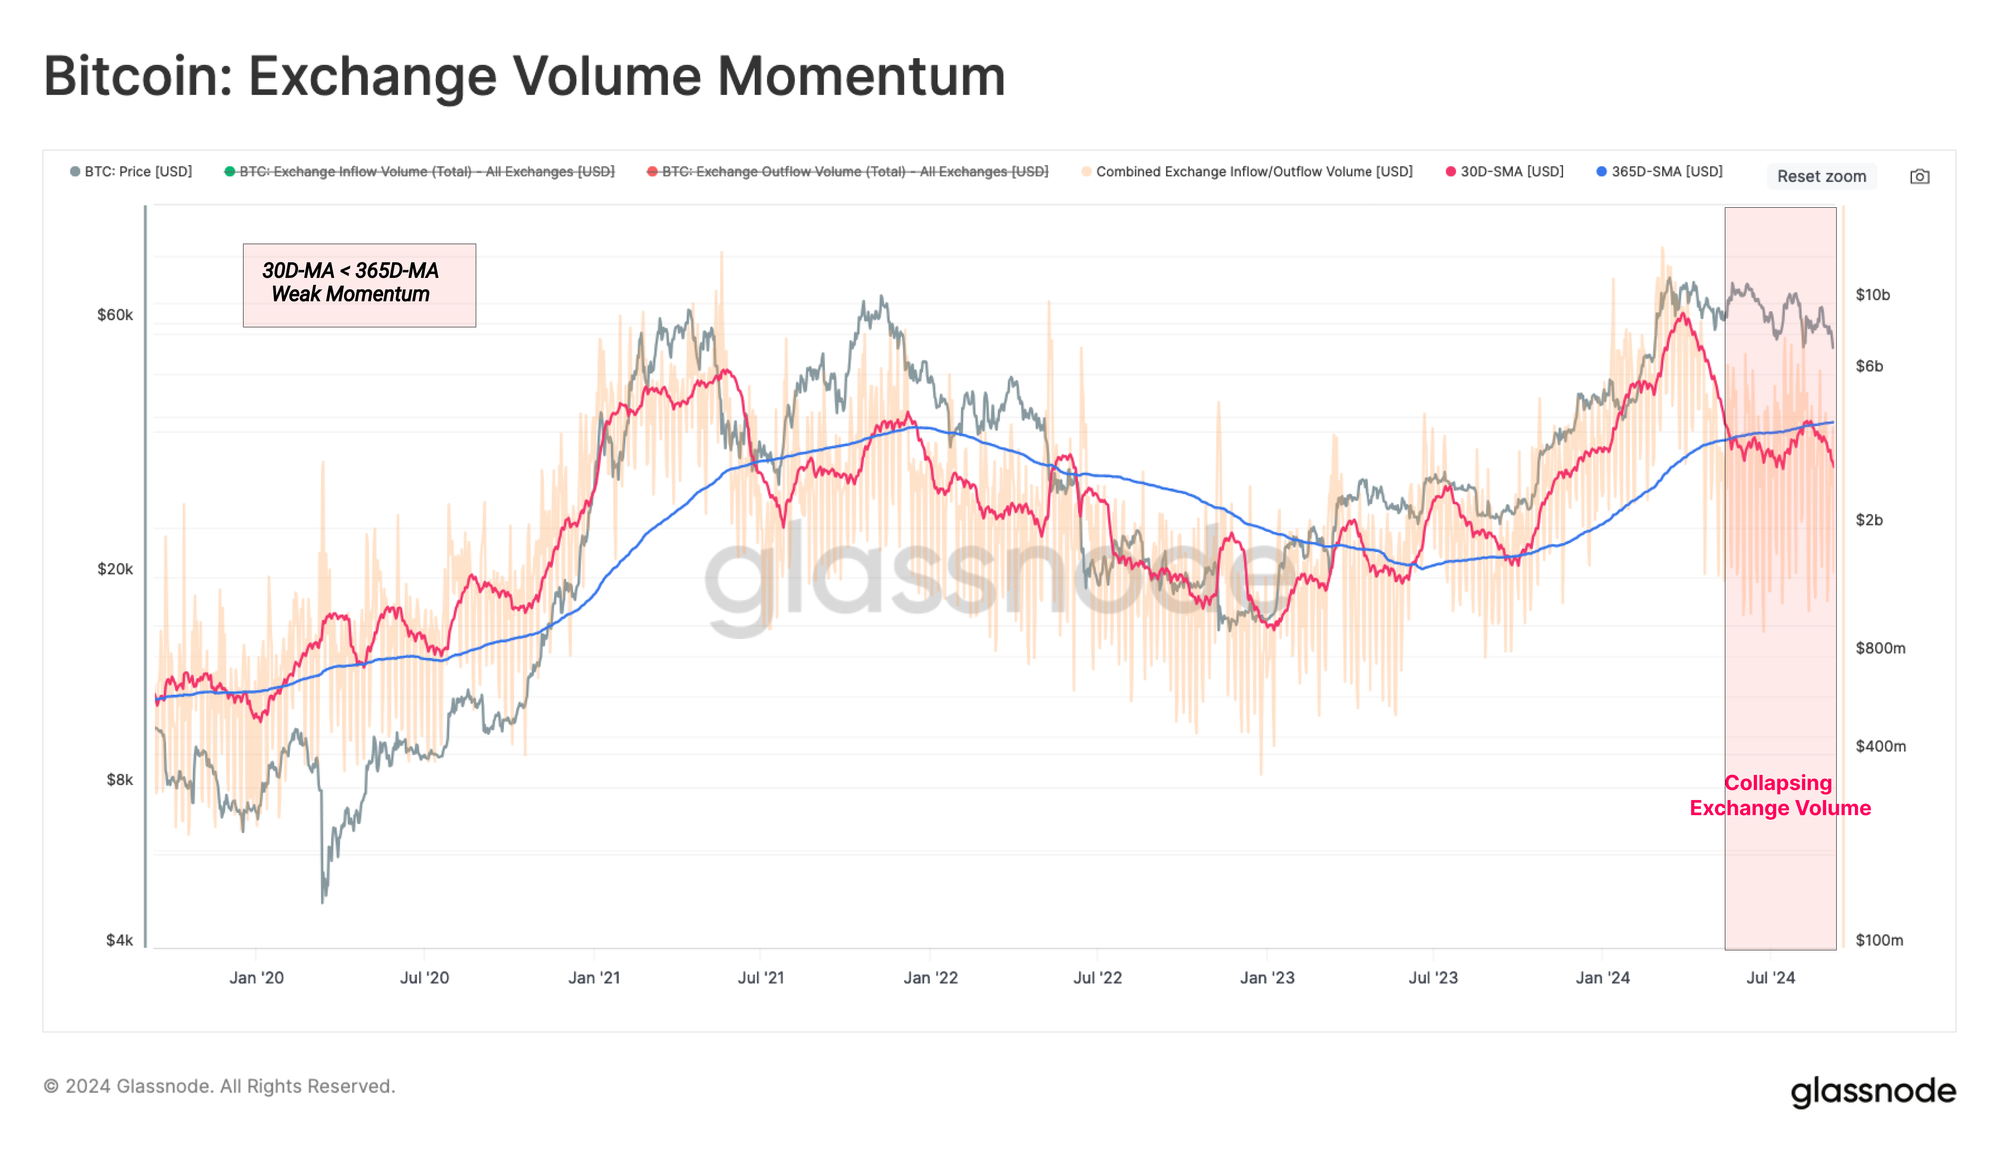
In an ever-evolving market landscape, centralized exchanges have remained the centrepiece venue for speculation activity and price discovery. Therefore, we can evaluate onchain volumes aggregated across these venues as a proxy for investor activity and appetite for speculation.
Running a similar 30d/365d momentum cross-over for exchange-related inflows and outflows, we can see that the monthly average volume has fallen well below the yearly. This underscores a decline in investor demand and less trading by speculators within the current price range.
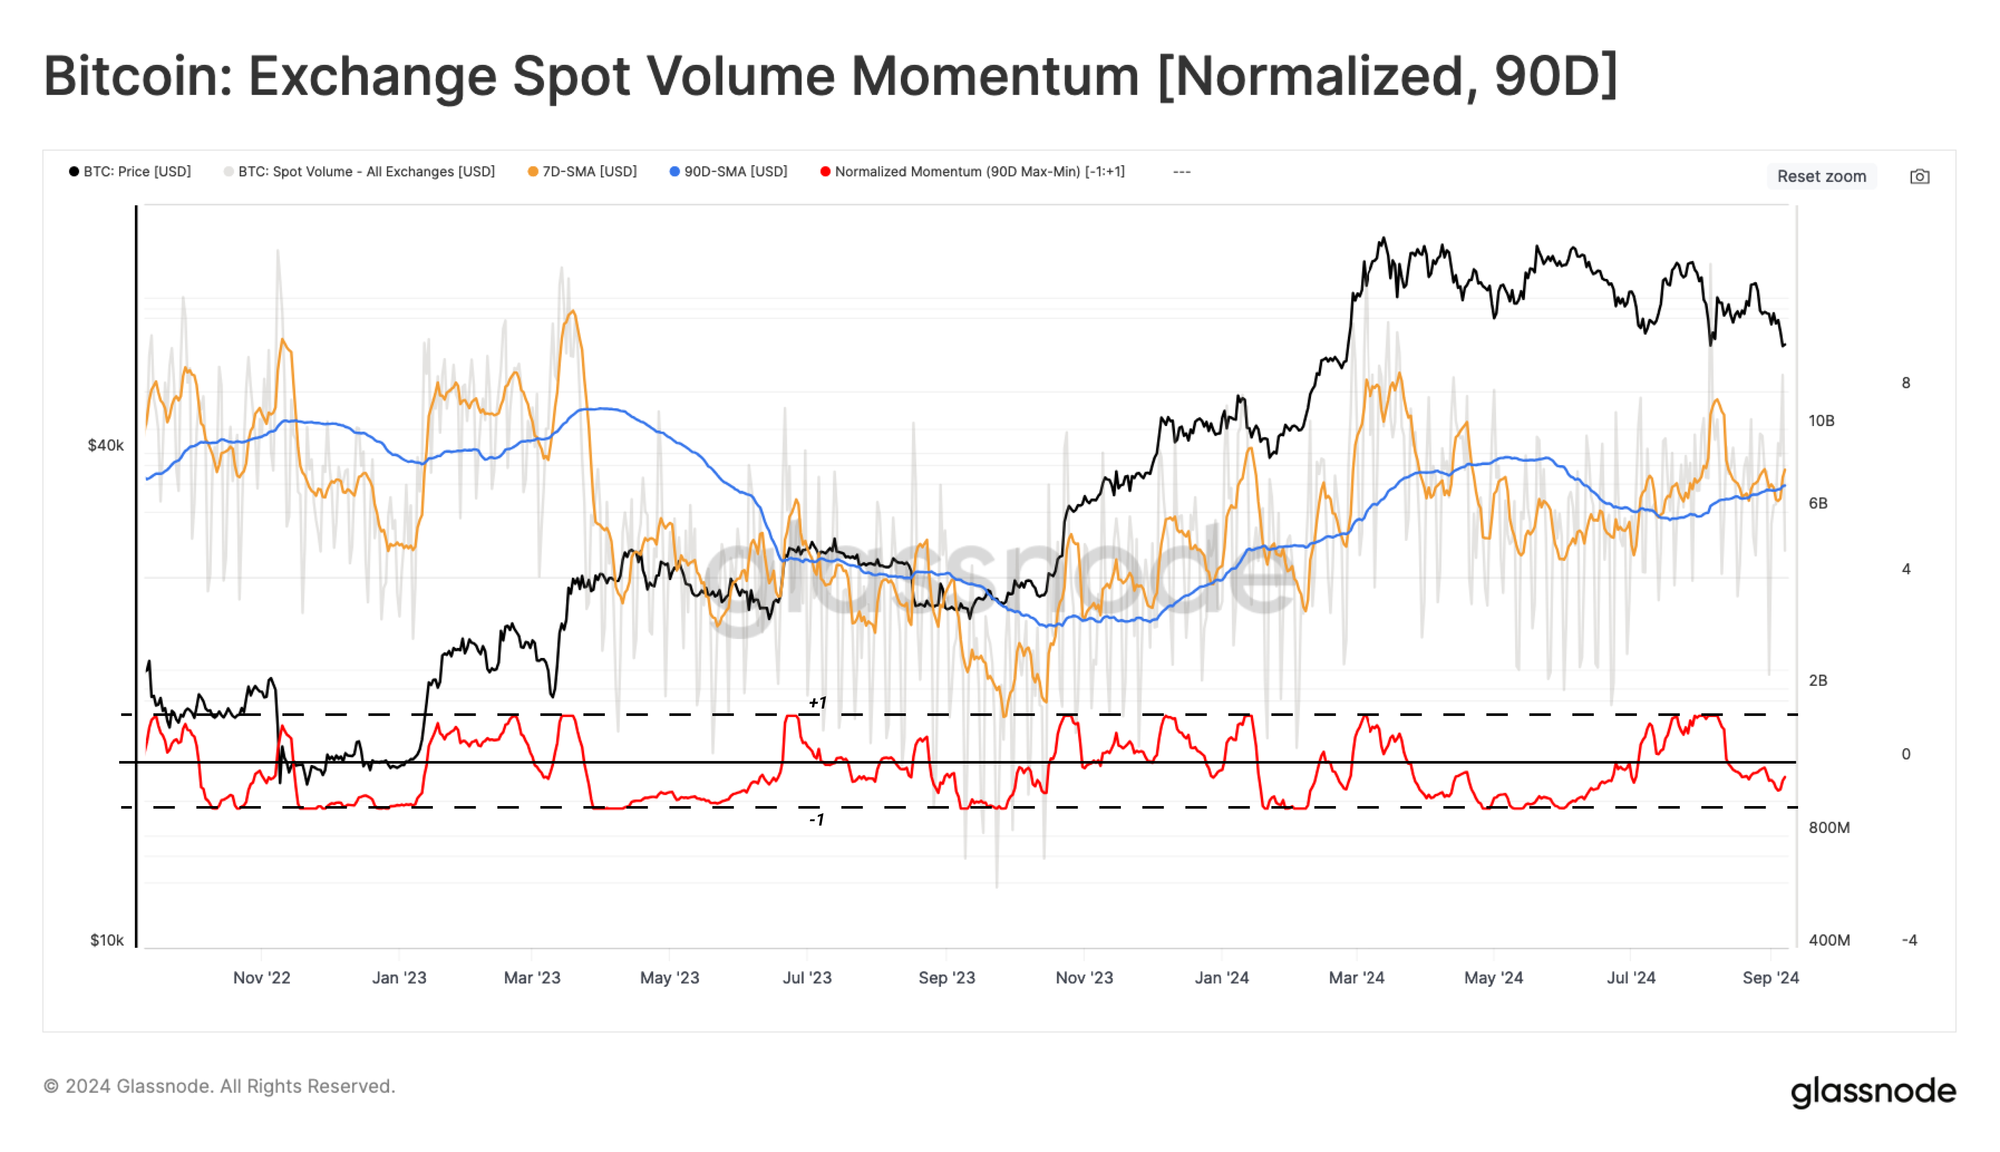
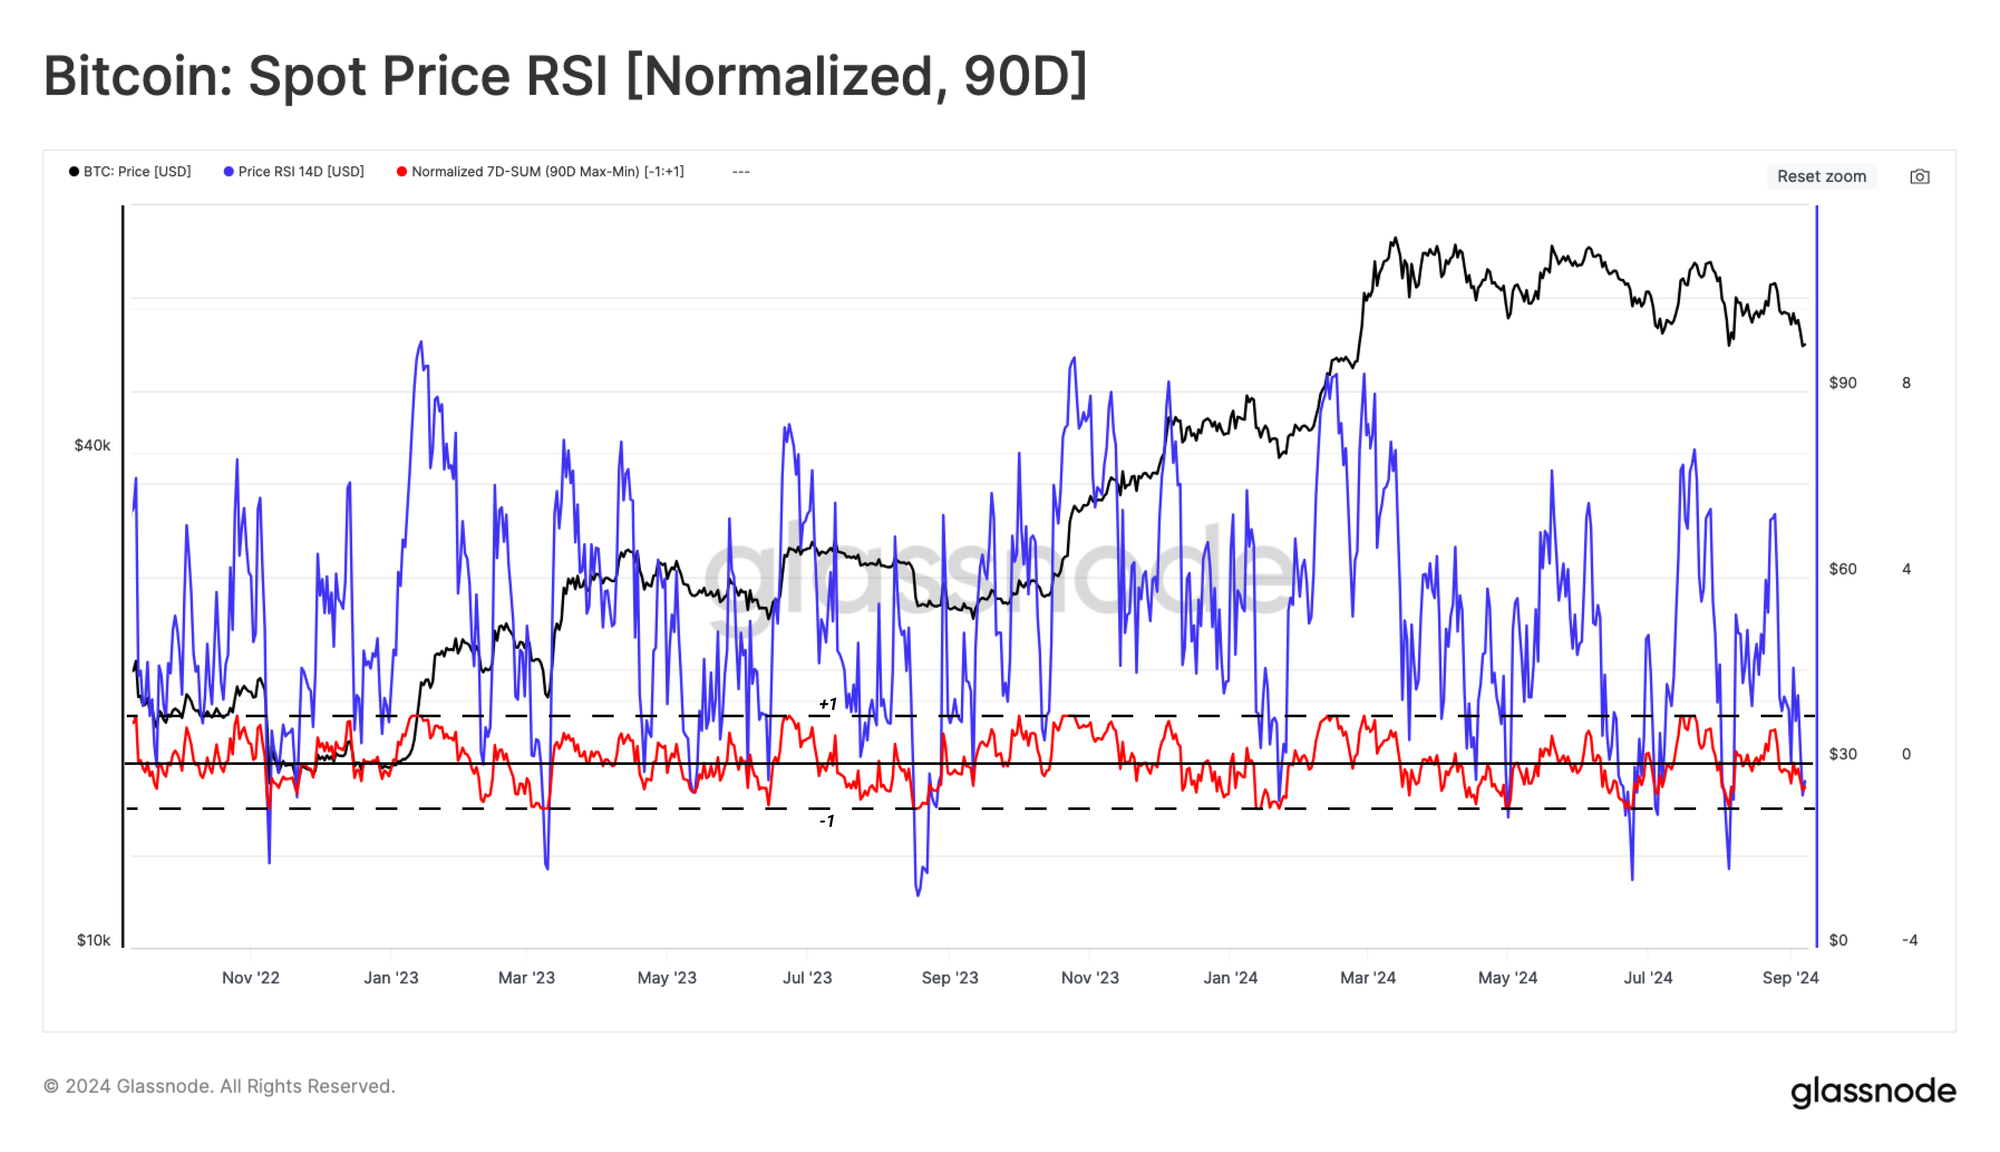
Next, we will look at spot trade volumes at exchange venues. Here, we apply a 90d MinMax scalar, which normalizes the value set over a range of 1 to -1 relative to the maximum and minimum values of the selected period.
From this, a similar observation can be ascertained, with spot volume momentum continuing to decay. This adds more weight to the idea that there has been a notable decline in trade activity over the last quarter.
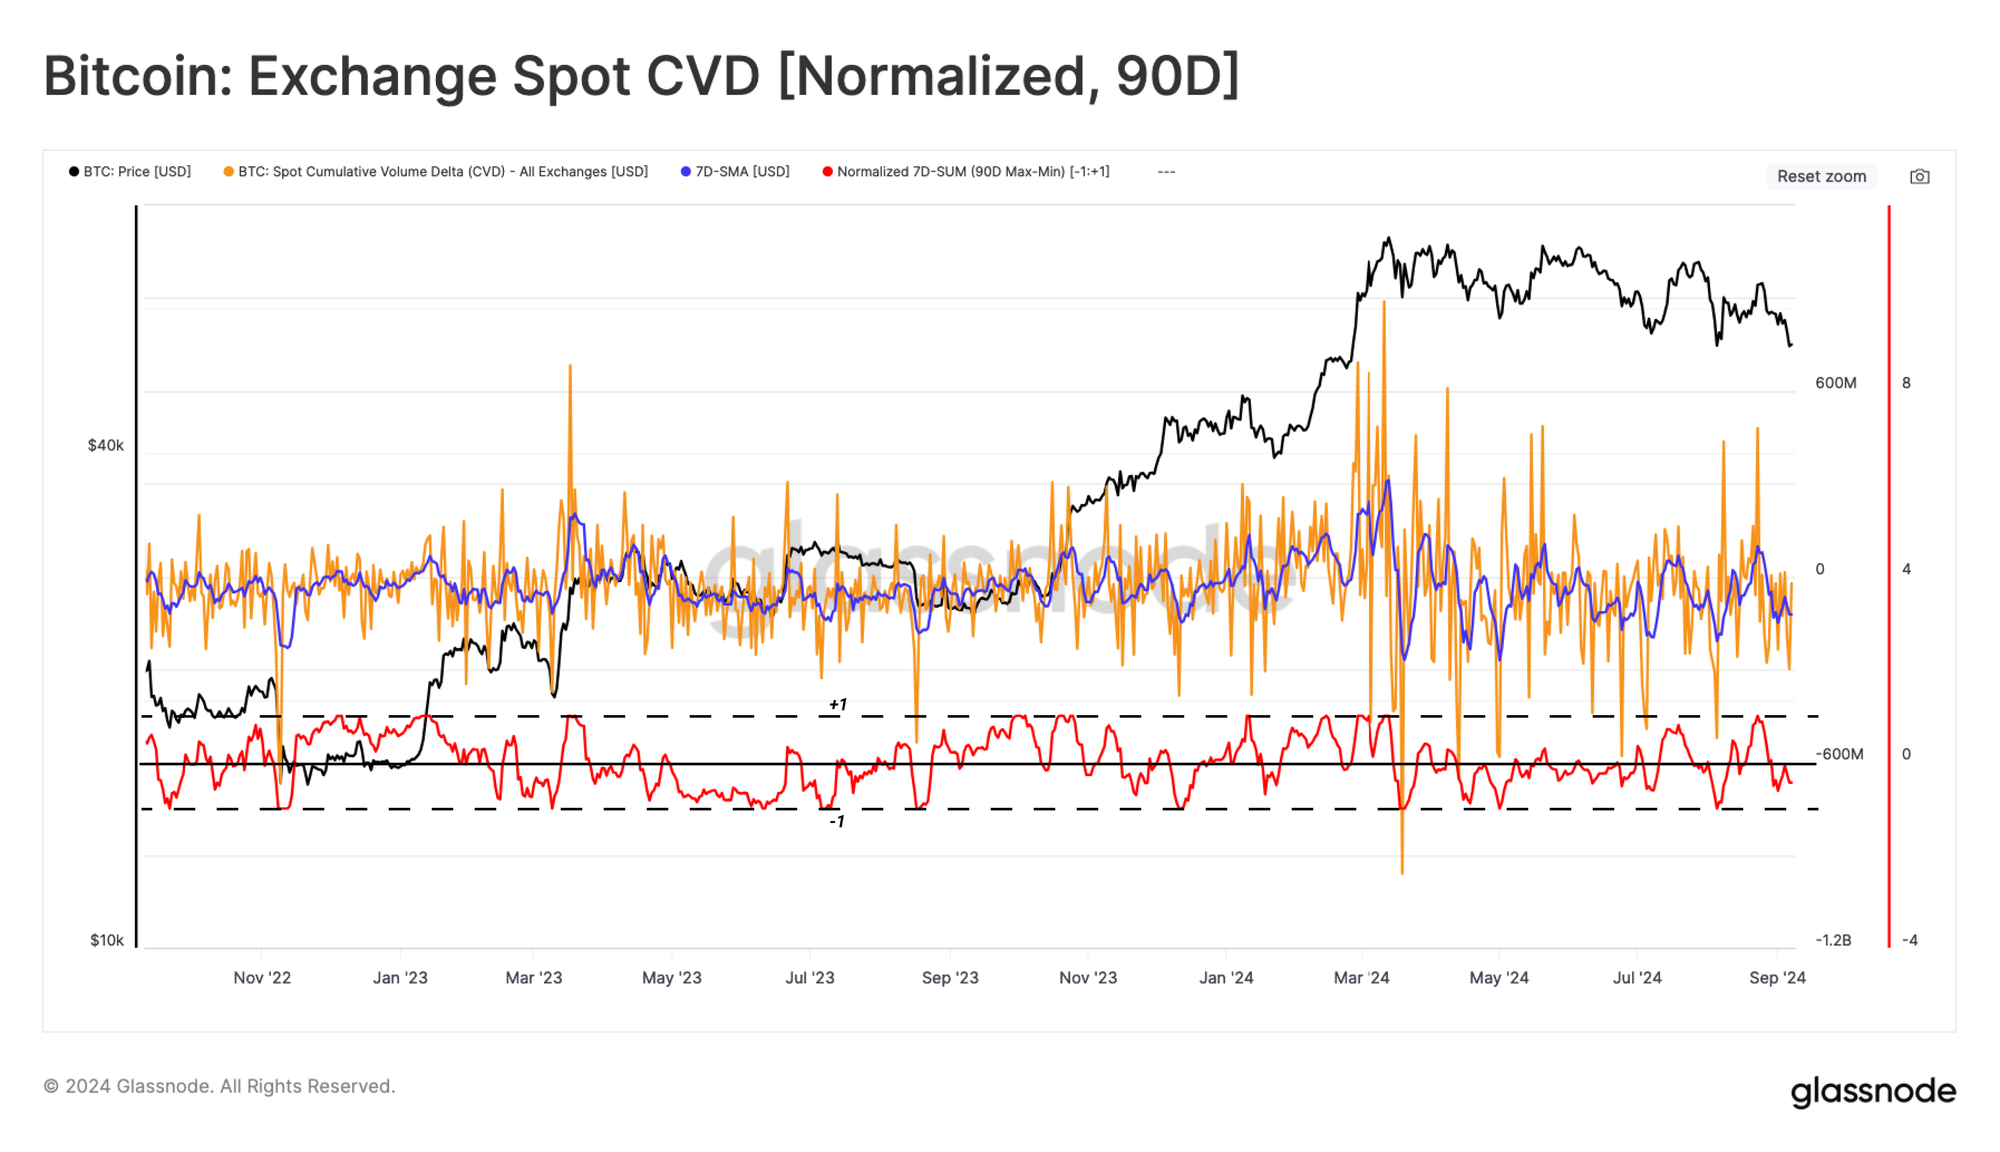
The CVD metric can estimate the present net balance between market buying and selling pressure in spot markets. Utilizing the same methodology, we note that investor sell-pressure has been increasing across the last 90d, contributing toward the downward tilt in price action.
Finally, we can evaluate the momentum of price action for the Bitcoin price. Here, a degree of indecision can be seen, with positive and negative data points occurring over August. This starkly compares to the two previously highlighted indicators, both of which have been decisively negative across the same period.
Combining the MinMax Transformations for Volume, CVD and Price Action, respectively, we are able to produce a Sentiment Heatmap concerning the values of the features between 1 and -1. We can consider this over the following framework:
- 🟢 Values of 1 suggest High Risk
- 🟡 Values of 0 suggest Moderate Risk
- 🔴 Values of -1 Suggest Low Risk
Presently, all three indicators are suggesting the market is entering a low-risk zone relative to the last 90 days of data points. Such confluence among the discussed spot indicators can be translated into diminishing ( Spot Volume Momentum ) sell volume ( CVD < 0) while price action is slowly chopping downward. Such a structure may be susceptible to external forces and could potentially break out on either side if the tides shift.

ETFs
The Ethereum ETFs have now followed the launch of the US Bitcoin ETFs in January in August. These two events mark a “Crossing the Rubicon” event for the Digital Asset Ecosystem, providing US traditional markets with an accessible access point for exposure to the leading two cryptocurrencies.
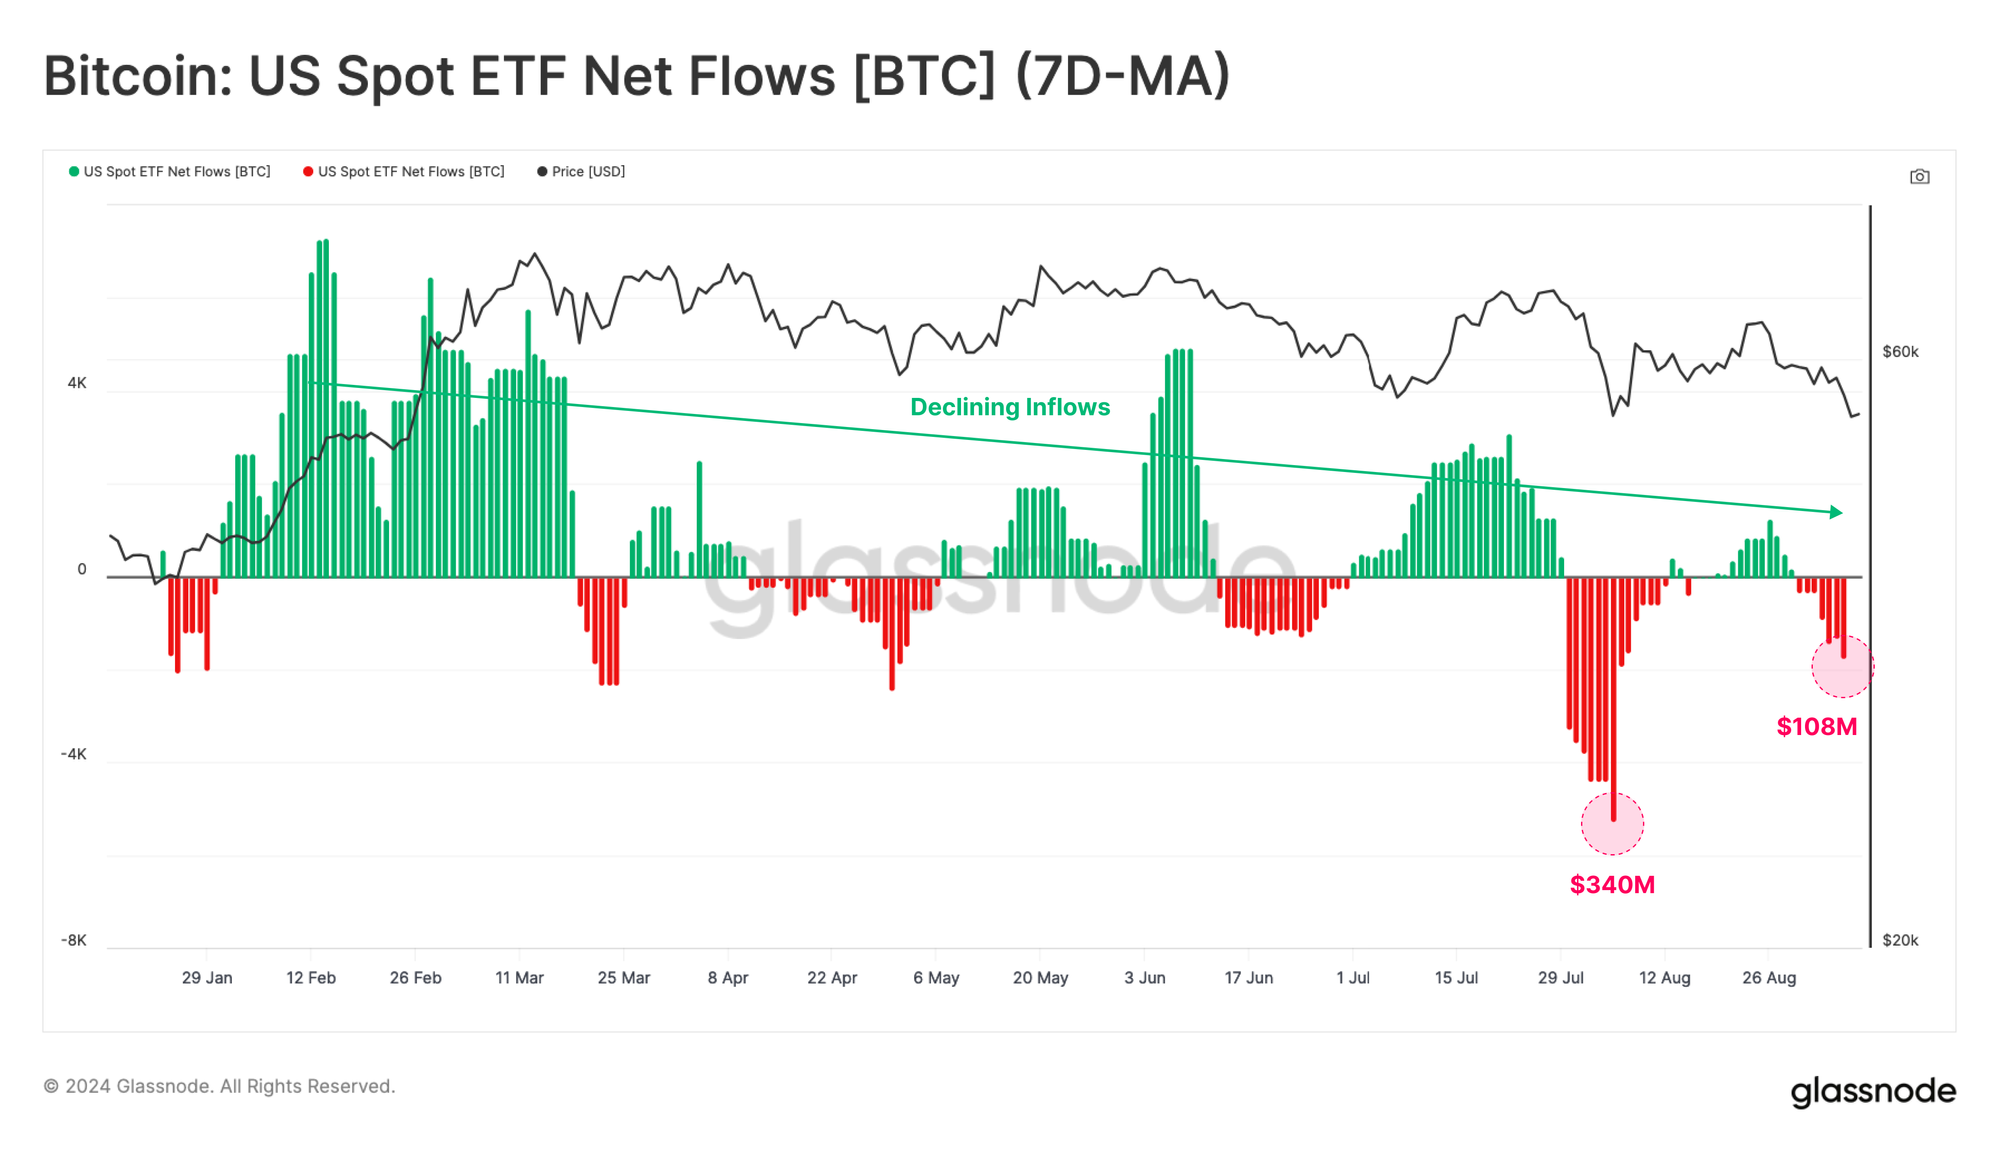
Starting with the Bitcoin ETFs, we can see that net capital flows in USD have softened since Aug 2024 and are now reporting an outflow of $107M/week.
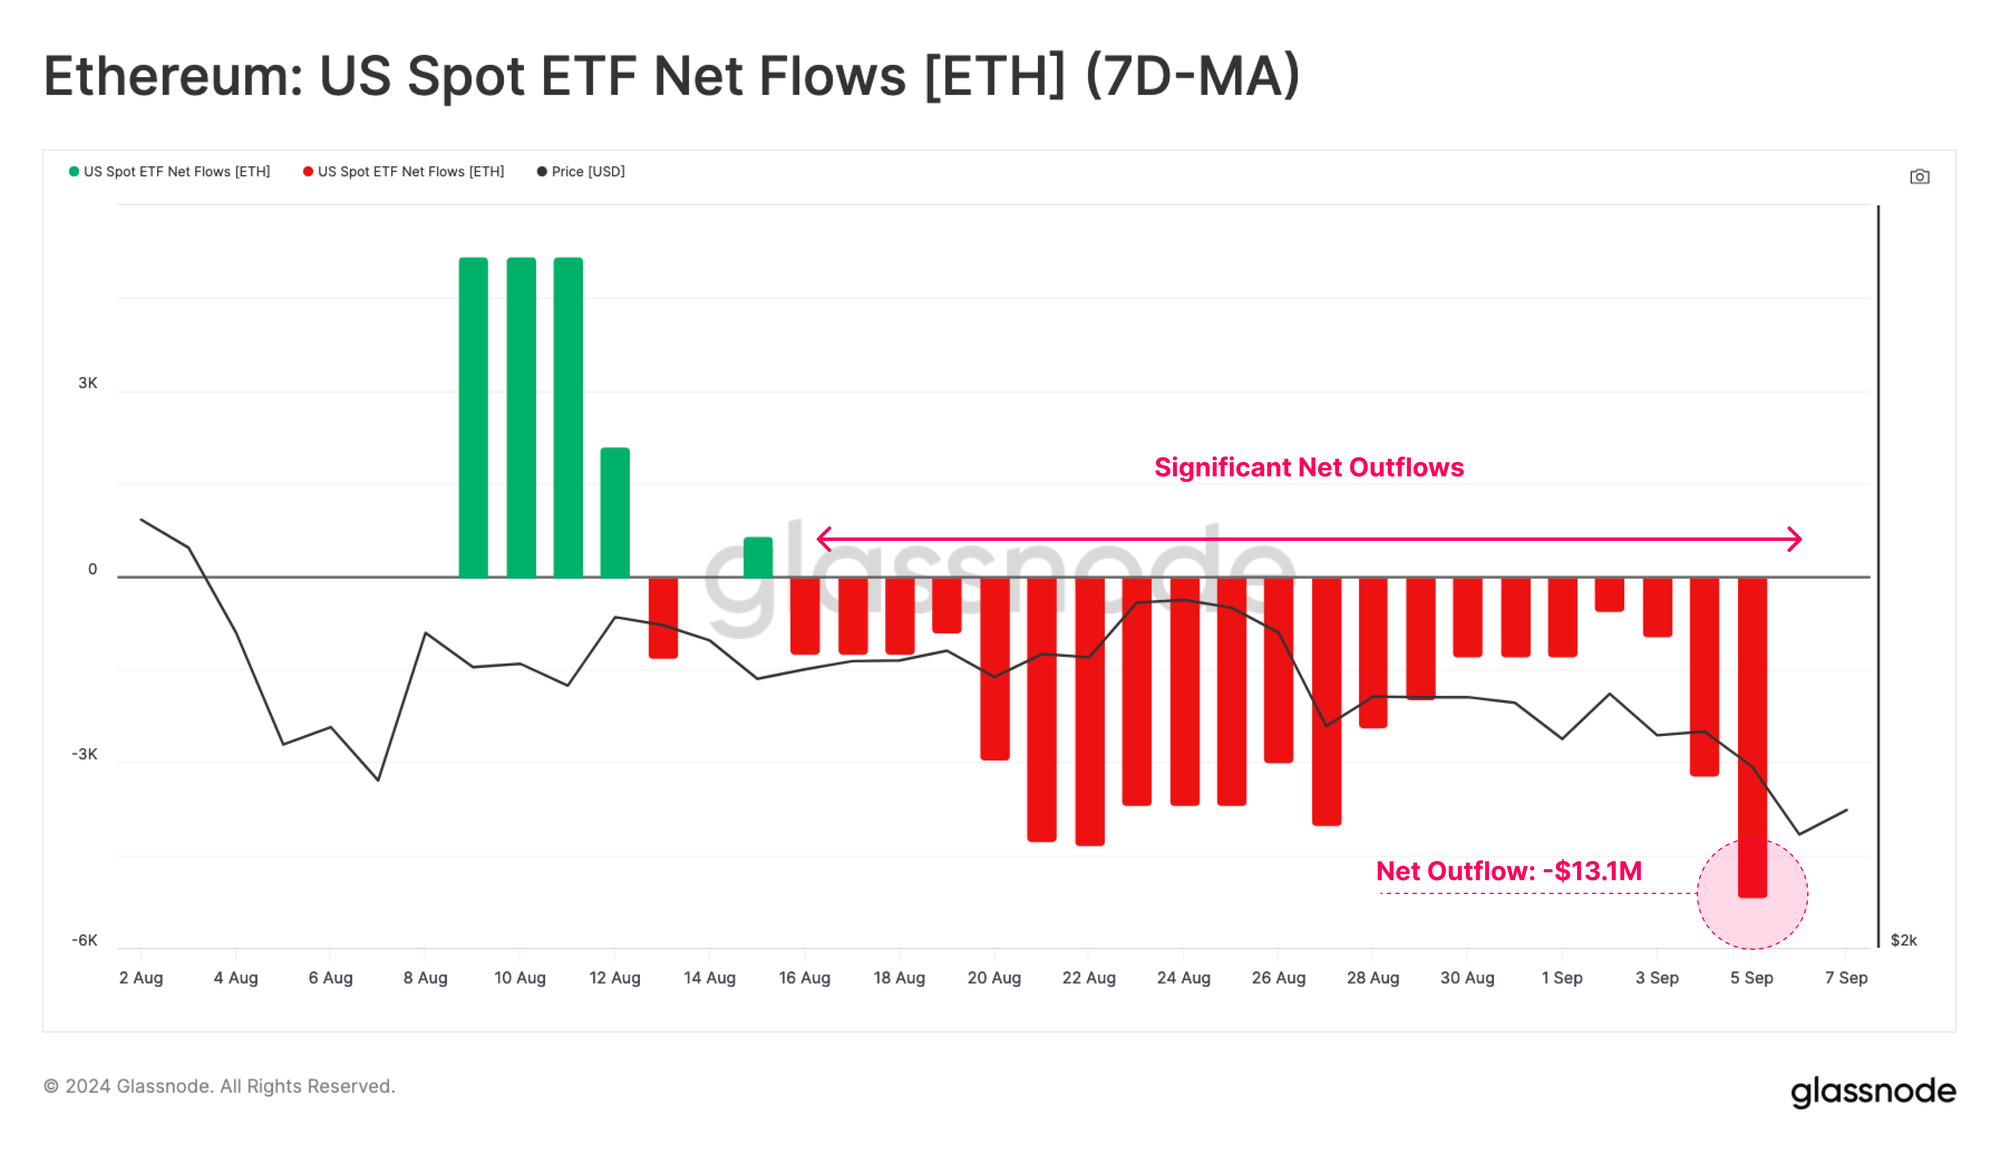
Demand for the more recent Ethereum ETFs has been relatively tepid, experiencing a net negative outflow. This is driven primarily by redemptions from the Grayscale ETHE product, which has not been counterbalanced by sufficient inflow demand across the other instruments.
On aggregate, the Ethereum ETFs have experienced a total outflow of $-13.1M. This highlights a disparity in the magnitude of demand between BTC and ETH, at least within the context of current market conditions.
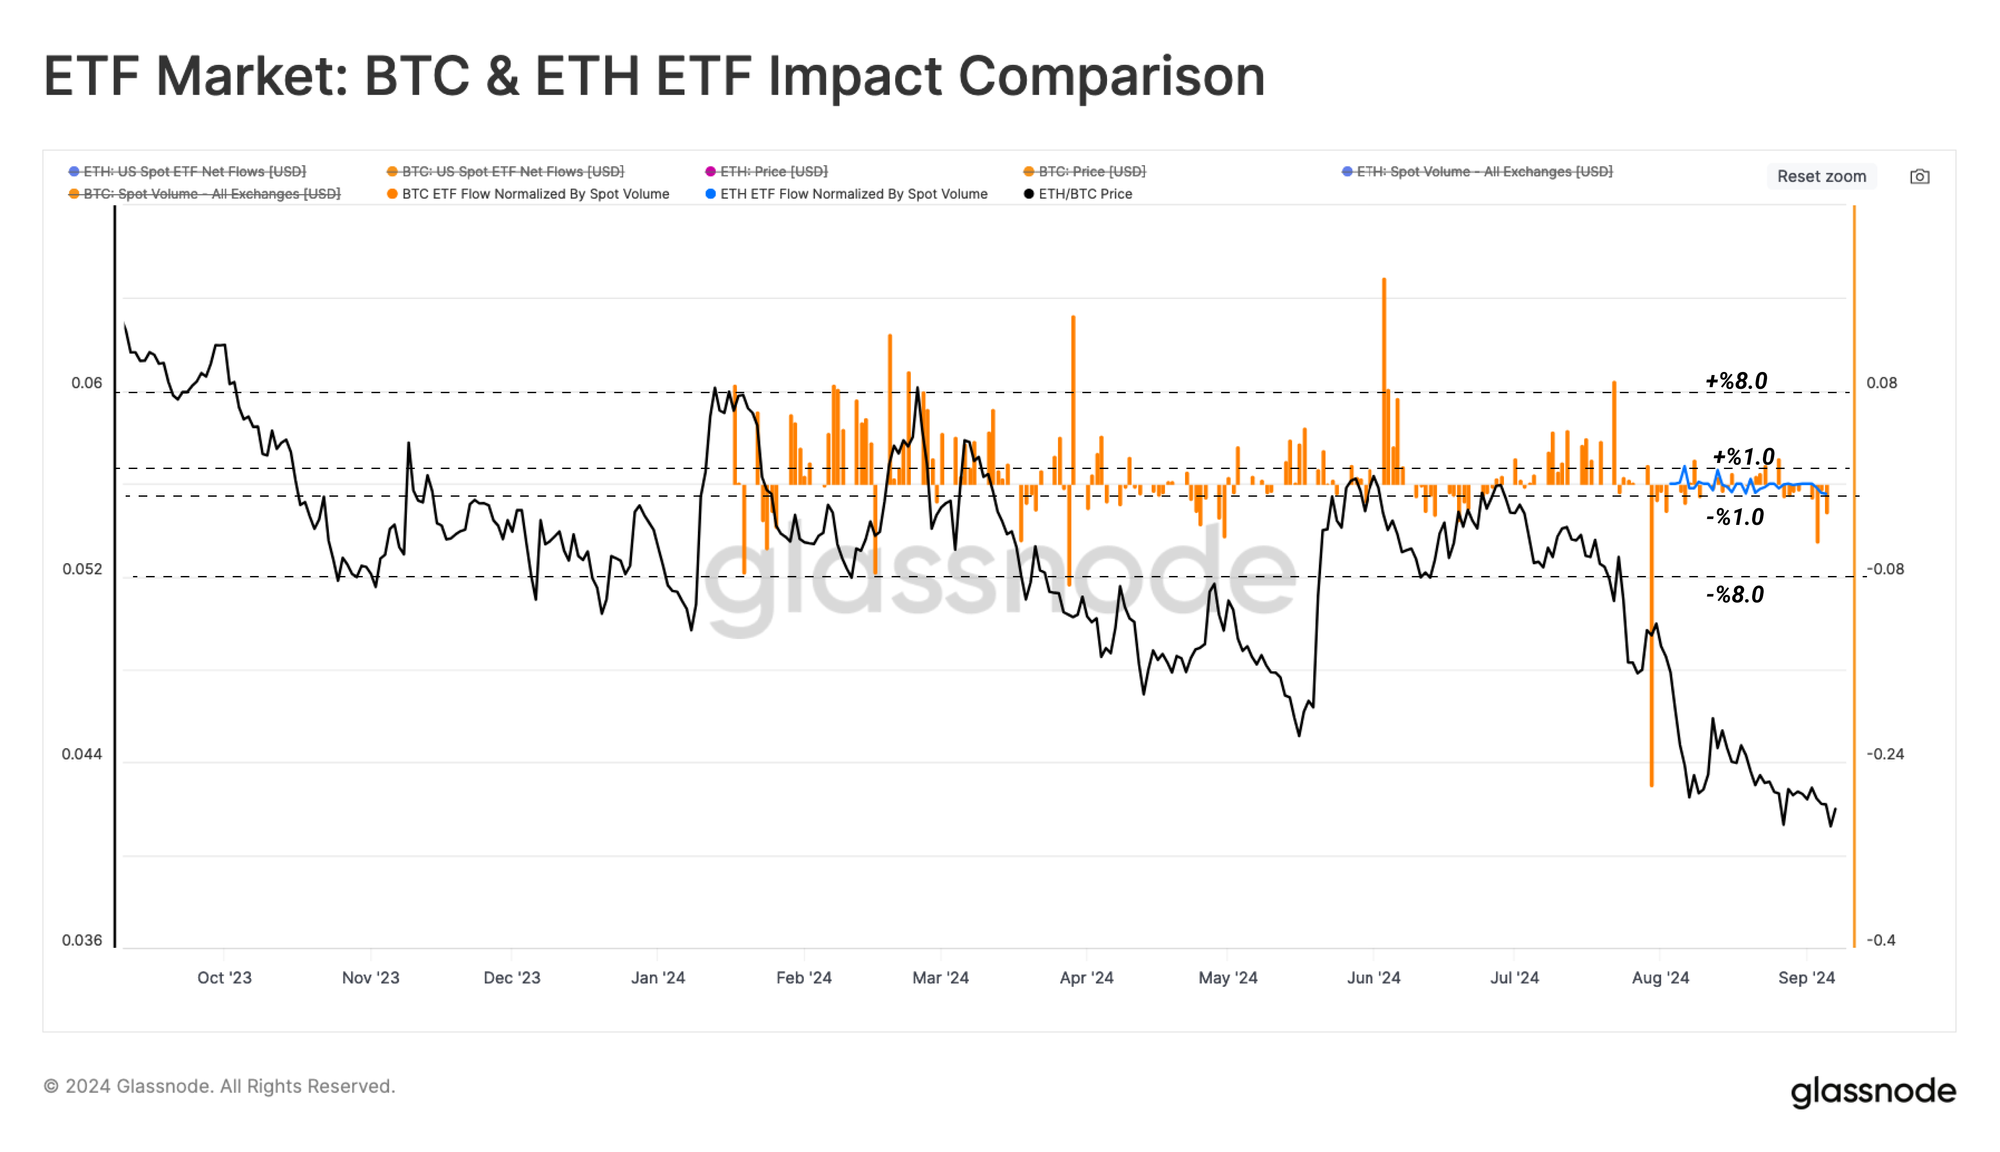
To approximate the impact of the ETFs on the Bitcoin and Ethereum markets, we have normalized the bias in ETF netflow volume by the corresponding Spot Volumes. This ratio enables us to directly compare the relative weight of ETFs in each market.
As shown in the chart below, the relative influence of ETFs on the Ethereum market is equivalent to a maximum of 1.7% of the spot volume, compared to a maximum of 17% for the Bitcoin ETF. This suggests that despite normalization, the appetite for the Bitcoin ETF remains an order of magnitude larger than its Ethereum counterpart.
Summary and Conclusion
Miners continue to demonstrate immense conviction in the Bitcoin Network with the Hash Rate just shy of ATHs despite collapsing revenues. However, as Miners tend to be pro-cyclical, being sellers during drawdowns, and HODLers during uptrends, a degree of sell-side pressure can be expected in the event of further drawdowns.
Alongside this, Investor interaction with exchanges continue to fall, with contracting volumes across the board, suggesting there is a diminished appetite for investors, and trade. This is also apparent across the Institutional landscape with both the Bitcoin and Ethereum ETFs exhibiting net outflows.
Disclaimer: This report does not provide any investment advice. All data is provided for information and educational purposes only. No investment decision shall be based on the information provided here and you are solely responsible for your own investment decisions.
Exchange balances presented are derived from Glassnode’s comprehensive database of address labels, which are amassed through both officially published exchange information and proprietary clustering algorithms. While we strive to ensure the utmost accuracy in representing exchange balances, it is important to note that these figures might not always encapsulate the entirety of an exchange’s reserves, particularly when exchanges refrain from disclosing their official addresses. We urge users to exercise caution and discretion when utilizing these metrics. Glassnode shall not be held responsible for any discrepancies or potential inaccuracies. Please read our Transparency Notice when using exchange data.
- Join our Telegram channel
- For on-chain metrics, dashboards, and alerts, visit Glassnode Studio
- For automated alerts on core on-chain metrics and activity on exchanges, visit our Glassnode Alerts Twitter