Strategy Watch #5

insights.glassnodePublié le 2026-06-26Dernière mise à jour le 2026-06-26

Résumé

Strategy Watch #5 analyzes institutional digital asset trends in May, highlighting diverging flows. While corporate treasuries continued accumulating Bitcoin (BTC) and Ethereum (ETH), spot ETF investors reduced exposure. Market-neutral strategies benefited as CME basis yields turned positive, reviving cash-and-carry trades. A deep dive into DeFi notes that while outflows slowed, total value locked (TVL) continued declining. The report also covers fund performance, on-chain vault yields, manager positioning as cash balances rise, and new institutional expansion initiatives.

The full report is freely available in PDF format.

Download PDF version

Welcome to Strategy Watch #4

Strategy Watch was built to address a clear demand for high-signal, impartial analysis of fund-level performance and allocation trends in digital assets.

Our objective is straightforward — to make Strategy Watch a must-read monthly publication for the digital asset investment community.

This publication is strengthened by direct input from market participants. Funds and allocators that contribute data and insights help shape a more complete and valuable view of the landscape. If you have insights, data, or allocation updates worth sharing, we welcome your contribution.

Present your latest initiatives and updates to a curated audience of institutional allocators.

Share updates ↗

Inside the Latest Strategy Watch

The report is structured across six core sections, each focused on a distinct dimension of institutional activity in digital assets:

01 Institutional Flow Monitor | Institutional demand split by vehicle in May. ETF allocators reduced exposure while digital asset treasuries kept accumulating. What does this divergence signal for allocator positioning?

02 Fund and SMA Performance | Market-neutral strategies kept compounding gains, while the strongest directional returns came from stock selection rather than market beta.

03 Strategy Deep Dive: DeFi/Yield | A CIO's perspective on why fundamentals matter more than ever, and where the next wave of crypto value creation will accrue.

04 On-chain Vault Performance | On-chain credit continues to stabilize, but can vault yields compete with Treasury rates and native ETH staking?

05 Manager Monitor | Find out how managers are positioning as cash balances rise and fundraising conditions remain subdued.

06 Allocation Updates | Institutional expansion continued through new investment firms, dedicated crypto divisions, and quant fund launches.

in partnership with

The Premier Digital Assets Allocator Platform. Learn more


Institutional Flow Monitor

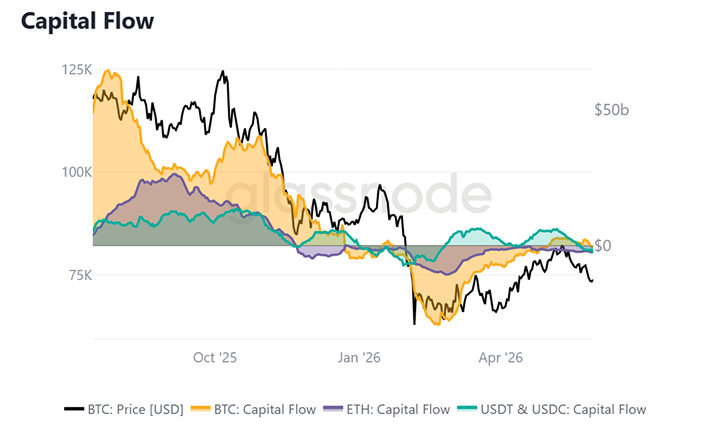
  • Bitcoin flows hovered near neutral while Ethereum outflows deepened and stablecoin inflows reversed sharply into month-end.

April's tentative stabilization carried into May for Bitcoin alone. BTC flows held close to neutral, spiking to +$2.9B on May 07 before drifting back to -$0.3B at the close. Ethereum again diverged, deepening from -$1.7B to a -$2.4B trough late in the month before ending at -$2.1B. The sharper signal came from stablecoins, which reversed from a +$6.1B peak early in May to -$2.5B by month-end, a decisive swing into net outflow. That rotation out of dollar liquidity points to allocators trimming risk into June rather than redeploying into spot.
ETF & DAT Net Flows

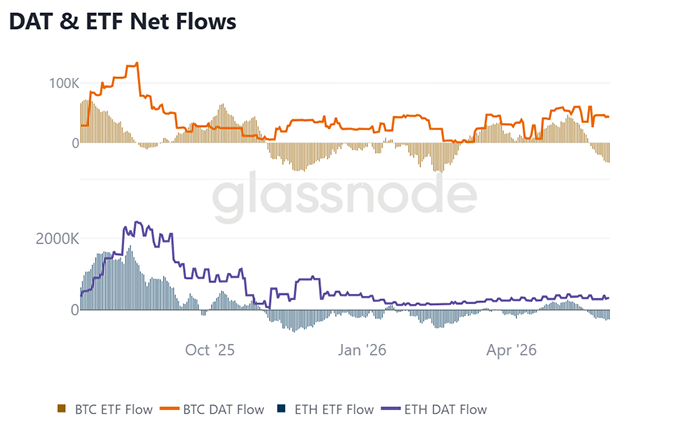
  • Spot ETF flows for both Bitcoin and Ethereum swung from early-month highs into outflows while treasury vehicles kept accumulating.

Institutional demand split by vehicle in May. Spot ETF flows peaked early, with Bitcoin at +46.8k BTC and Ethereum at +283.4k ETH on May 05, before both rolled over into net redemptions, closing at -33.1k BTC and -261.5k ETH as ETF outflows reached a monthly record. Digital asset treasuries told the opposite story and stayed positive throughout. BTC DAT flows held between +26.1k and +60.4k BTC, ending at +42.9k, while ETH DAT flows ran from +302.4k to +439.2k ETH before settling at +330.8k. The divergence suggests balance-sheet buyers kept accumulating into weakness even as ETF allocators de-risked.
DeFi TVL & Stablecoin Cap

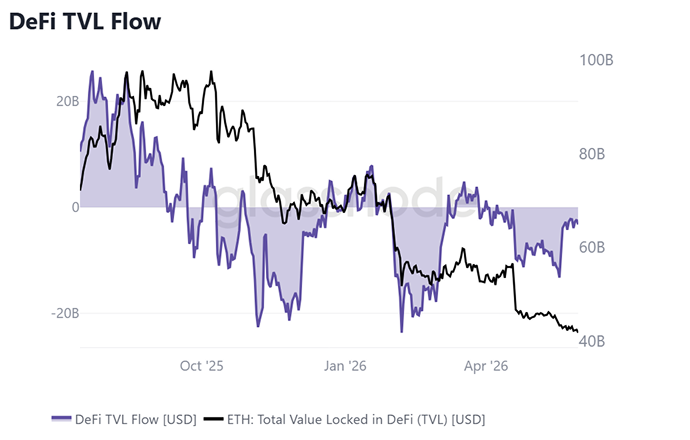
  • Ethereum DeFi TVL ground to new monthly lows even as the pace of net outflows eased through the second half of May.

The contraction that followed April's lending exploit persisted through May, though its intensity faded. Ethereum TVL slipped from $45.1B to $41.7B, closing at the monthly low after peaking at $46.1B on May 11. The flow picture was more constructive than the level implied. Thirty-day net flows stayed negative throughout but recovered from a -$13.3B trough on May 18 to -$3.2B by month-end, the shallowest outflow pace since the exploit. The combination of a falling TVL base alongside decelerating outflows suggests the forced deleveraging phase is largely complete, though fresh inflows remain absent.
CME Basis Yield

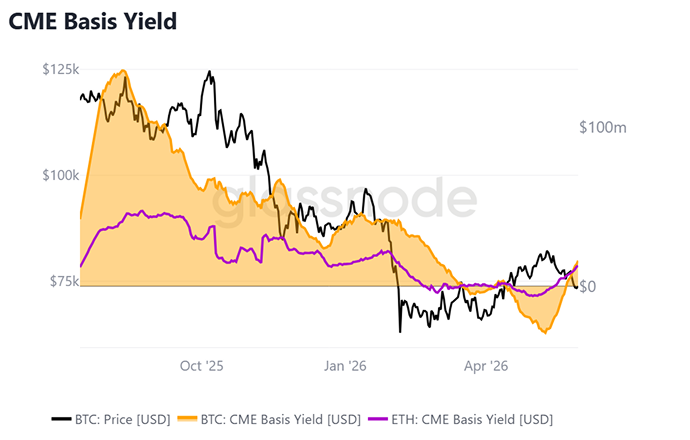
  • CME basis yields for both Bitcoin and Ethereum climbed back into positive territory through May, reviving the cash-and-carry trade.

Here we measure the return available to institutions running cash-and-carry trades. After April left both curves in backwardation, May delivered a clean reversal. BTC basis yield bottomed at -$29.3M on May 09 before rising steadily to +$16.0M, the monthly high reached at the close. ETH followed the same path, recovering from -$6.2M at the open to +$12.8M by month-end. Both series finished May at their peaks, with futures reclaiming a premium to spot for the first time since March. The rebuild restores a positive carry to market-neutral strategies, and a continuation into June would mark the firmest premium environment in several months.


Disclaimer: This report does not provide any investment advice. All data is provided for information and educational purposes only. No investment decision shall be based on the information provided here and you are solely responsible for your own investment decisions.
Exchange balances presented are derived from Glassnode’s comprehensive database of address labels, which are amassed through both officially published exchange information and proprietary clustering algorithms. While we strive to ensure the utmost accuracy in representing exchange balances, it is important to note that these figures might not always encapsulate the entirety of an exchange’s reserves, particularly when exchanges refrain from disclosing their official addresses. We urge users to exercise caution and discretion when utilizing these metrics. Glassnode shall not be held responsible for any discrepancies or potential inaccuracies. Please read our Transparency Notice when using exchange data.

Questions liées

QWhat is the primary objective of the Strategy Watch publication, and how does it seek to strengthen its content?

AThe primary objective of Strategy Watch is to become a must-read monthly publication for the digital asset investment community by providing high-signal, impartial analysis of fund-level performance and allocation trends. It is strengthened by direct input and contributions of insights and data from funds and allocators.

QAccording to the report, how did the demand for Bitcoin and Ethereum ETFs versus Digital Asset Treasuries (DATs) diverge in May?

AIn May, demand diverged significantly. ETF flows for both Bitcoin and Ethereum peaked early before rolling over into net outflows. Conversely, Digital Asset Treasuries (DATs) kept accumulating throughout the month, with BTC and ETH DAT flows staying positive. This suggests balance-sheet buyers accumulated assets while ETF allocators were de-risking.

QWhat trend was observed in the CME basis yields for Bitcoin and Ethereum in May, and what is its significance?

AIn May, CME basis yields for both Bitcoin and Ethereum climbed from negative territory back into positive territory, reviving the cash-and-carry trade. This reversal restores a positive carry to market-neutral strategies, marking the firmest premium environment in several months.

QWhat is the current state of Ethereum DeFi Total Value Locked (TVL) based on the May data, and how did the outflow trends change?

AEthereum DeFi TVL continued to decline in May, grinding to new monthly lows, slipping from $45.1B to $41.7B. However, the pace of net outflows decelerated through the second half of the month, recovering from a -$13.3B trough to -$3.2B by month-end, suggesting the forced deleveraging phase is largely complete.

QWhat sharp signal from stablecoin flows did the report highlight as a key indicator of allocator behavior in late May?

AThe report highlighted that stablecoin inflows reversed sharply into month-end, swinging from a +$6.1B peak early in May to a -$2.5B net outflow by month-end. This decisive swing into net outflow points to allocators trimming risk into June rather than redeploying capital into spot markets.

Lectures associées

Mining illégal en Russie : pourquoi les fermes domestiques sont faciles à détecter

L'extraction illégale de cryptomonnaies (minage) devient de plus en plus risquée dans les régions où elle est interdite, notamment en Russie. Les compagnies d'électricité détectent facilement ces activités grâce à une consommation d'énergie anormale dans les logements : une charge électrique stable et quasi continue, typique des fermes de minage domestiques. Elles signalent ces anomalies aux services fiscaux et au parquet. Actuellement, une responsabilité administrative ou pénale spécifique au minage est en cours d'adoption mais pas encore pleinement effective. En attendant, les contrevenants sont poursuivis pour des infractions existantes : branchement illégal, consommation non comptabilisée, préjudice aux fournisseurs d'énergie et fraude fiscale. Les équipements peuvent être saisis et les revenus du minage, même illégaux, restent imposables. Le minage n'est légal que dans les zones sans interdiction, avec un contrat d'électricité approprié et une déclaration des revenus aux impôts. Les interdictions sont déjà en vigueur jusqu'au 15 mars 2031 dans plusieurs régions, dont Moscou, certaines zones du Caucase, de Sibérie et les territoires ukrainiens annexés, afin de préserver le réseau électrique. En résumé, la consommation énergétique caractéristique et constante des fermes domestiques les rend très détectables, entraînant des vérifications, des amendes, des poursuites et des obligations fiscales pour les opérateurs illégaux.

cryptonews.ruIl y a 13 mins

Mining illégal en Russie : pourquoi les fermes domestiques sont faciles à détecter

cryptonews.ruIl y a 13 mins

$15 000 en une semaine : le bitcoin enregistre sa plus forte hausse de tous les temps

Le Bitcoin a clôturé la semaine au-dessus de 77 700 $, enregistrant une hausse de 15 000 $ - sa plus forte progression hebdomadaire en dollars de toute son histoire, soit une augmentation de 23,8%. Ce rallye a été déclenché par l'annonce du Trésor américain d'élargir son programme de rachat de bonds, transformant l'apathie des investisseurs en FOMO. L'indice de peur et de cupidité a atteint 78 points, proche de l'« extrême cupidité ». Les ETF spot sur Bitcoin ont enregistré un afflux net de capitaux de 1,9 milliard de dollars, le plus important depuis octobre 2025. Matt Cole, PDG de Strive, estime que la dynamique du Bitcoin face au dollar et à l'or indique que le prochain cycle pourrait être le plus fort jamais vu. Il souligne une demande croissante pour les actifs rares comme l'or, l'argent et le Bitcoin dans un monde d'abondance créé par l'IA. Le cours du Bitcoin par rapport à l'or a atteint un sommet depuis mai, à 16,73 onces par pièce. Cole note que la percée explosive simultanée face aux deux actifs est cruciale. Bien qu'optimiste structurellement, il n'exclut pas un recul à court terme, mais s'attend à des rachats agressifs. L'élan haussier pourrait se poursuivre à court terme, porté par les entrées dans les ETF et une amélioration de la liquidité macro. L'avancée possible du CLARITY Act en septembre pourrait renforcer la confiance institutionnelle. Les analystes soulignent qu'une telle impulsion soudaine résulte généralement d'une combinaison de couvertures de positions courtes, de demande spot et d'activité sur les dérivés. Un rallye porté par la demande spot offre une base plus solide qu'un mouvement alimenté par l'effet de levier, ce dernier rendant le marché vulnérable à un brusque renversement. Une analyse IA met en garde contre la vitesse du mouvement, rappelant la chute soudaine de février alimentée par les liquidations de positions à effet de levier. La corrélation actuelle avec l'or et l'argent pose question, surtout si les rendements obligataires devaient inverser leur tendance.

cryptonews.ruIl y a 24 mins

$15 000 en une semaine : le bitcoin enregistre sa plus forte hausse de tous les temps

cryptonews.ruIl y a 24 mins

Trading

Spot
活动图片