Latest Stablecoin Report: Real Distribution and Flow Are Far More Important Than Supply

marsbitPublié le 2026-02-27Dernière mise à jour le 2026-02-27

Résumé

A new report on stablecoins emphasizes that real-world distribution, holder concentration, and on-chain activity are more meaningful than total supply figures. While the total supply of the top 15 stablecoins reached $304 billion in January 2026, a 49% year-on-year increase, the data reveals deeper insights. USDT and USDC dominate with 89% market share. However, challenger stablecoins like USDS, PYUSD, and RLUSD saw explosive growth. On-chain analysis shows 800 billion held on centralized platforms, while whale wallets hold $39 billion. Concentration is extreme for newer stablecoins; for example, the top 10 wallets hold 90% of USDS and 99% of USDF. Monthly transfer volume hit $10.3 trillion in January 2026, with USDC processing nearly five times more volume than USDT despite a smaller supply. Activity is heavily concentrated in DeFi: $5.9 trillion in DEX liquidity operations and $1.3 trillion in flash loans. Velocity varies widely: USDC on Base moves 14x daily, while large portions of USDT on Ethereum remain idle. The data shows stablecoins are primarily used for trading, leverage, and liquidity, not just as passive holdings.

Author | @Dune

Compiled by | Odaily Planet Daily (@OdailyChina)

Translator | DingDang (@XiaMiPP)

Editor's Note: While the market is still accustomed to using "total supply" to summarize the stablecoin world, a set of more granular data is revealing another layer of reality. A single supply figure can only answer "how much," but it cannot explain "who holds it," "how it flows," or "why it stays." When we observe supply scale, holding concentration, on-chain circulation velocity, and specific activity categories on the same map, what we see is no longer a static stock but a dynamic structure of how capital migrates, settles, leverages, and reprices on-chain.

This perspective is important because it may correct our intuitive judgments about the past year. The crypto market's weakness and the strong performance of U.S. stocks form a stark contrast. The panic amplified by whales selling and price retracements easily gives the impression that capital is fleeing the crypto world. However, the on-chain data presented in this article, along with signals released by Circle's recent financial report, suggest that the funds may not have disappeared; they may have just temporarily withdrawn from high-volatility risk assets. At the very least, on-chain data proves they are entering incentive-based activities rather than being used for trading demand.
Everyone quotes that supply number. It appears in every report, every earnings call, and every policy hearing. But beyond "a circulating scale of over $300 billion," how much do we really know about stablecoins?

Who holds them? How concentrated are the holdings? How fast do they circulate, and on which chains are they mainly active? What are they actually used for—as DeFi liquidity, payment tools, or simply "cash equivalents" for parking funds?

Meta just announced plans to integrate third-party stablecoin payments into its platform; the OCC (Office of the Comptroller of the Currency) approved a national trust bank charter for Stablecoin; Payoneer announced stablecoin functionality for 2 million businesses; Anchorage Digital launched compliant stablecoin services for non-U.S. banks. Institutions and regulators are accelerating their entry, and the answers they need clearly go beyond just a supply number.

We used the latest stablecoin dataset released by Dune—developed in collaboration with Steakhouse Financial—to answer some of these questions. Here are the results revealed by the data.

Supply Overview

As of January 2026, the fully diluted supply of the top 15 stablecoins on EVM, Solana, and Tron reached $304 billion, a year-on-year increase of 49%. Tether's USDT ($197 billion) and Circle's USDC ($73 billion) still dominate with an 89% market share.

Looking at chain distribution, Ethereum carries $176 billion (58%), Tron $84 billion (28%), Solana $15 billion (5%), and BNB Chain $13 billion (4%). Even though the total supply has nearly doubled, this on-chain distribution structure has seen almost no significant change over the past year.
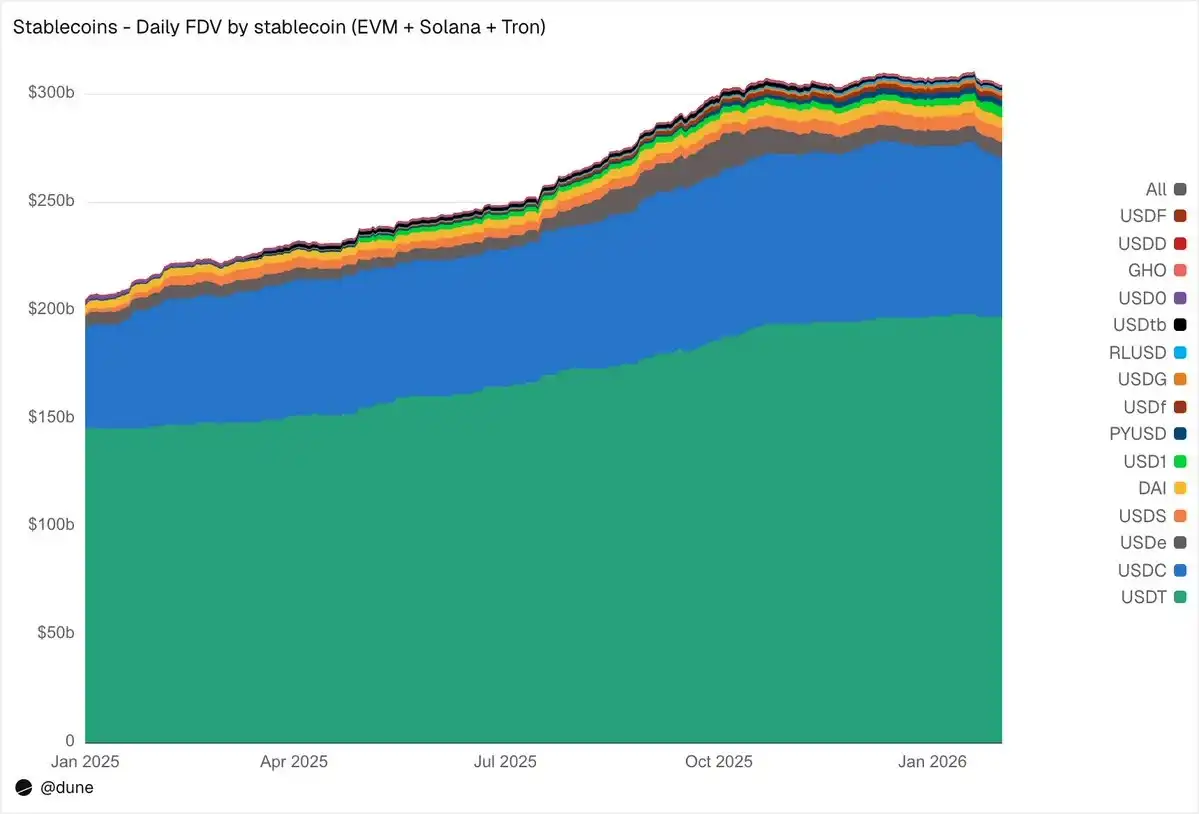
But beneath the top two stablecoins, 2025 was a year of challenger rise. USDS (Sky/MakerDAO) grew 376% to $6.3 billion; PYUSD (PayPal) grew 753% to $2.8 billion; RLUSD (Ripple) jumped from $58 million to $1.1 billion, a staggering increase of 1803%; USDG expanded 52 times; USD1 grew from zero to $5.1 billion.

Of course, not all challengers moved in the same direction. USD0 fell 66%; Ethena's USDe nearly tripled at its October peak, ending the year up 23%. Even so, the competitive layer beneath USDT and USDC has seen a significant increase in the number of competitors.

Who Holds Them?

Most stablecoin datasets can only tell you the total supply. Because our dataset tracks balances at the wallet level and incorporates address labels, we can answer a more critical question: Who is holding these stablecoins?
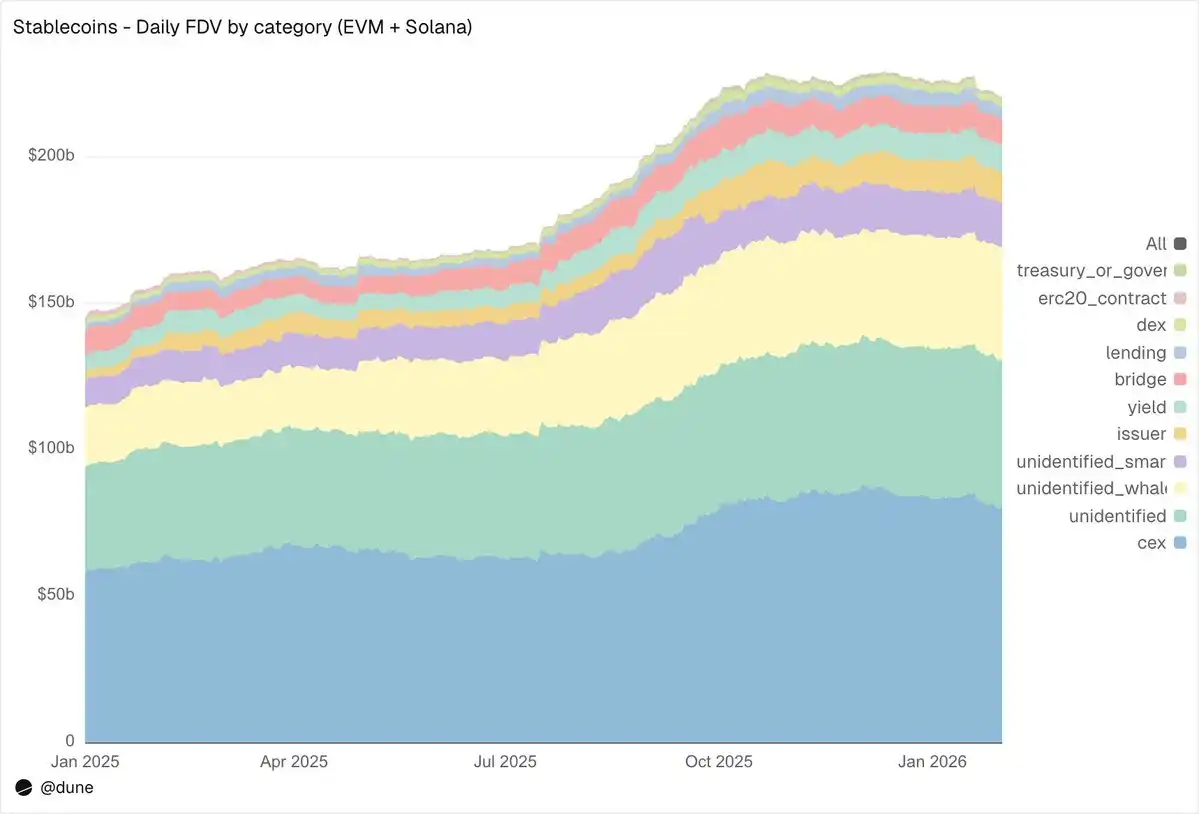
In the EVM and Solana ecosystems, centralized exchanges are currently the largest identified category, holding $80 billion, up from $58 billion a year ago. Stablecoins are, first and foremost, the infrastructure for exchange trading and settlement.

Whale wallets hold $39 billion; holdings in yield protocols almost doubled to $9.3 billion, reflecting the growth of on-chain yield strategies; issuer addresses—including treasuries and minting/burning contracts—jumped from $2.2 billion to $10.2 billion, a 4.6x increase, directly reflecting the scale of new supply entering the market.

Regarding label quality: Only 23% of the supply is in completely unidentified addresses. For on-chain data, this is a fairly high identification rate—and it is crucial for understanding where stablecoin risk is actually distributed.

172 Million Holders, But Extremely Concentrated

As of February 2026, a total of 172 million unique addresses held at least one of these 15 stablecoins. USDT accounts for 136 million, USDC for 36 million, and DAI for 4.7 million. The distribution of these three stablecoins is very wide: The top 10 wallets hold only 23%–26% of the supply, with an HHI (Herfindahl-Hirschman Index, where 0 represents perfect dispersion and 1 represents a single holder) below 0.03.
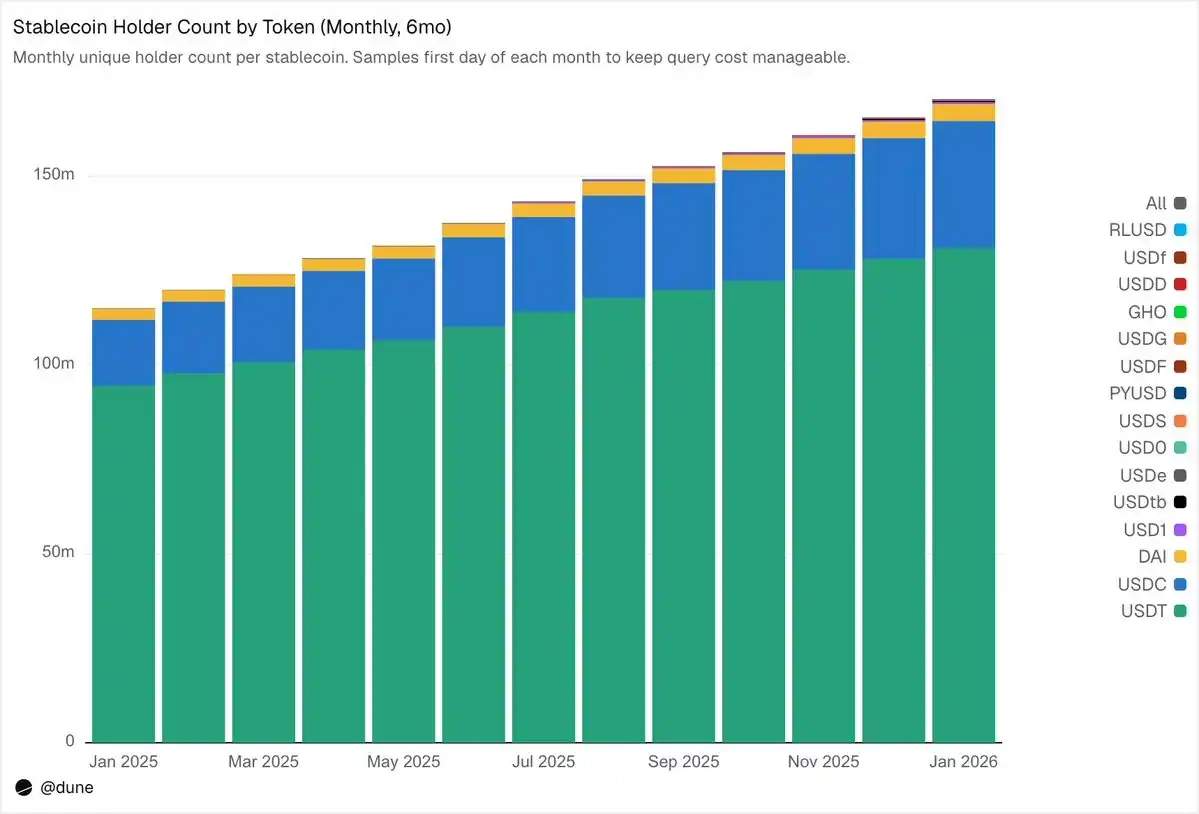
Other stablecoins present a completely different picture. The top 10 wallets often control 60% to 99% of the supply. Taking USDS as an example, although its circulating scale is $6.9 billion, 90% of it is concentrated in 10 wallets (HHI 0.48). USDF's concentration is even higher, with the top 10 addresses holding 99% of the supply (HHI 0.54). As for USD0, it almost reaches an extreme: again, 99% is concentrated in the top 10 wallets, but the HHI is as high as 0.84, meaning even within these top ten, the supply is dominated by one or two addresses.

This does not mean these stablecoins are inherently flawed—some projects are relatively new, and some are designed for institutional clients from the start. But it does mean their "supply" numbers cannot be interpreted in the same way as USDT or USDC. Holding concentration directly impacts de-pegging risk, liquidity depth, and whether the so-called "supply scale" represents real organic demand or merely reflects the allocation behavior of a few large holders. This kind of analysis is only possible when you have the balance data of every holder, not just the aggregate supply derived from minting/burning events.

January 2026: Transfer Volume $10.3 Trillion

In January 2026, the total transfer volume of stablecoins within the EVM, Solana, and TRON ecosystems reached $10.3 trillion, more than double that of January 2025.

The on-chain distribution contrasts sharply with the supply structure: Base led with $5.9 trillion, despite having a supply of only $4.4 billion; Ethereum had $2.4 trillion; Tron had $682 billion; Solana had $544 billion; BNB Chain had $406 billion.
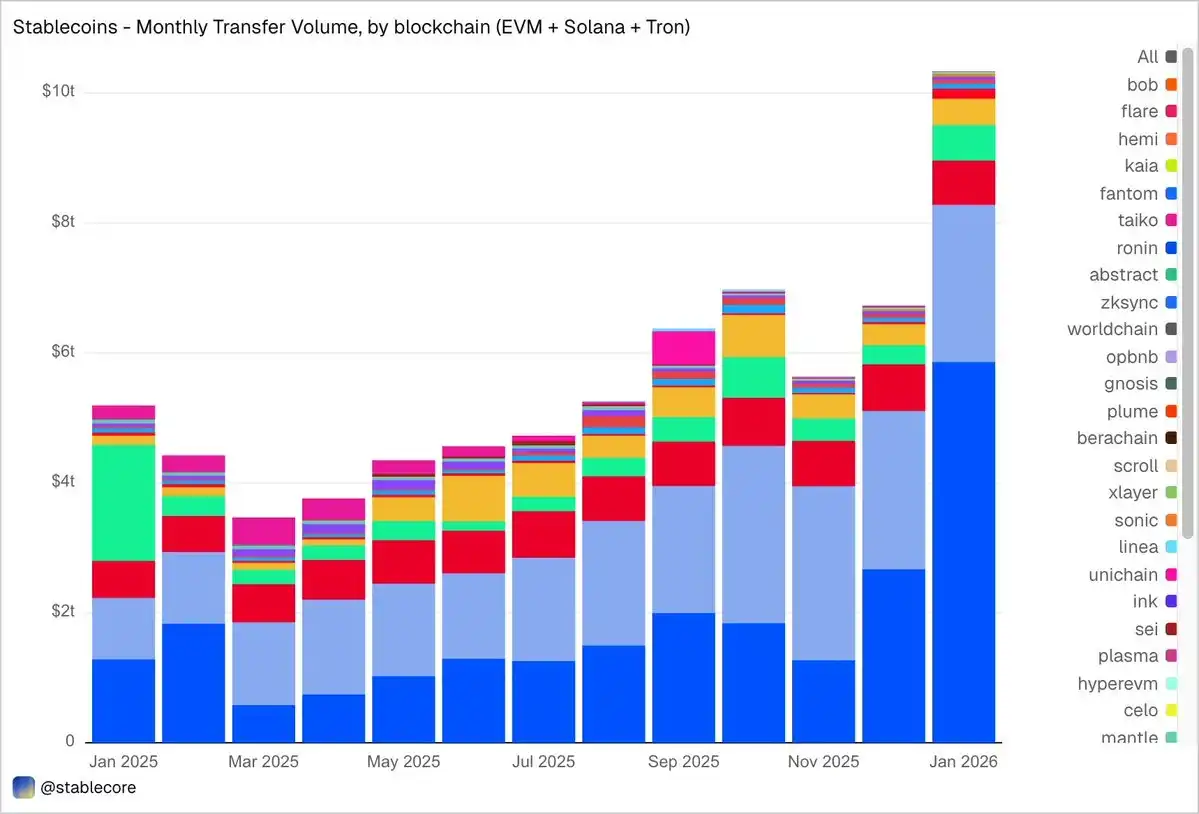
By token, USDC dominated with $8.3 trillion—almost 5 times that of USDT ($1.7 trillion)—even though its supply is only about 1/2.7 of the latter. USDC clearly circulates faster and more frequently. DAI had $138 billion, USDS had $92 billion, and USD1 had $43 billion.

It's important to emphasize that this data is deliberately objective and neutral. The dataset does not pre-filter "real" economic activity based on a fixed standard, so the total volume may include flows generated by automated behaviors like arbitrage, bots, and internal routing. We don't hardcode judgment into the data but provide an objective perspective, allowing users to choose their own filtering methods—whether to exclude bot transactions, identify organic usage, or define transaction activity metrics that better reflect the actual situation.

What Are Stablecoins Actually Doing?

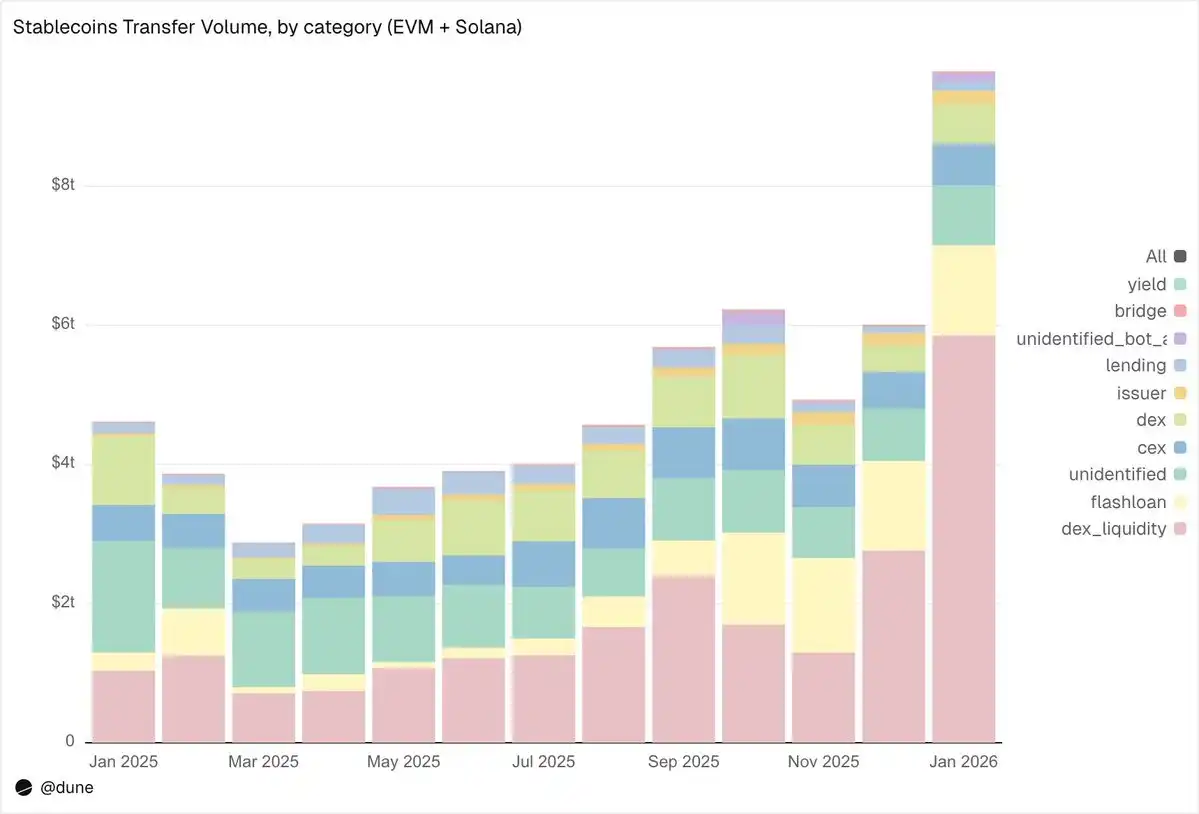
This is where the granularity advantage of this dataset truly shines. Transfers are not simply labeled as "amount" but are categorized into different activity types based on the on-chain triggering mechanism. This means we not only know "$10 trillion flowed" but also "why it flowed."
1. Market Infrastructure (DEX Trading & Liquidity)

  • DEX Liquidity Supply & Withdrawal: $5.9 trillion—The largest application, reflecting the role of stablecoins as base assets for on-chain market making.
  • DEX Swaps: $376 billion—Direct trading activity on automated market makers.

Together, they indicate that stablecoins are primarily trading collateral and liquidity infrastructure. Interestingly, the volume is more concentrated in incentive-driven liquidity mining and active capital optimization activities rather than pure trading demand.

2. Leverage & Capital Efficiency (Lending + Flash Loans)

  • Flash Loans (Borrow and Repay): $1.3 trillion—Automated arbitrage and liquidation loops.
  • Lending Activities (Deposit, Lend, Repay, Withdraw): $137 billion—Represents the on-chain short-term capital efficiency and structured credit layer.

3. On/Off Ramps (CEX & Bridges)

  • CEX Flows—Deposits ($224 billion), Withdrawals ($224 billion), Internal Transfers ($151 billion): Total $599 billion.
  • Bridge Deposits/Withdrawals: $28 billion—Shows the function of stablecoins as settlement channels between cross-chain and centralized platforms.

4. Issuance Layer (Monetary Operations)

  • Issuer Operations—Minting ($28 billion), Burning ($20 billion), Peg Rebalancing ($23 billion), and other operations: Total $106 billion, nearly 5 times the $42 billion a year ago.

5. Yield Protocols

  • Yield Protocol Activity: $2.7 billion—Small in scale but significant in structured strategies and on-chain asset management.

Overall, 90% of the transfer volume flows through identified activity categories, providing us with a fine-grained view across all layers of the entire on-chain stack.

Velocity of Circulation: Same Coin, Different Worlds

Daily Velocity of Circulation (Volume divided by Supply) is perhaps the most overlooked metric in stablecoin analysis. It reveals whether a stablecoin is actively used as a medium of exchange or merely held.

Among the tokens we analyzed, USDC and USDT stand out again, but exhibit different characteristics.
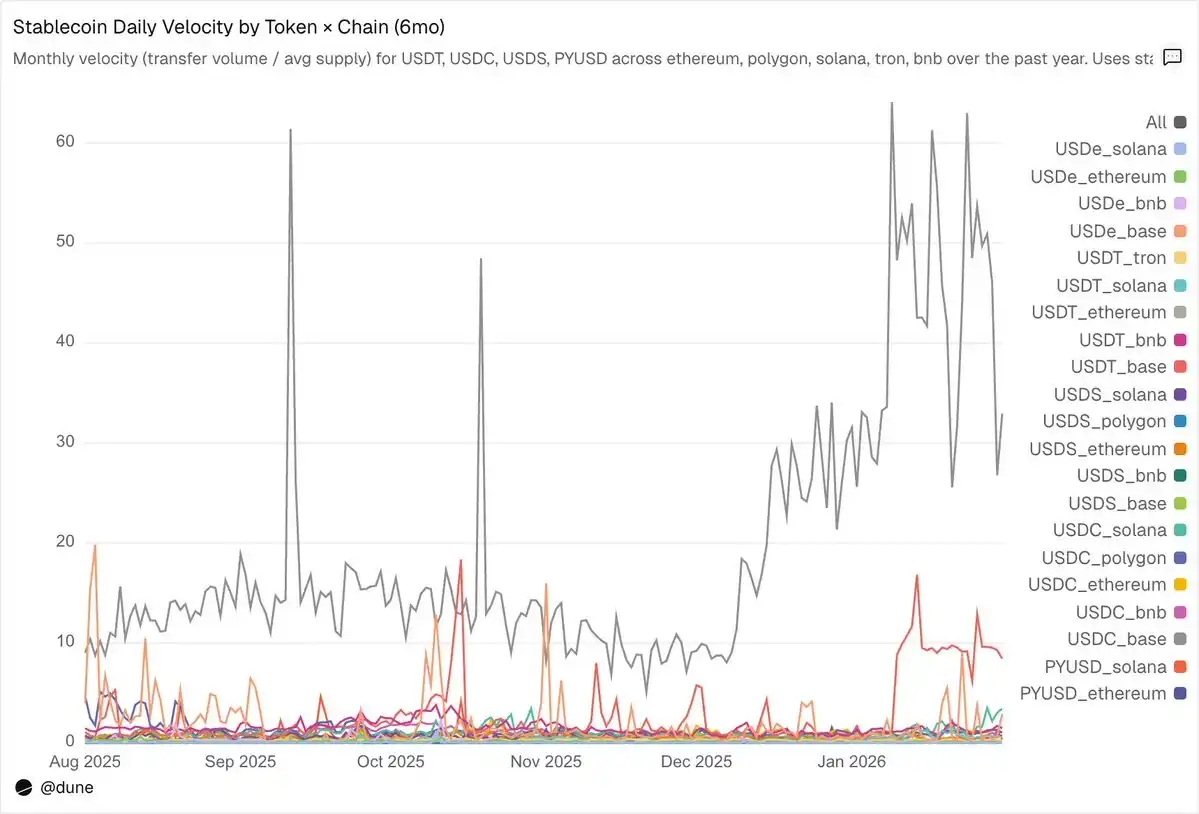
USDC circulates fastest on L2 and Solana. On Base, USDC's average daily velocity reaches 14x—an astonishing figure driven by high-frequency DeFi activity; on Solana and Polygon, it's about 1x; on Ethereum, it also reaches 0.9x, meaning almost the entire supply turns over daily.

USDT is fastest on BNB Chain and Tron. It reaches 1.4x on BNB Chain, reflecting active trading; on Tron, it's 0.3x, the volume is lower but exceptionally stable, consistent with its role as a main channel for cross-border payments. On Ethereum, however, USDT is only 0.2x, with over $100 billion of supply mostly sitting idle.

USDe and USDS are slower, but by design. USDe's average daily velocity on Ethereum is only 0.09x; USDS is 0.5x. Both are yield-bearing stablecoins: USDe is often staked as sUSDe to capture收益 from Ethena's delta-neutral strategy; USDS is deposited into Sky's savings rate mechanism to obtain protocol-subsidized yields. Therefore, a large portion of the supply remains in savings contracts, lending markets like Aave, or structured yield loops. Low velocity here is not a flaw but a feature—these assets are designed to accumulate yield, not to circulate frequently.

Chain differences are often more important than the token itself. The same PYUSD has a daily velocity of 0.6x on Solana, four times its velocity on Ethereum (0.1x). The same token exhibits completely different usage patterns in different ecosystems.

Supply and transfer volume each tell part of the story, while velocity connects the two—it reveals whether the stablecoin on a given chain is active infrastructure or sleeping capital.


Cryptos en tendance

Questions liées

QWhat is the total fully diluted supply of the top 15 stablecoins as of January 2026, and which two dominate the market?

AThe total fully diluted supply of the top 15 stablecoins is $304 billion. Tether's USDT ($197 billion) and Circle's USDC ($73 billion) dominate the market with an 89% combined share.

QAccording to the data, which blockchain hosts the largest portion of stablecoin supply and what is its share?

AEthereum hosts the largest portion of stablecoin supply at $176 billion, representing 58% of the total.

QWhat does the data reveal about the concentration of holdings for stablecoins other than USDT and USDC?

AFor stablecoins other than USDT and USDC, holdings are extremely concentrated. The top 10 wallets often hold 60% to 99% of the supply, with some like USDF and USD0 having 99% concentration and a very high HHI index, indicating dominance by just one or two addresses.

QWhat was the total stablecoin transfer volume in January 2026, and which stablecoin accounted for the majority of this volume despite having a smaller supply?

AThe total stablecoin transfer volume in January 2026 was $10.3 trillion. USDC accounted for the majority of this volume at $8.3 trillion, which is nearly 5 times that of USDT ($1.7 trillion), even though its supply is only about 1/2.7 that of USDT.

QWhat is the significance of the velocity metric in stablecoin usage, and how does USDC's velocity on Base compare to USDT's on Ethereum?

AThe velocity metric (transfer volume divided by supply) reveals whether a stablecoin is actively used as a medium of exchange or simply held. USDC on Base has an extremely high daily velocity of 14x, driven by high-frequency DeFi activity. In contrast, USDT on Ethereum has a much lower velocity of 0.2x, indicating that over $100 billion of its supply is largely idle.

Lectures associées

La Banque d'Italie ne voit pas d'avantages systémiques des stablecoins dans les transferts

L'étude de la Banque d'Italie conclut que les stablecoins n'offrent pas d'avantage systémique durable en termes de coût et de rapidité pour les transferts d'argent. Les avantages potentiels sont annulés par les frais de conversion vers et depuis les monnaies fiduciaires et par l'efficacité des infrastructures de paiement locales. La recherche a comparé des transferts de 200 USDC sur 10 couloirs bilatéraux (Italie vers Brésil, Argentine, Japon, Émirats Arabes Unis, Afrique du Sud). Le coût total des transferts en stablecoins variait de 0,3% à près de 9%. Les délais étaient inférieurs à 20 minutes dans les pays dotés de systèmes de paiement instantané, mais pouvaient atteindre 1 à 2 jours ouvrables ailleurs. Les principaux coûts et retards sont liés au change de devises et à la qualité de l'infrastructure locale, plutôt qu'aux frais de blockchain. Bien que souvent moins chers que la moyenne mondiale des transferts (6,65%), les stablecoins n'étaient plus avantageux que dans 3 cas sur 7 par rapport au service Wise. Les auteurs estiment que l'utilité serait plus forte si les stablecoins pouvaient être dépensés directement, sans reconversion. Ils notent également qu'une réglementation trop restrictive complique l'usage pour les clients tout en n'éliminant pas la demande. Le marché des stablecoins a enregistré en juillet sa plus forte baisse mensuelle depuis l'effondrement de Terra, perdant plus de 10 milliards de dollars.

cryptonews.ruIl y a 1 h

La Banque d'Italie ne voit pas d'avantages systémiques des stablecoins dans les transferts

cryptonews.ruIl y a 1 h

Le « boom du Bitcoin » en plein essor : Une nouvelle déclaration de Saylor suscite des spéculations sur des achats

Michael Saylor, président exécutif de MicroStrategy (MSTR), a relancé les spéculations sur un nouvel achat de bitcoins par la société en publiant le message « Bitcoin Drive engaged » le 2 août, accompagné de son tableau de suivi habituel. Cette pratique précède généralement les annonces officielles du trésor. Le rapport affiché montrait que les réserves de MicroStrategy s'élevaient à 843 775 BTC, d'une valeur marchande d'environ 53,25 milliards de dollars, avec un prix d'acquisition moyen de 75 653 dollars et une perte non réalisée de 10,58 milliards de dollars. Cependant, le registre public en temps réel de la société indique deux ventes récentes totalisant 3 588 BTC, ramenant le stock de 847 363 à 843 775 BTC. Ces ventes, déclarées à la SEC, visaient à financer des dividendes d'actions privilégiées et à reconstituer les réserves en dollars, qui s'élèvent désormais à environ 3,75 milliards de dollars. La société a subi une perte opérationnelle de 8,33 milliards de dollars au deuxième trimestre 2026, en grande partie due à une perte non réalisée sur ses actifs numériques. La direction pourrait vendre jusqu'à 1,25 milliard de dollars de bitcoins supplémentaires pour ses obligations en cash. L'annonce attendue lundi révélera si le message « Bitcoin Drive » signale une reprise des achats d'accumulation, alors que MicroStrategy équilibre son énorme stock de bitcoins avec ses engagements financiers croissants.

cryptonews.ruIl y a 1 h

Le « boom du Bitcoin » en plein essor : Une nouvelle déclaration de Saylor suscite des spéculations sur des achats

cryptonews.ruIl y a 1 h

Le motif « Tête et Épaules inversé » sur le graphique du Bitcoin annonce une montée vers 67 200 $

Malgré un léger recul début août, les graphiques de prix, notamment celui du Bitcoin, forment un modèle de renversement baissier. Actuellement, le BTC oscille autour de 63 200 $, formant l'épaule droite de la classique figure inversée "tête et épaules". L'analyste Axel Kibard de TechCharts voit là la seule réelle raison d'optimisme à court terme pour les haussiers ce mois-ci. La question principale est de savoir si les acheteurs auront la force de pousser le Bitcoin vers le niveau clé de 67 000 $. Parallèlement, dans la paire ETH/BTC, un fond de renversement similaire a déjà été franchi à la hausse. L'Ethereum, en tendance haussière, se dirige vers un objectif technique de 0,0312, indiquant que les grands capitaux préfèrent actuellement investir dans l'ETH plutôt que dans le Bitcoin, ce qui draine la liquidité et les volumes nécessaires à une reprise rapide du BTC. Face au dollar, l'Ethereum teste prudemment le niveau de support à 1 875 $, une résistance qui, si elle est maintenue, pourrait ouvrir la voie vers 2 163 $. Cette force relative de l'ETH est un signal positif pour le marché, mais la situation reste tendue pour les détenteurs de Bitcoin. Soit le BTC suit l'exemple de l'ETH et monte rapidement au-dessus de 67 200 $ pour confirmer le renversement, soit le modèle échoue. Selon Kibard, si une attaque de la ligne de cou (neckline) n'intervient pas dans les prochains jours, les baissiers reprendront le contrôle et pousseront le Bitcoin vers des niveaux de support solides à 60 000 $, voire 58 000 $.

cryptonews.ruIl y a 1 h

Le motif « Tête et Épaules inversé » sur le graphique du Bitcoin annonce une montée vers 67 200 $

cryptonews.ruIl y a 1 h

Les actions des entreprises d'IA se négocient comme des « mèmes cryptos », tandis que le Bitcoin reste stable – Revue de la semaine

Cette semaine, l'attention financière s'est largement détournée du Bitcoin, relativement stable autour de 64 000 $, pour se concentrer sur une volatilité extrême dans le secteur des actions liées à l'intelligence artificielle (IA). Les marchés asiatiques, notamment en Corée du Sud, ont subi des chutes sévères, en partie déclenchées par la liquidation forcée du fonds « Situational Awareness » de Leopold Aschenbrenner, entraînant des pertes massives. Le secteur des semi-conducteurs et de l'IA montre des signes de surchauffe, suscitant des débats sur un éventuel ralentissement. Dans le domaine des cryptomonnaies, l'ambiance reste difficile. Plusieurs plateformes d'échange (BitMEX, BitMart) ont annoncé leur fermeture, tandis que d'autres entreprises comme Coinbase et Uphold procèdent à des réductions de personnel. MicroStrategy continue sa stratégie d'accumulation de bitcoins et de rachat de ses propres actions. Les discussions portent également sur les risques potentiels pour des écosystèmes comme Solana si des applications populaires (Pump.fun, Trade.xyz) décidaient de lancer leur propre blockchain. Par ailleurs, une faille de sécurité majeure concernant le portefeuille matériel Coldcard a été mise en lumière, rappelant les risques du self-custody. Enfin, le projet d'IA décentralisée Bittensor (TAO) a attiré l'attention de certains investisseurs de capital-risque, mais des mises en garde sont émises contre un possible engouement spéculatif similaire à celui pour les memecoins. La semaine a été marquée par des interventions macroéconomiques, comme celle de la Japon pour soutenir le yen, et par les anticipations concernant la politique de la Fed.

cryptonews.ruIl y a 1 h

Les actions des entreprises d'IA se négocient comme des « mèmes cryptos », tandis que le Bitcoin reste stable – Revue de la semaine

cryptonews.ruIl y a 1 h

Trading

Spot

Articles tendance

Comment acheter FLOW

Bienvenue sur HTX.com ! Nous vous permettons d'acheter Flow (FLOW) de manière simple et pratique. Suivez notre guide étape par étape pour commencer votre parcours crypto.Étape 1 : Création de votre compte HTXUtilisez votre adresse e-mail ou votre numéro de téléphone pour ouvrir un compte sur HTX gratuitement. L'inscription se fait en toute simplicité et débloque toutes les fonctionnalités.Créer mon compteÉtape 2 : Choix du mode de paiement (rubrique Acheter des cryptosCarte de crédit/débit : utilisez votre carte Visa ou Mastercard pour acheter instantanément Flow (FLOW).Solde :utilisez les fonds du solde de votre compte HTX pour trader en toute simplicité.Prestataire tiers :pour accroître la commodité d'utilisation, nous avons ajouté des modes de paiement populaires tels que Google Pay et Apple Pay.P2P :tradez directement avec d'autres utilisateurs sur HTX.OTC (de gré à gré) : nous offrons des services personnalisés et des taux de change compétitifs aux traders.Étape 3 : stockage de vos Flow (FLOW)Après avoir acheté vos Flow (FLOW), stockez-les sur votre compte HTX. Vous pouvez également les envoyer ailleurs via un transfert sur la blockchain ou les utiliser pour trader d'autres cryptos.Étape 4 : tradez des Flow (FLOW)Tradez facilement Flow (FLOW) sur le marché Spot de HTX. Il vous suffit d'accéder à votre compte, de sélectionner la paire de trading, d'exécuter vos trades et de les suivre en temps réel. Nous offrons une expérience conviviale aux débutants comme aux traders chevronnés.

311 vues totalesPublié le 2024.12.10Mis à jour le 2026.06.02

Comment acheter FLOW

Discussions

Bienvenue dans la Communauté HTX. Ici, vous pouvez vous tenir informé(e) des derniers développements de la plateforme et accéder à des analyses de marché professionnelles. Les opinions des utilisateurs sur le prix de FLOW (FLOW) sont présentées ci-dessous.

活动图片












