Author: Zack Pokorny, Research Associate, Galaxy Research
Compiled by: Jiahuan, ChainCatcher
Introduction
Q2 2026 marked the first quarter since Q4 2022 where the crypto-collateralized segments of CeFi, DeFi, and Collateralized Debt Position (CDP) stablecoins all simultaneously declined, continuing the previous trend of deleveraging.
The most notable difference compared to the previous bear market cycle is that outstanding loans are decreasing in a stable, stepwise manner rather than collapsing suddenly.
In Q2 2022, the crypto-collateralized lending market plummeted by over 55%, followed by declines of 9% and 29% in Q3 and Q4, respectively. In contrast, during the recent deleveraging cycle, the market has seen consecutive quarterly declines of only 10%, 5%, and 17%.
In our view, this relatively mild pace indicates a much healthier deleveraging process, driven primarily by proactive market contraction rather than forced liquidations or institutional defaults and collapses.
If lending activity continues to contract in future quarters, we expect this stepwise decline to persist, rather than a repeat of the severe, cascading losses seen during the 2022 deleveraging.
Corporate treasuries also saw some degree of deleveraging, mainly due to MicroStrategy's repurchase of $1.5 billion in debt in May 2026. This reduced the debt used to fund digital asset treasury strategies to $16.1 billion, roughly returning to the level these companies held in July 2025.
In the futures market, open interest (OI) at the end of Q2 was essentially flat, declining 3.08% quarter-over-quarter (QoQ) to $103.2 billion.
However, this relatively mild overall decline masks more pronounced changes within the market: BTC OI fell 6.24% to $45.04 billion; ETH OI declined more sharply, dropping 26.31% to $21.99 billion. By quarter-end, BTC and ETH combined accounted for 65% of total futures open interest.
Notably, this relative stability in futures did not persist. By the end of July, open interest had climbed back to approximately $114 billion, with BTC OI rebounding to around $48 billion and ETH rising to $25.74 billion, both moving off their Q2 lows.
Key Takeaways
-
In Q2 2026, the total crypto-collateralized lending value decreased by $11.33 billion, a drop of 16.78%, to $56.16 billion. This represents a 40.13% decline from the Q3 2025 peak of $78.69 billion.
-
In Q2, USD-denominated outstanding loans in DeFi lending applications declined for the third consecutive quarter, dropping by $7.79 billion, a 27.61% decrease, to $20.43 billion.
-
Galaxy Research currently tracks approximately $16.1 billion in outstanding debt used by companies to directly purchase digital assets or to fund corporate treasury strategies that hold digital assets via leverage.
-
Futures open interest, including perpetuals, declined 3.08% QoQ to $103.2 billion.
Crypto-Collateralized Lending
The market landscape below illustrates some major historical and existing players in CeFi and DeFi crypto lending markets. As crypto asset prices crashed and market liquidity dried up, several of the largest CeFi lenders by loan size failed in 2022 and 2023. These entities are marked with red alert points in the following chart.
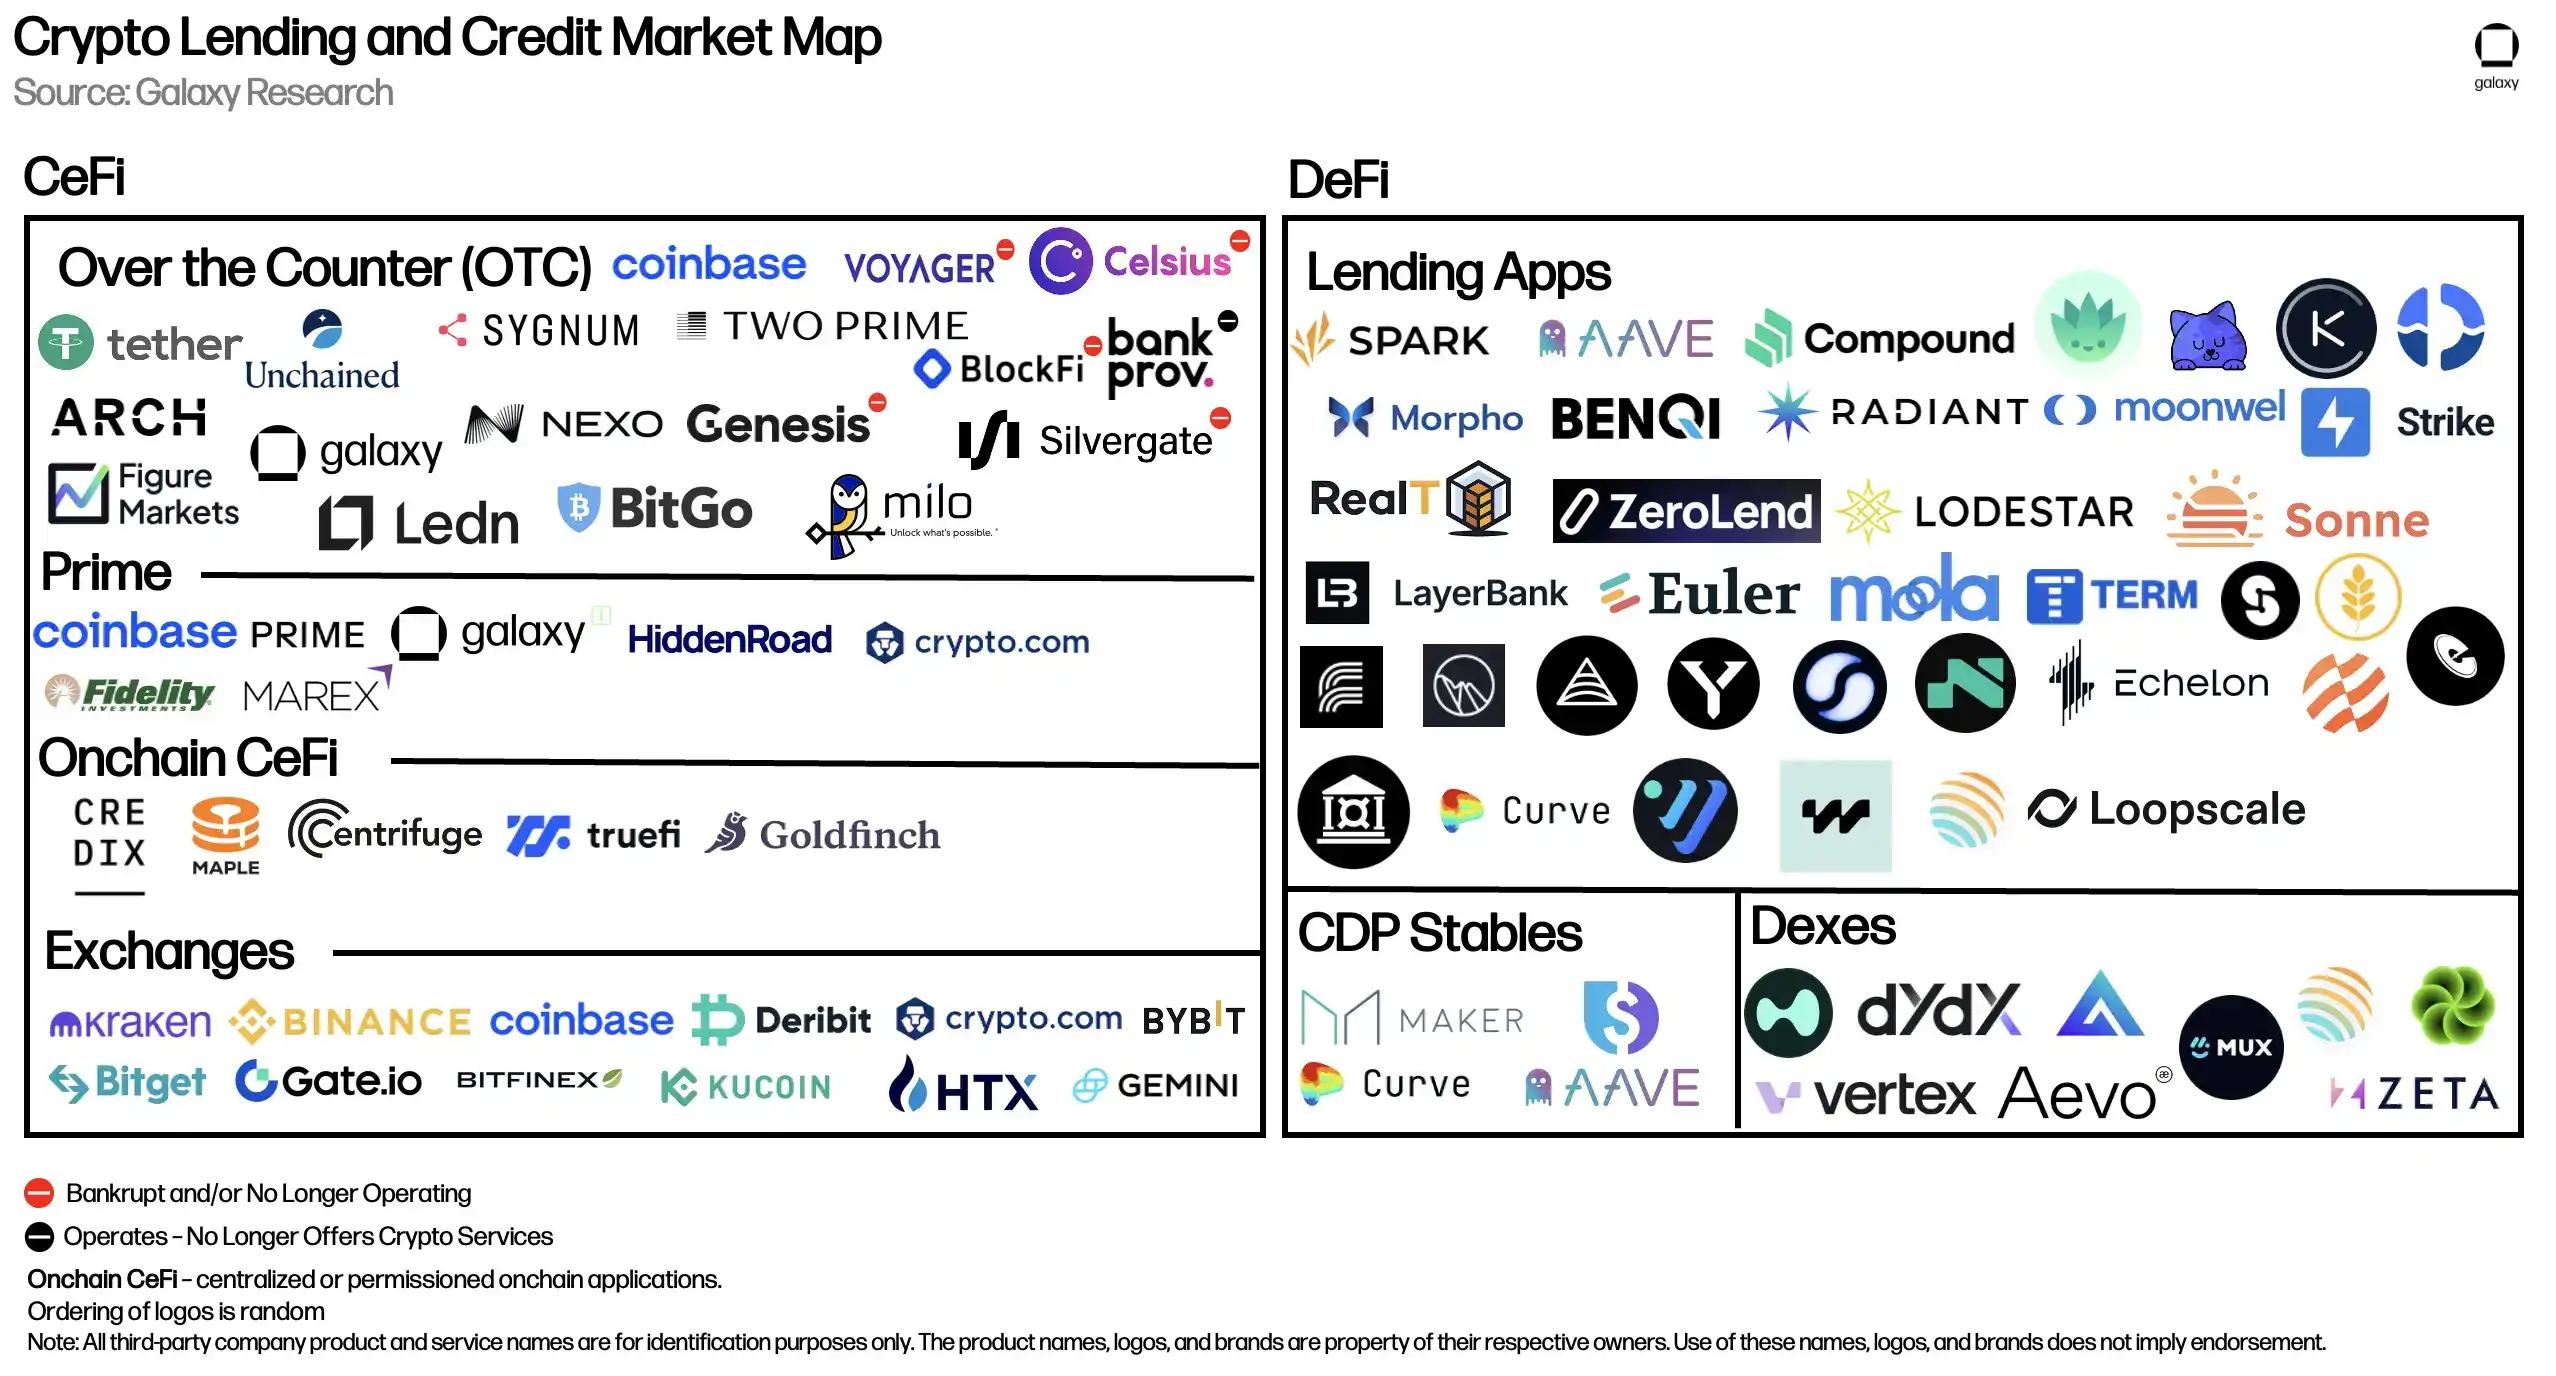
Chart: Major CeFi and DeFi crypto lending market participants, and major CeFi lenders that failed between 2022 and 2023.
CeFi
The table below compares the CeFi crypto lenders covered in this market analysis. Some of these companies offer multiple services to investors. For example, Coinbase's core business is its exchange, but it also provides credit to investors through over-the-counter (OTC) crypto loans and margin financing. However, this analysis only counts crypto-collateralized loan volumes from these firms.
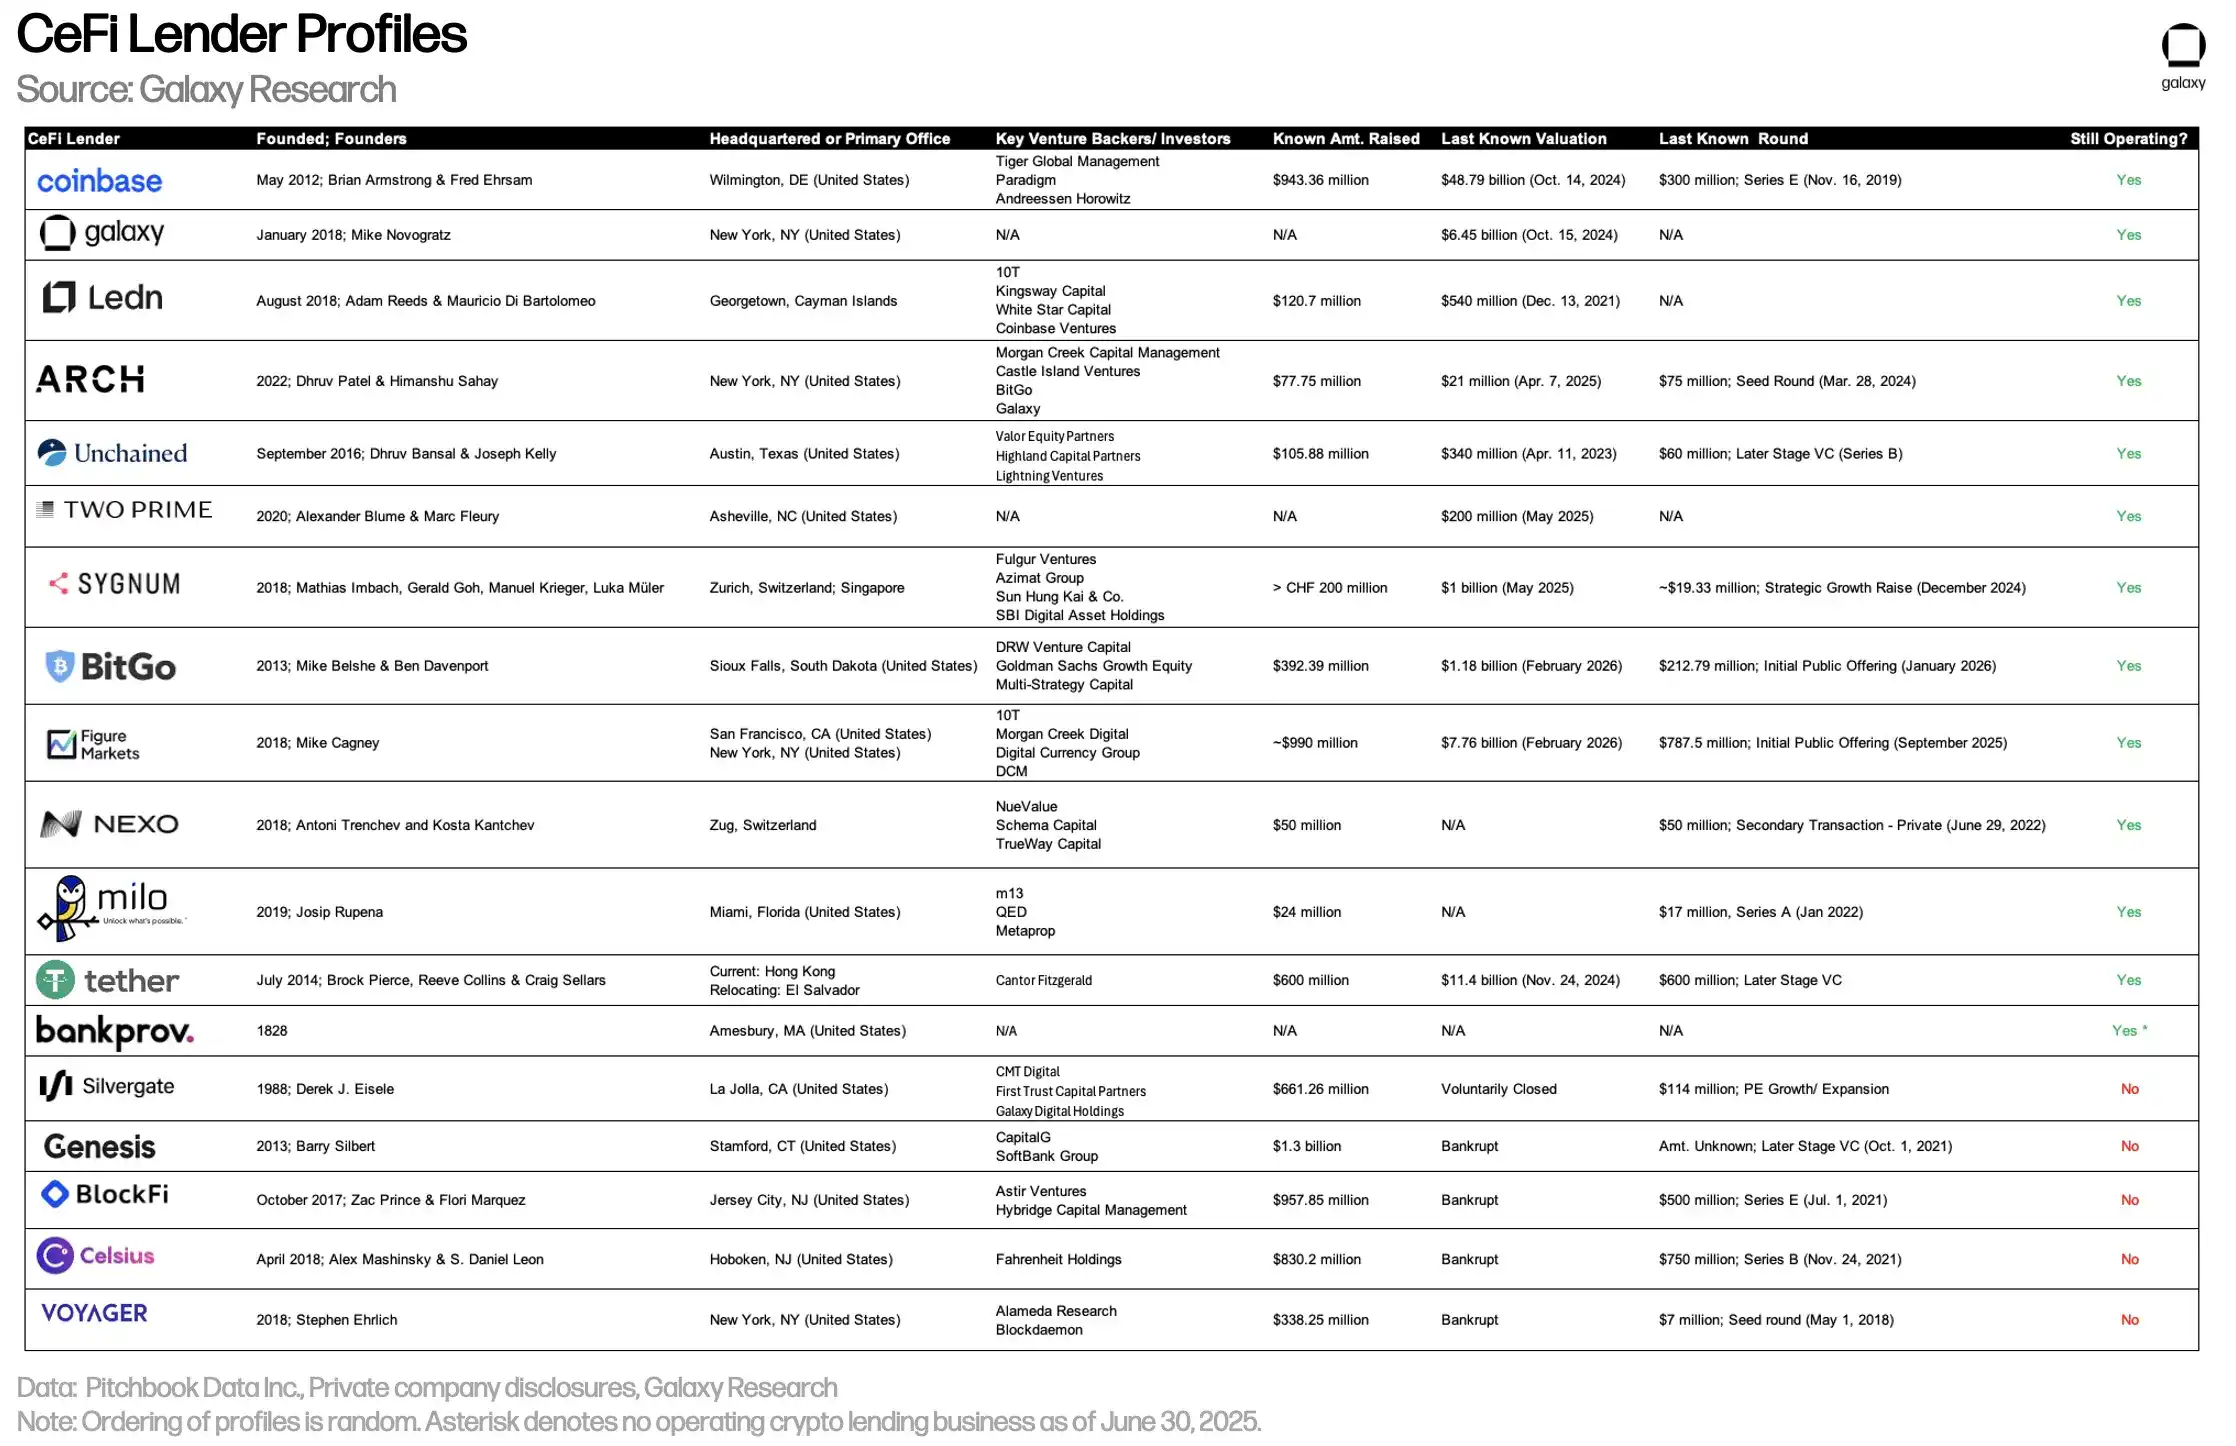
Chart: Major CeFi crypto lenders and their crypto-collateralized loan volumes.
As of June 30, the outstanding CeFi loan volume tracked by Galaxy Research was $22.98 billion, a QoQ decrease of 9.62%, or $2.45 billion. Compared to the bear market low of $6.8 billion in Q4 2023, this represents an increase of $16.14 billion, or 235.94%. However, current CeFi outstanding loan volume remains 37.16% below the all-time high of $36.58 billion seen in Q1 2022.
In Q2, overall loan volumes at CeFi lenders contracted, but this decline was primarily driven by a reduction in Tether's outstanding secured loans. Galaxy, Coinbase, Ledn, Arch, Sygnum, and Milo all saw their loan volumes increase in the quarter.
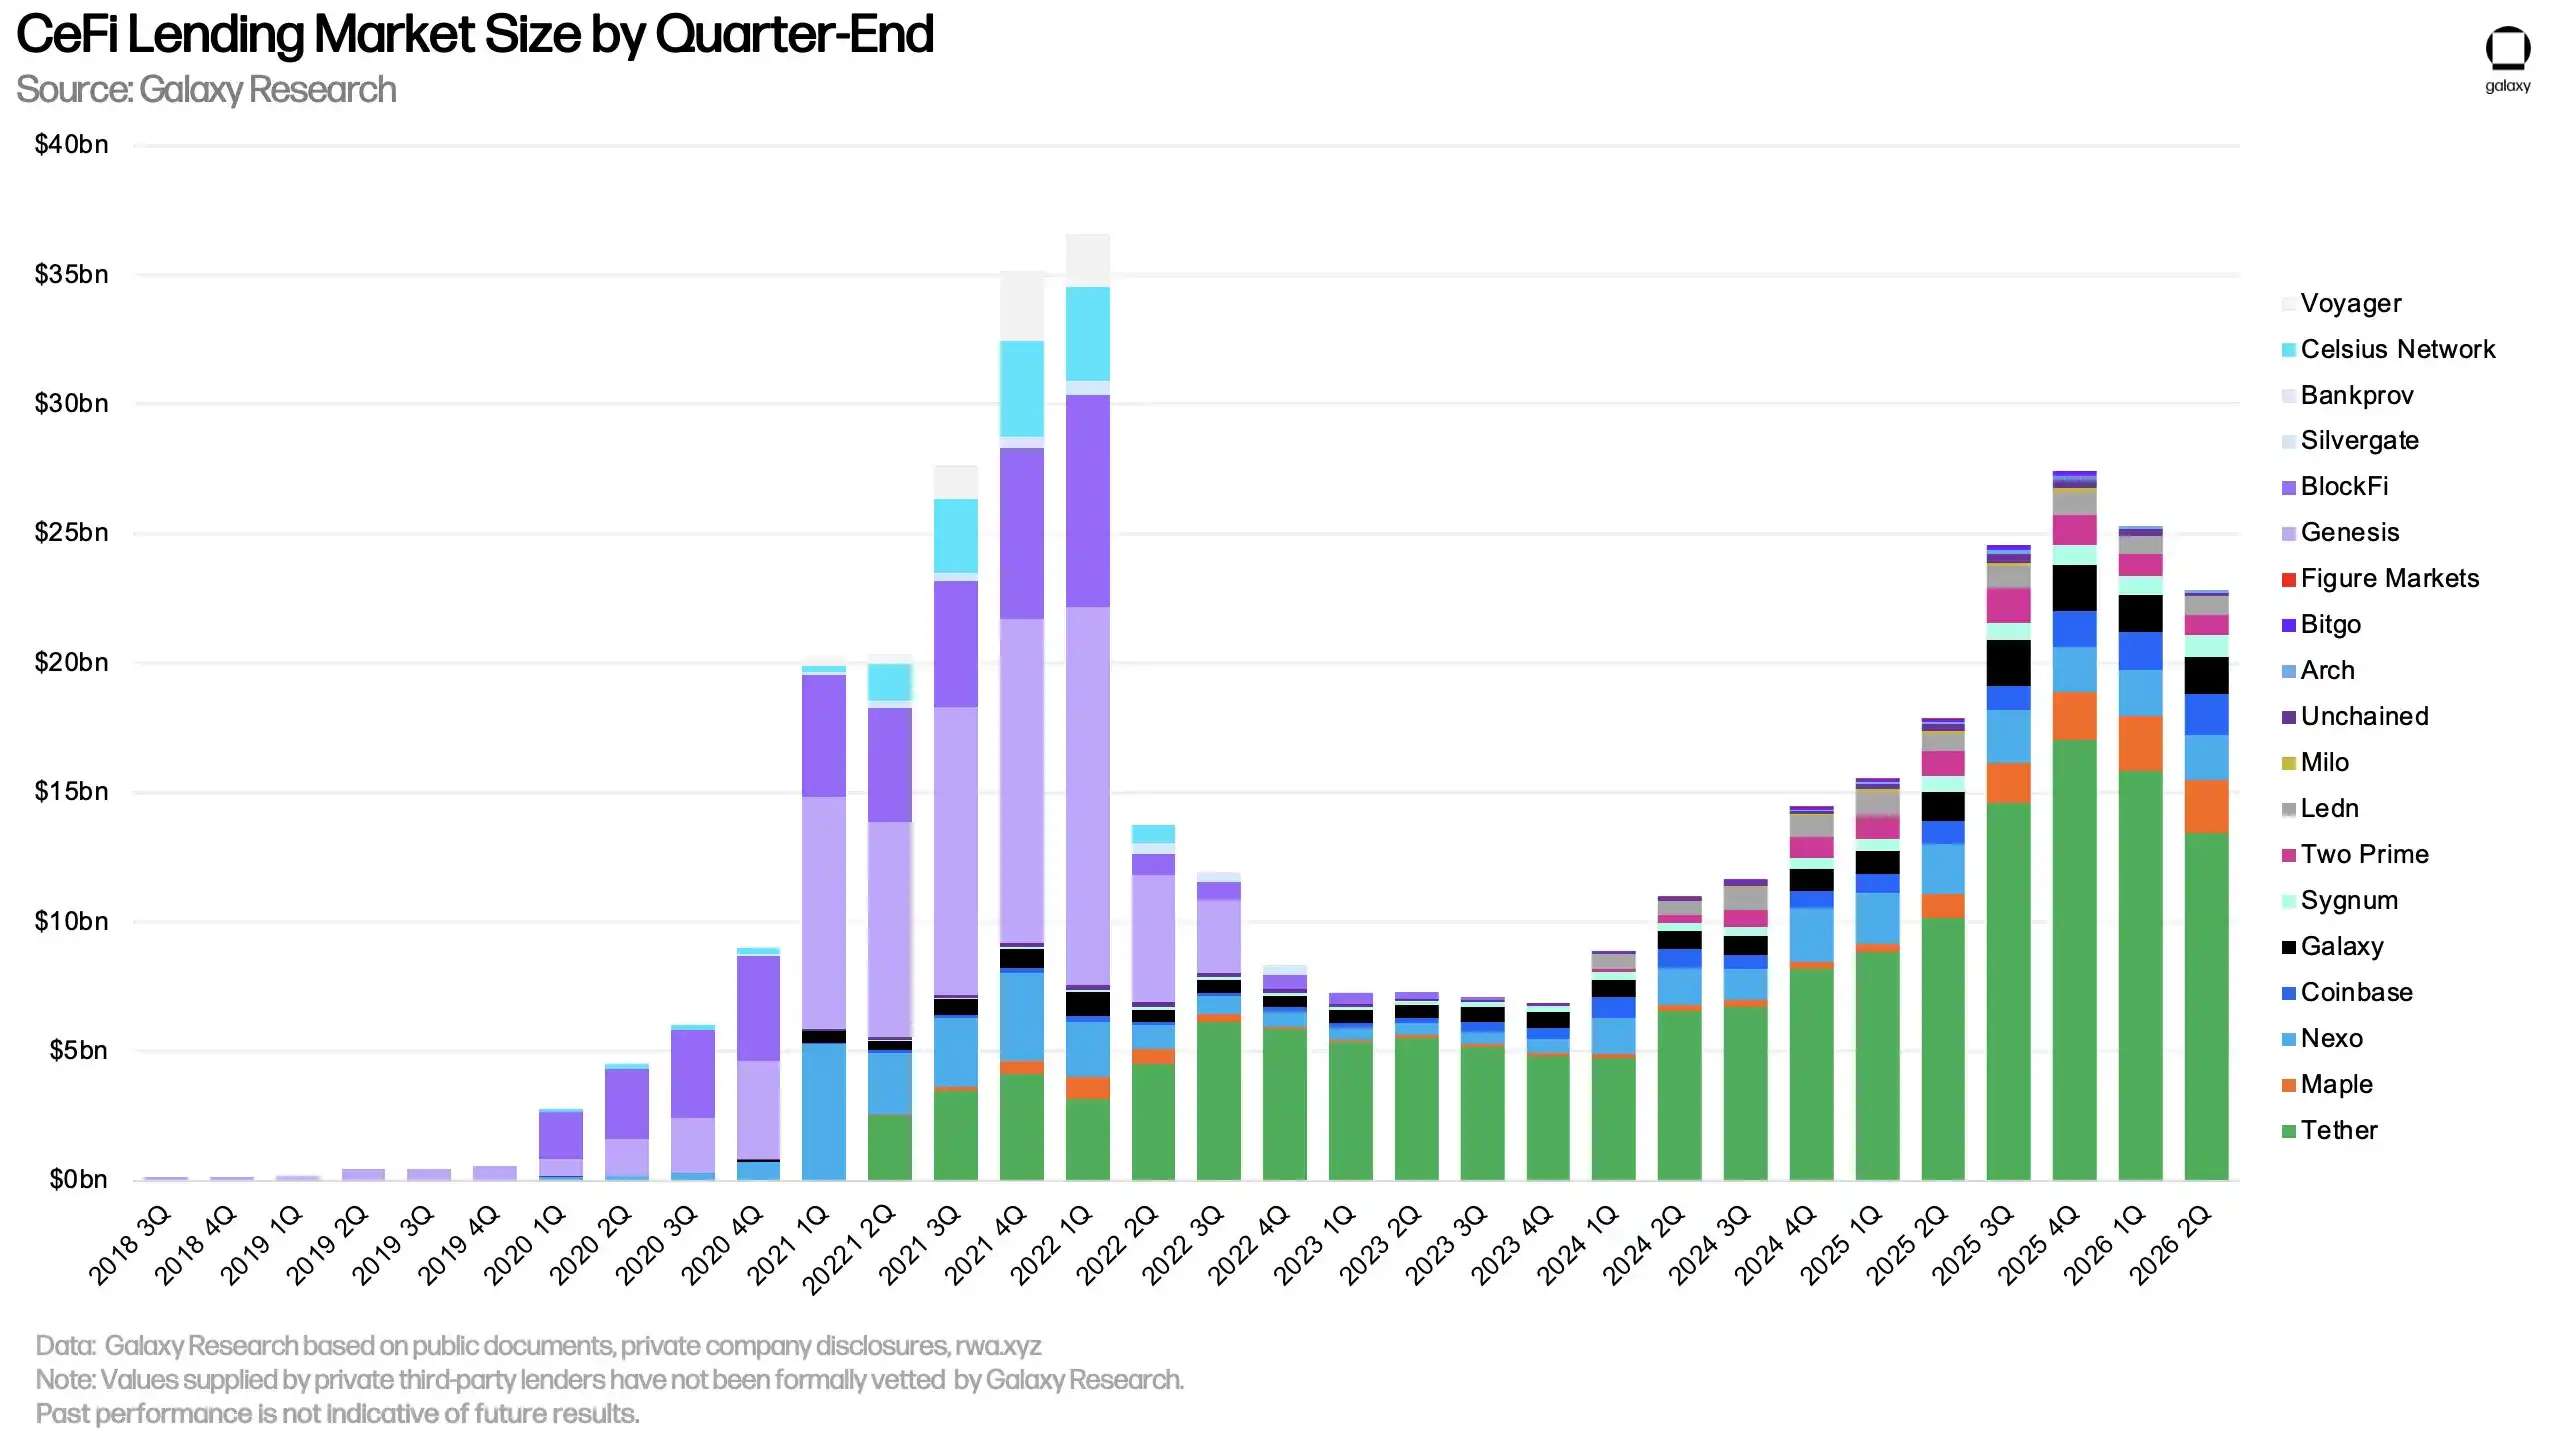
Chart: Changes in loan volumes for major CeFi lenders in Q2.
In our analysis, Tether remains the dominant lender, holding 58.54% of the CeFi lending market, down 371 basis points (bps) from the previous quarter. Adding Maple, with an 8.91% market share (up 52 bps QoQ), and Nexo, with a 7.51% share (up 49 bps QoQ), the top three CeFi lenders we track collectively control 74.96% of the market, down 270 bps from the prior quarter.
When comparing market shares, it's important to note significant differences between CeFi lenders. Some offer only specific loan types, e.g., BTC-only collateral, altcoin collateral products, or fiat rather than stablecoin loans; some serve only specific client types, such as institutions or retail investors; and others operate only in certain jurisdictions. These factors collectively determine a lender's ability to scale their business.
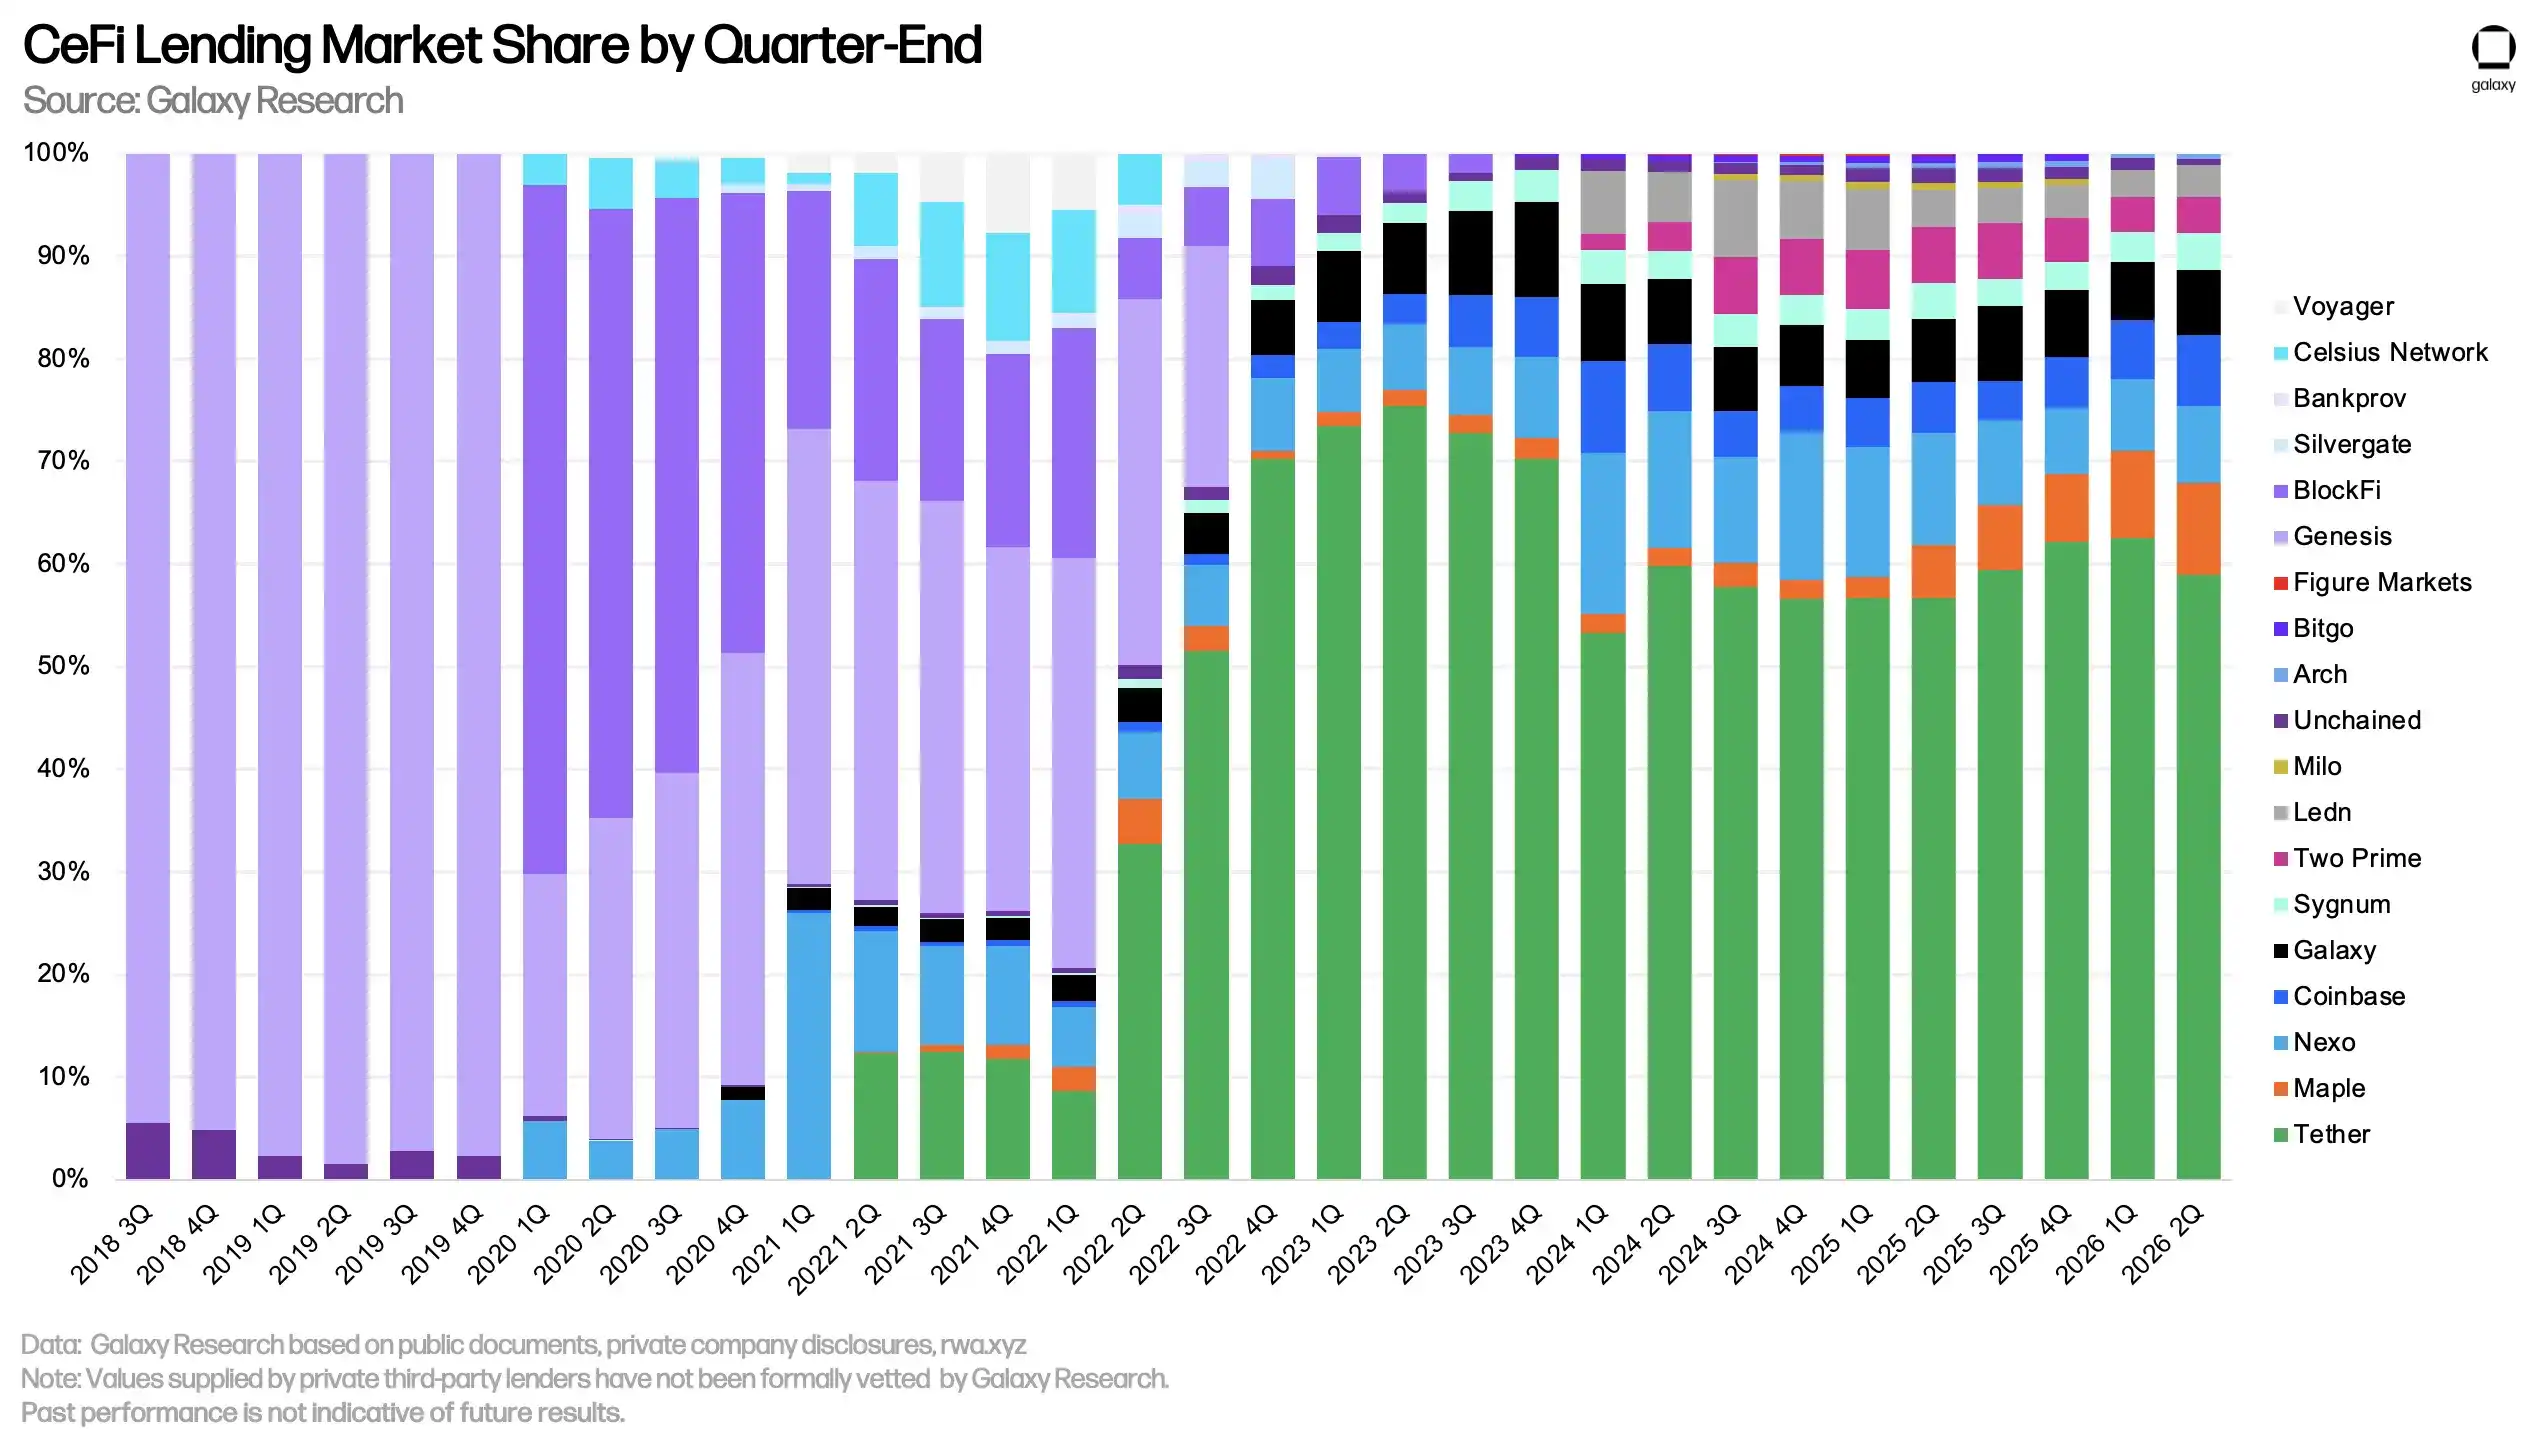
Chart: Market share of major CeFi lenders.
The table below details Galaxy Research's data sources for each CeFi lender and the methodology used to calculate their loan volumes. While DeFi and on-chain CeFi lending data are directly accessible on-chain, transparent, and easily available, obtaining CeFi data is much more challenging. This is largely because different CeFi lenders report outstanding loans inconsistently, disclose information at varying frequencies, and such data is often difficult to obtain in general.
Note: Data provided by private third-party lenders has not been formally verified by Galaxy Research.
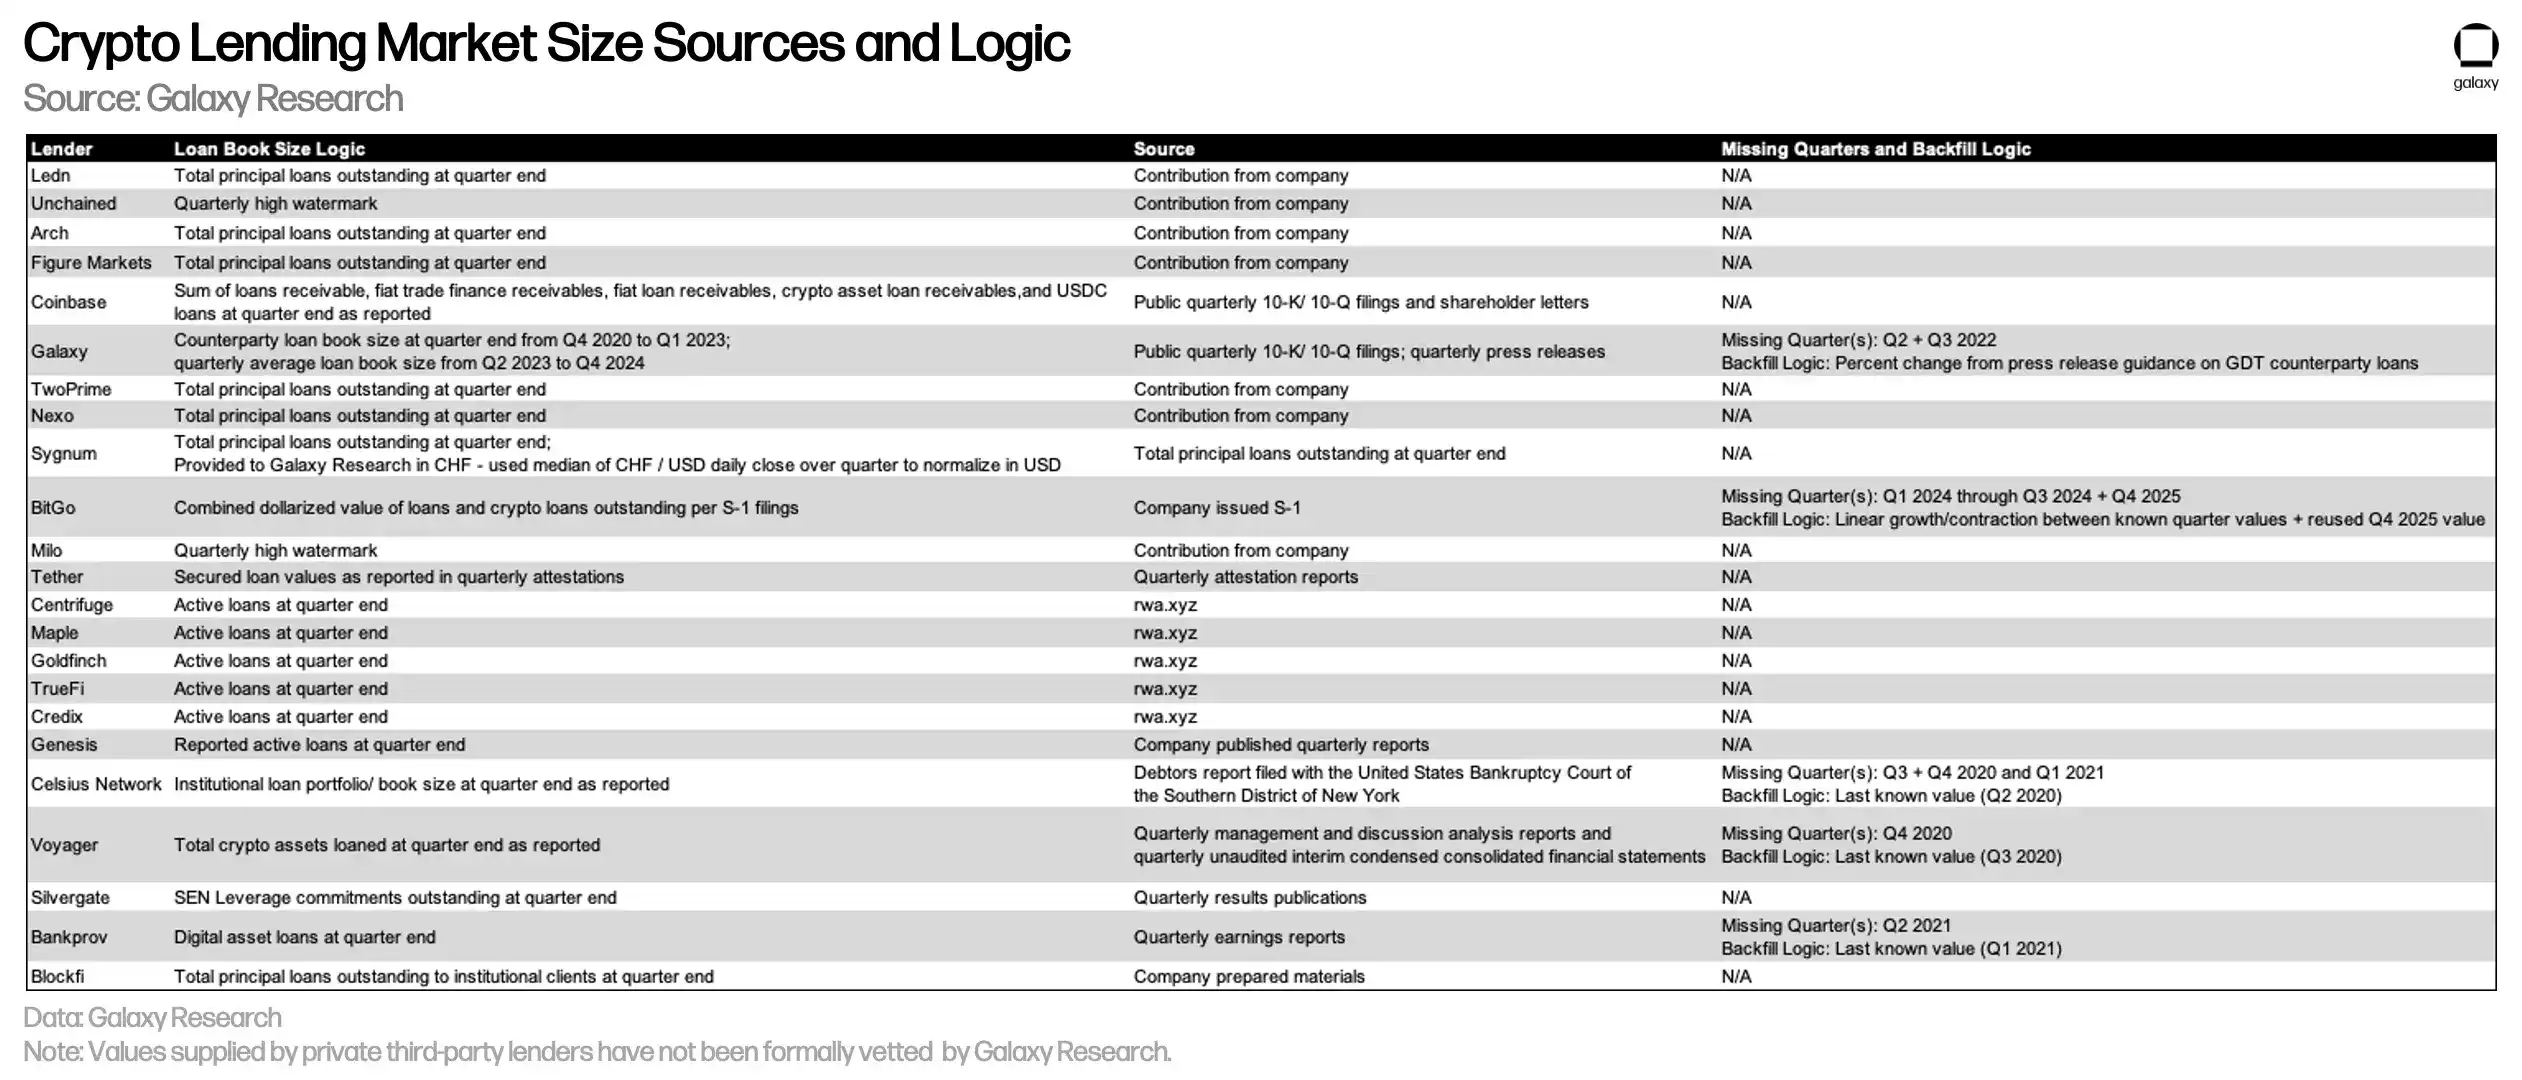
Chart: Galaxy Research's data sources and loan volume calculation methodology for each CeFi lender.
CeFi vs. DeFi Lending
In Q2, USD-denominated outstanding loans in DeFi lending applications declined for the third consecutive quarter, dropping by $7.79 billion, a 27.61% decrease, to $20.43 billion. Combining DeFi applications and CeFi lending platforms, total crypto-collateralized outstanding loans amounted to $43.41 billion at quarter-end, down $10.24 billion QoQ, a 19.08% decrease, primarily driven by on-chain loan contraction.
Notably, this is the first time since Q3 2023 that CeFi outstanding loan volume has surpassed that of DeFi lending applications.
Note: There may be double-counting between total CeFi loan volume and DeFi borrowings, as some CeFi entities use DeFi applications to extend loans to off-chain clients. For example, assume a CeFi lender posts idle BTC as collateral on-chain to borrow USDC, then lends that USDC to an off-chain borrower.
In this scenario, the CeFi entity's on-chain borrowing would be counted both in DeFi outstanding borrowings and appear on its financial statements as outstanding loans to clients.
Due to insufficient disclosure or on-chain address attribution data, it is difficult to fully eliminate this double-counting.
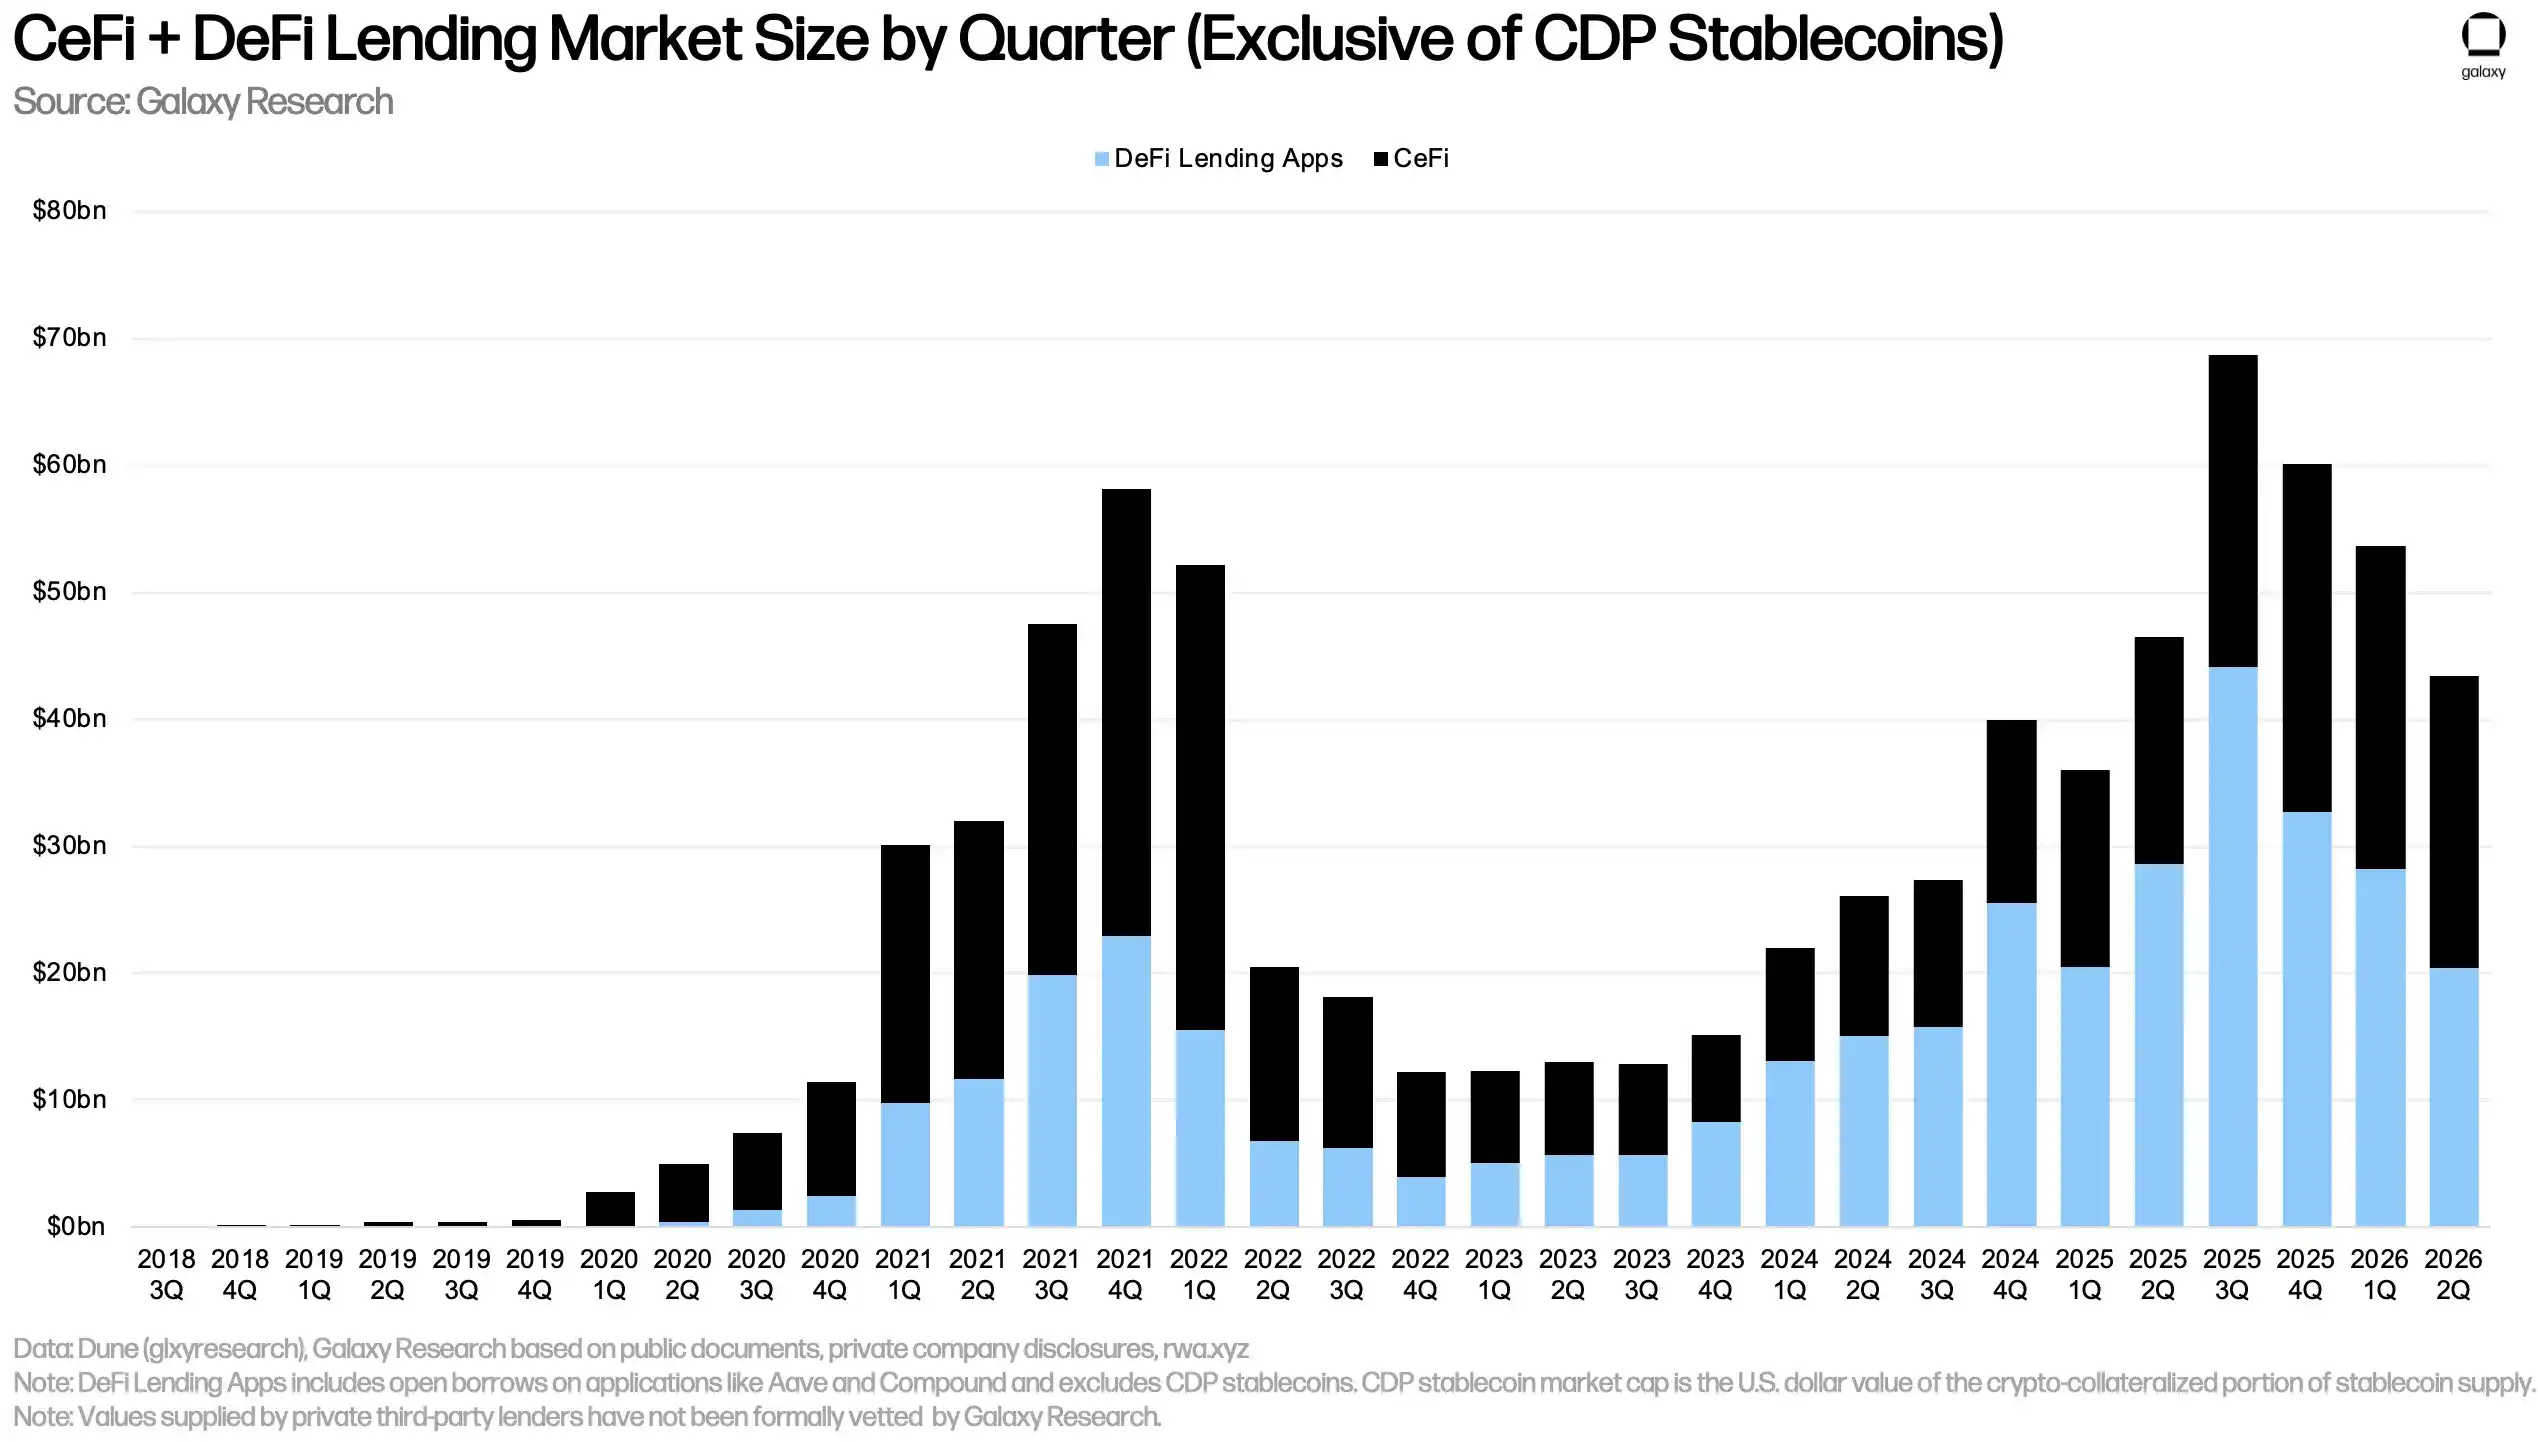
Chart: CeFi vs. DeFi crypto-collateralized outstanding loan volumes.
As the QoQ decline in outstanding borrowings from DeFi applications significantly exceeded that of CeFi platforms, DeFi's previous lead over CeFi vanished in Q2. As of the end of Q2 2026, DeFi lending applications' market share fell to 47.05%, down 555 bps QoQ from 52.6% at the end of Q1 2026.
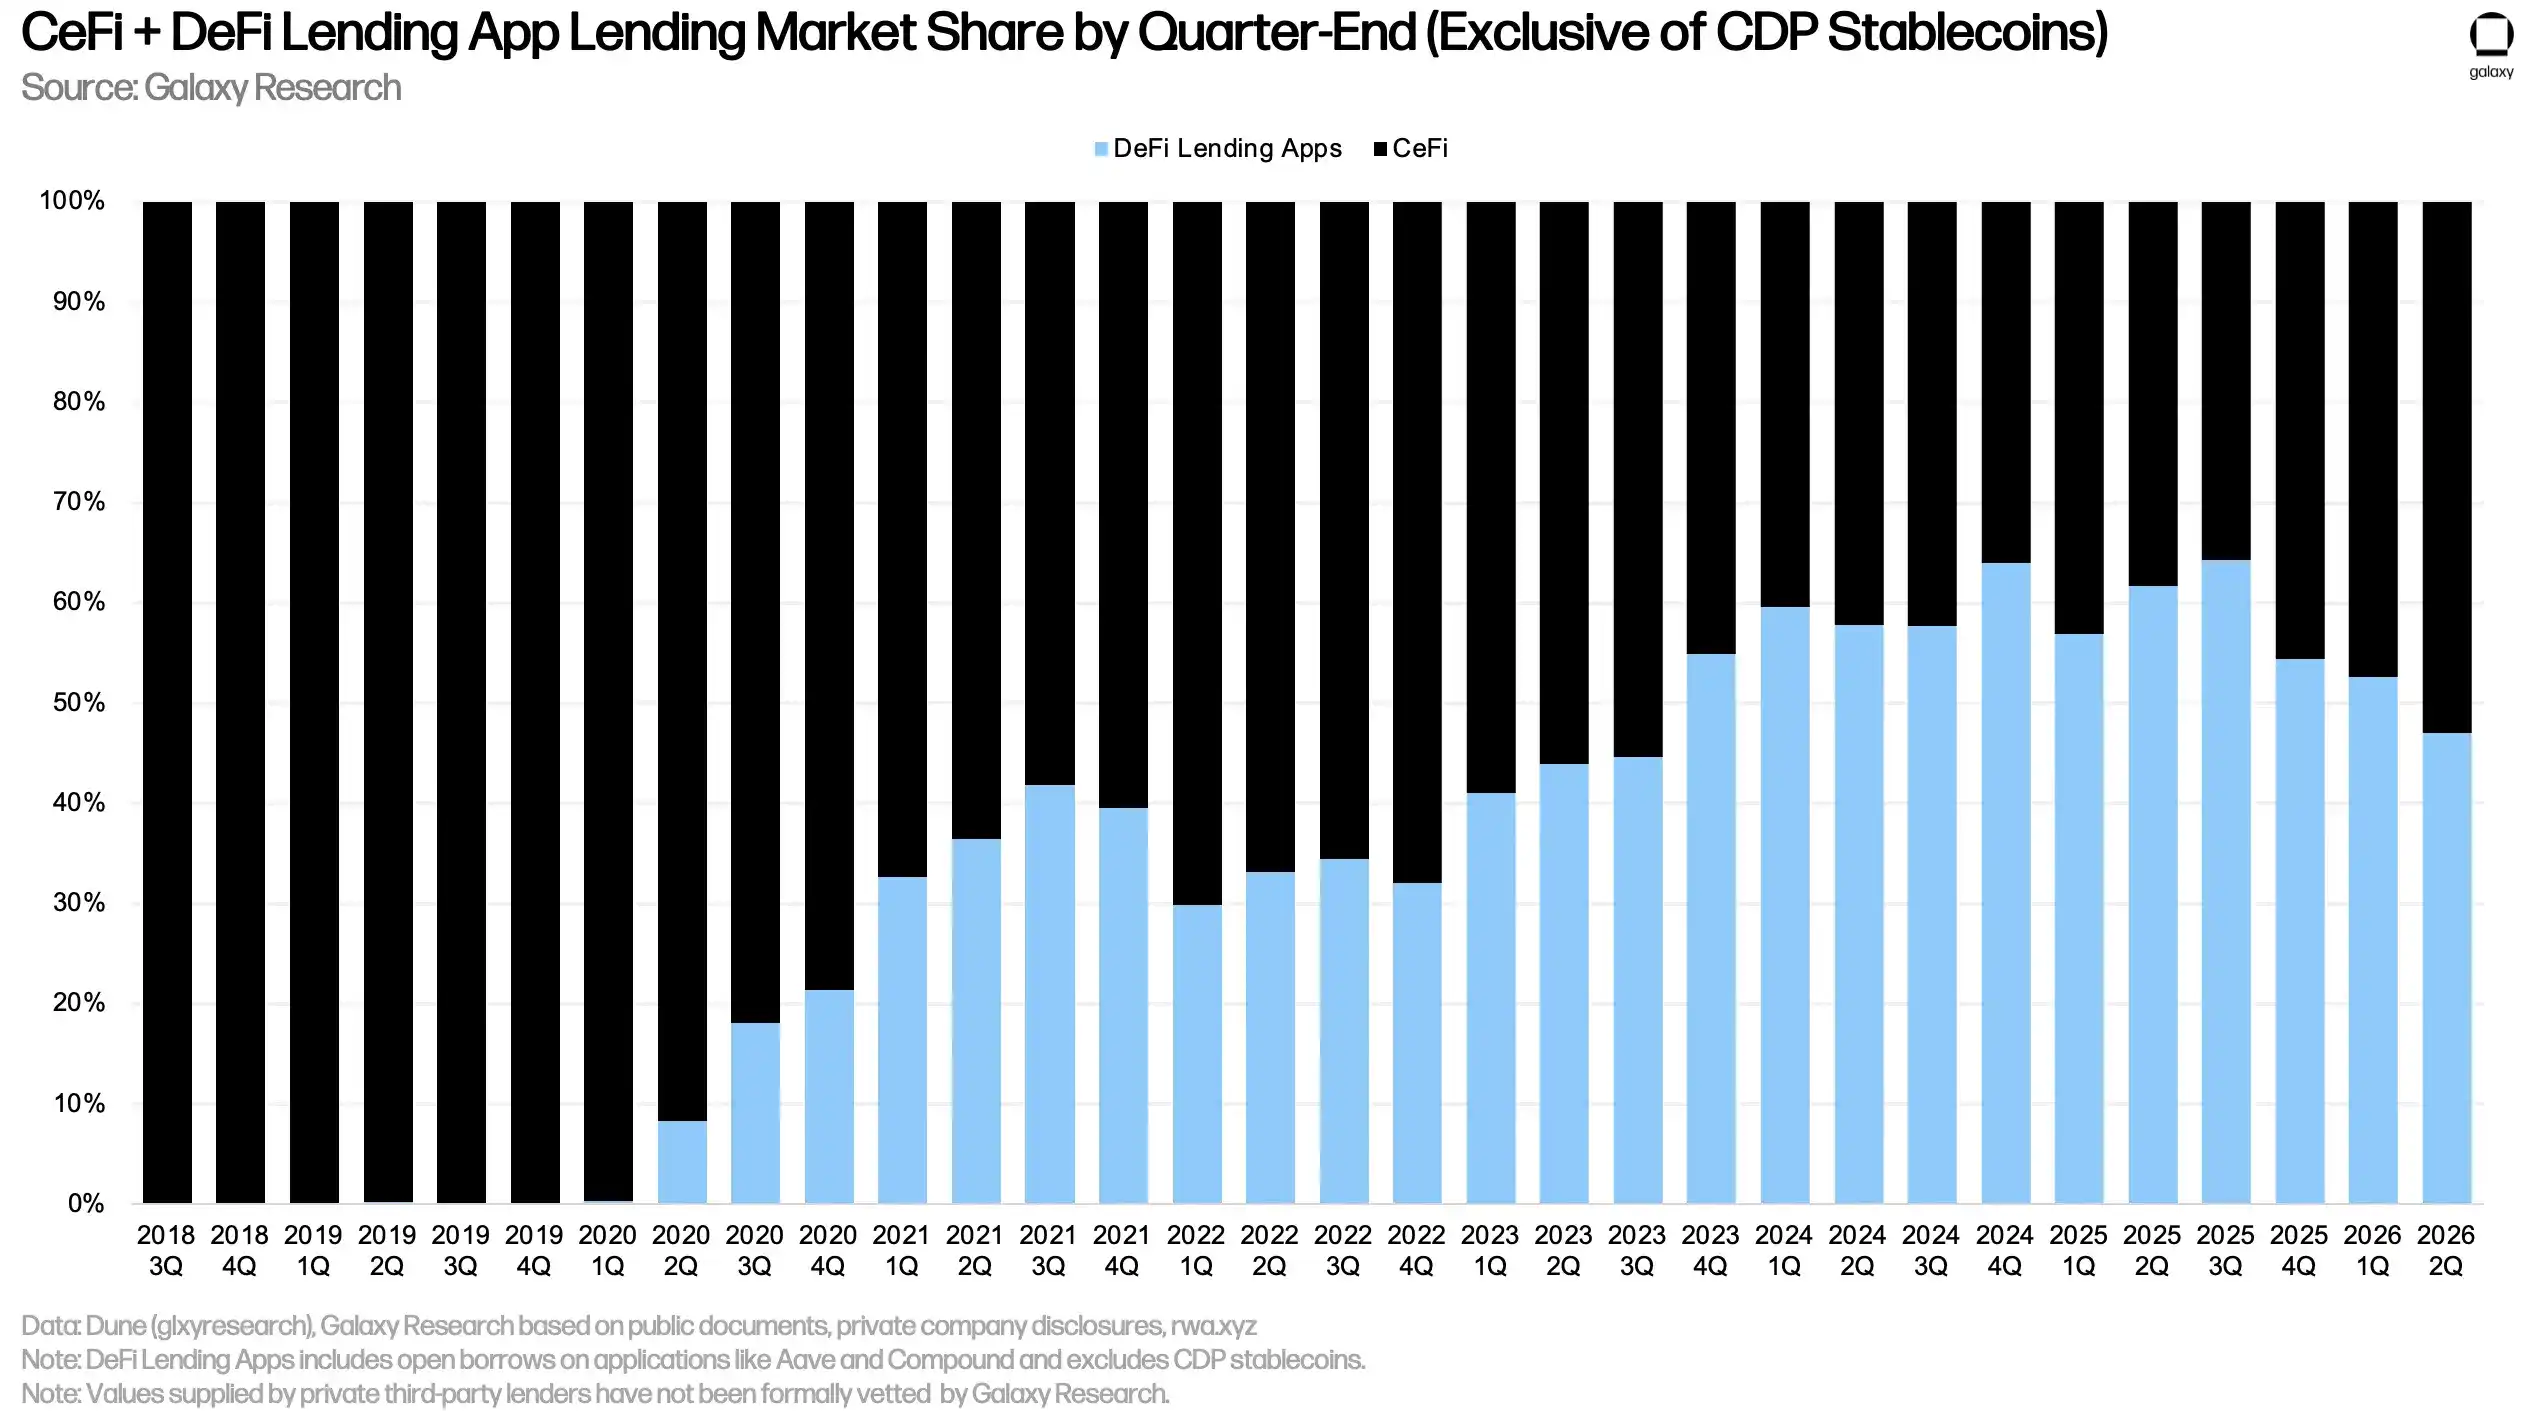
Chart: Changes in market share between CeFi and DeFi lending.
The third component, the portion of CDP stablecoin supply generated from crypto collateral, decreased by $1.09 billion QoQ, a 7.86% drop. Similarly, there may be double-counting between total CeFi loan volumes and CDP stablecoin supply, as some CeFi entities may mint CDP stablecoins via crypto collateral to finance loans to off-chain clients.
Overall, in Q2 2026, total crypto-collateralized lending decreased by $11.33 billion, or 16.78%, to $56.16 billion. This is 40.13% below the Q3 2025 peak of $78.69 billion.
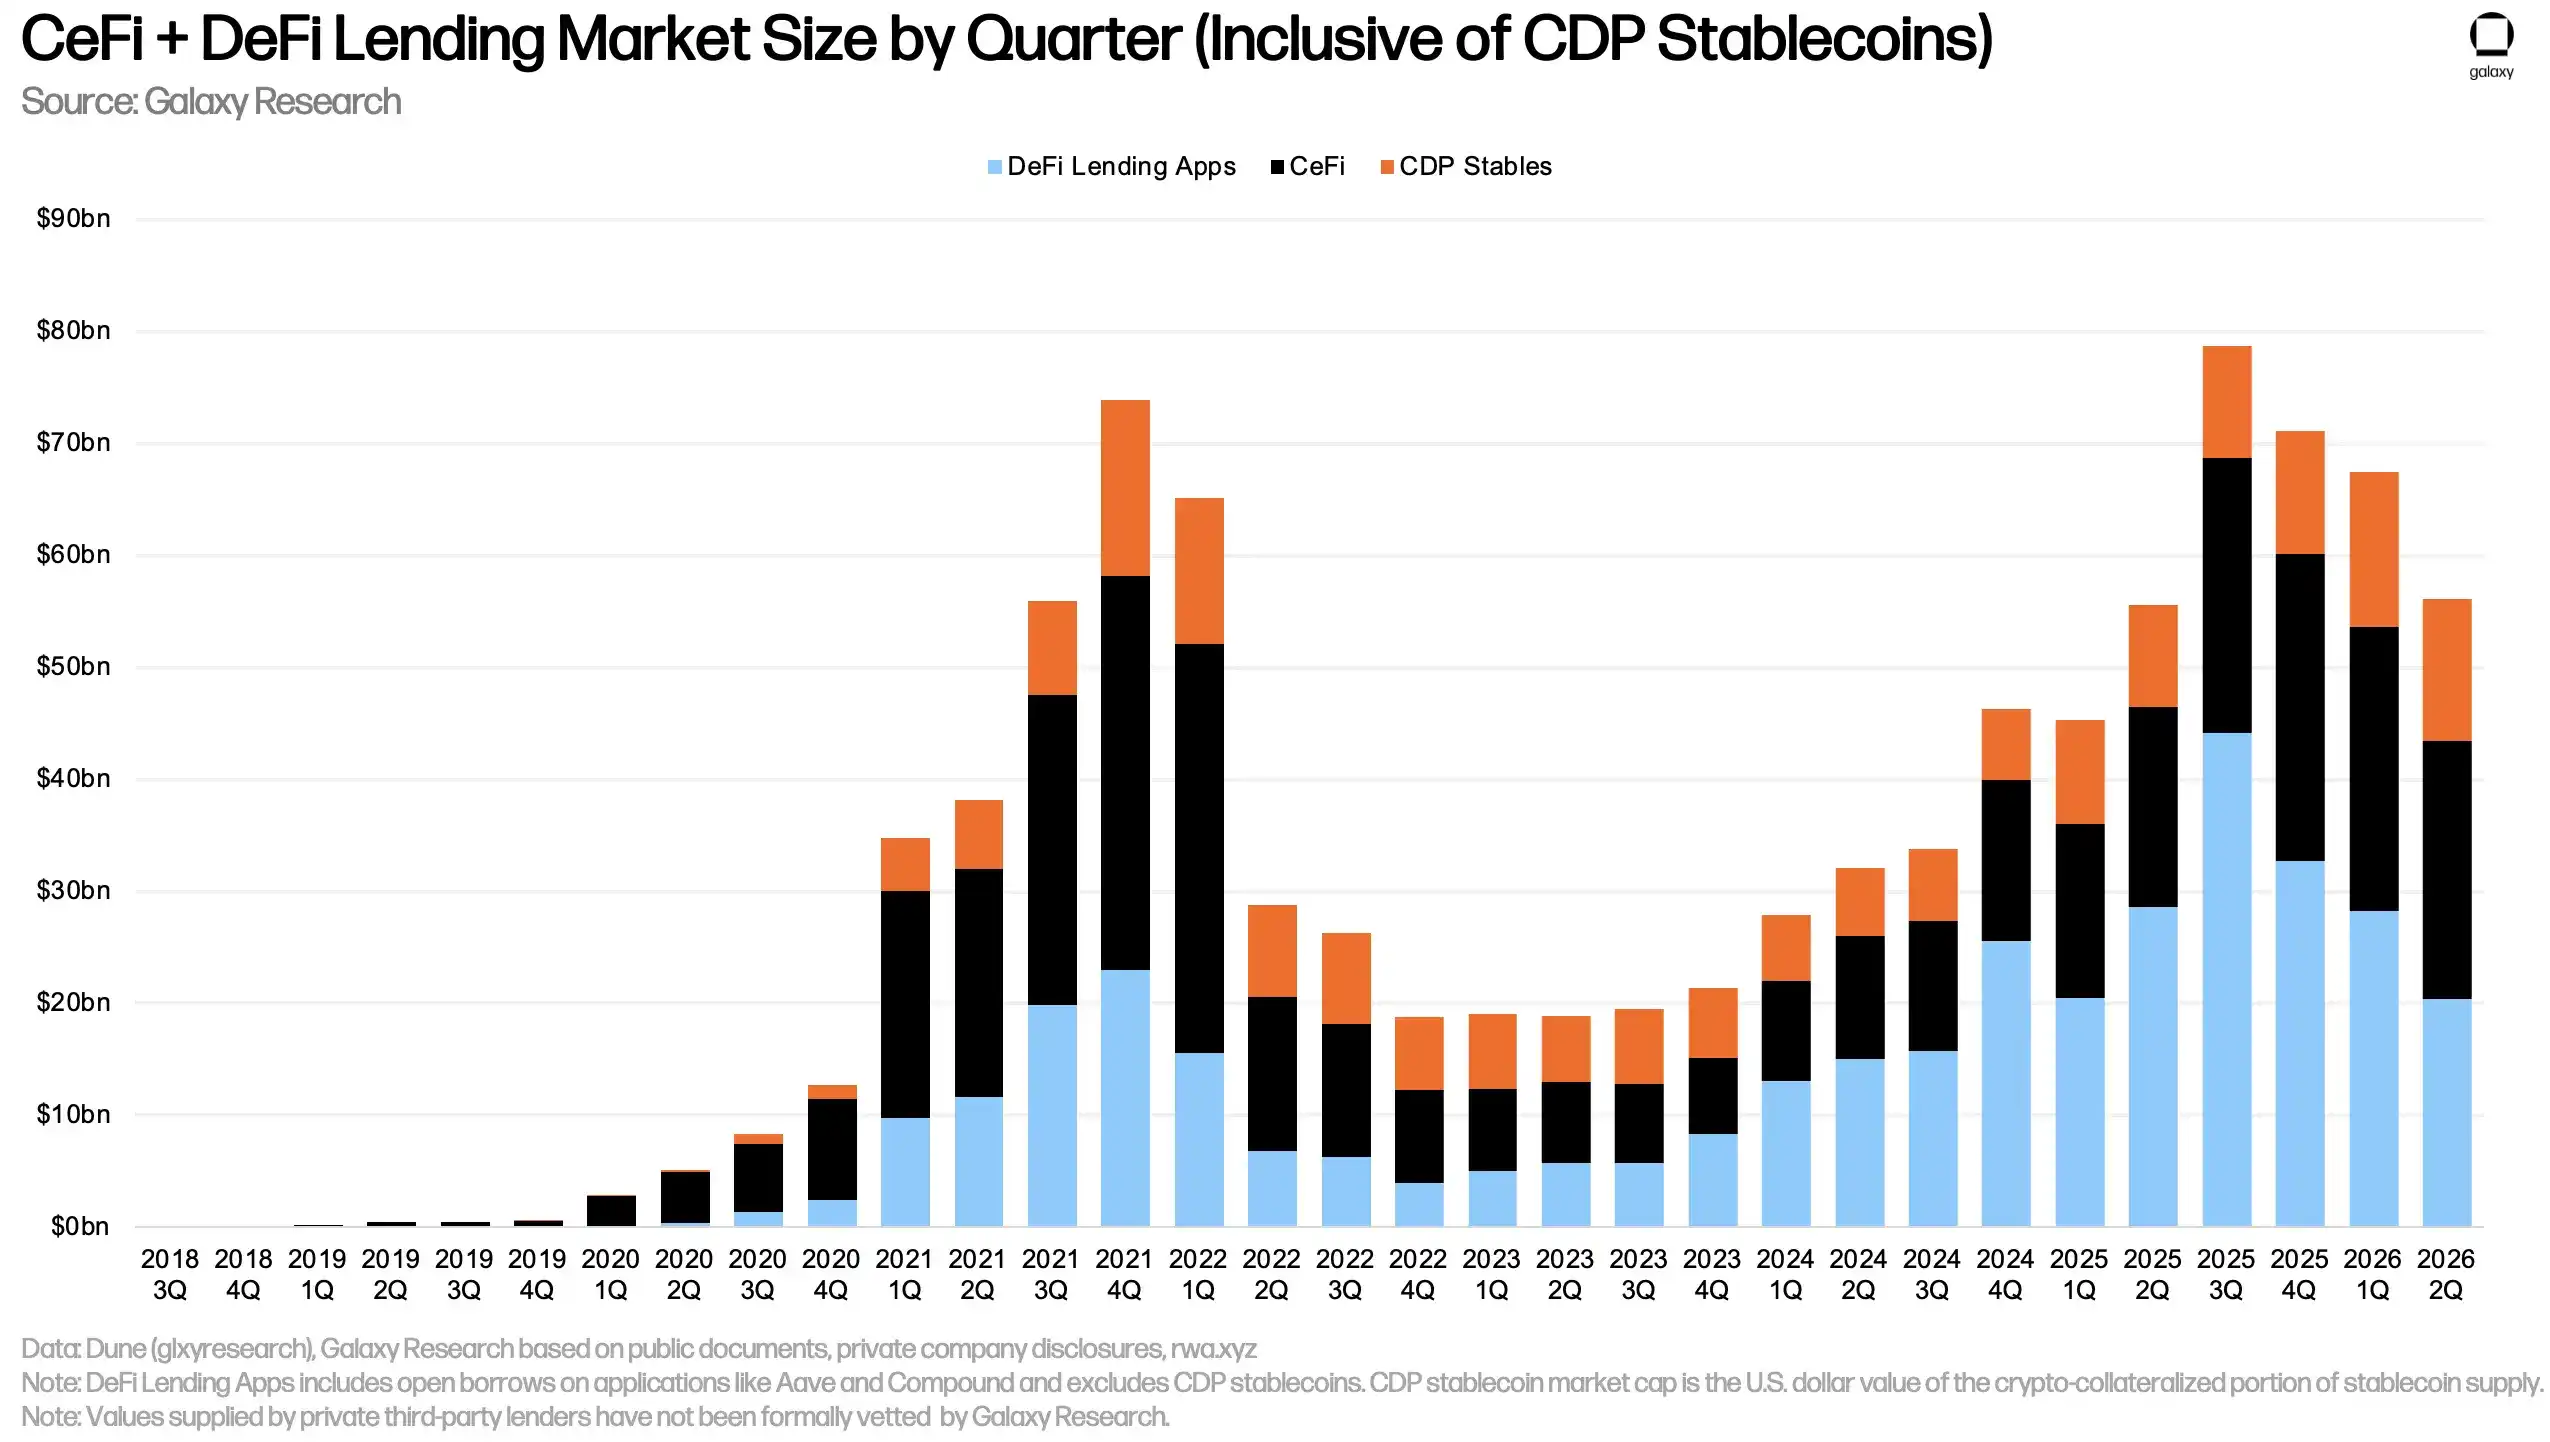
Chart: Total crypto-collateralized lending volume and changes across different components.
As of the end of Q2 2026, DeFi lending applications accounted for 36.37% of the total crypto-collateralized lending market, down 544 bps from Q1 2026; CeFi platforms accounted for 40.93%, up 324 bps; and the crypto-collateralized portion of CDP stablecoin supply accounted for 22.7%, up 220 bps.
Combining DeFi lending applications and CDP stablecoins, on-chain lending platforms still constituted 59.07% of the total market, down 324 bps from Q1 2026.
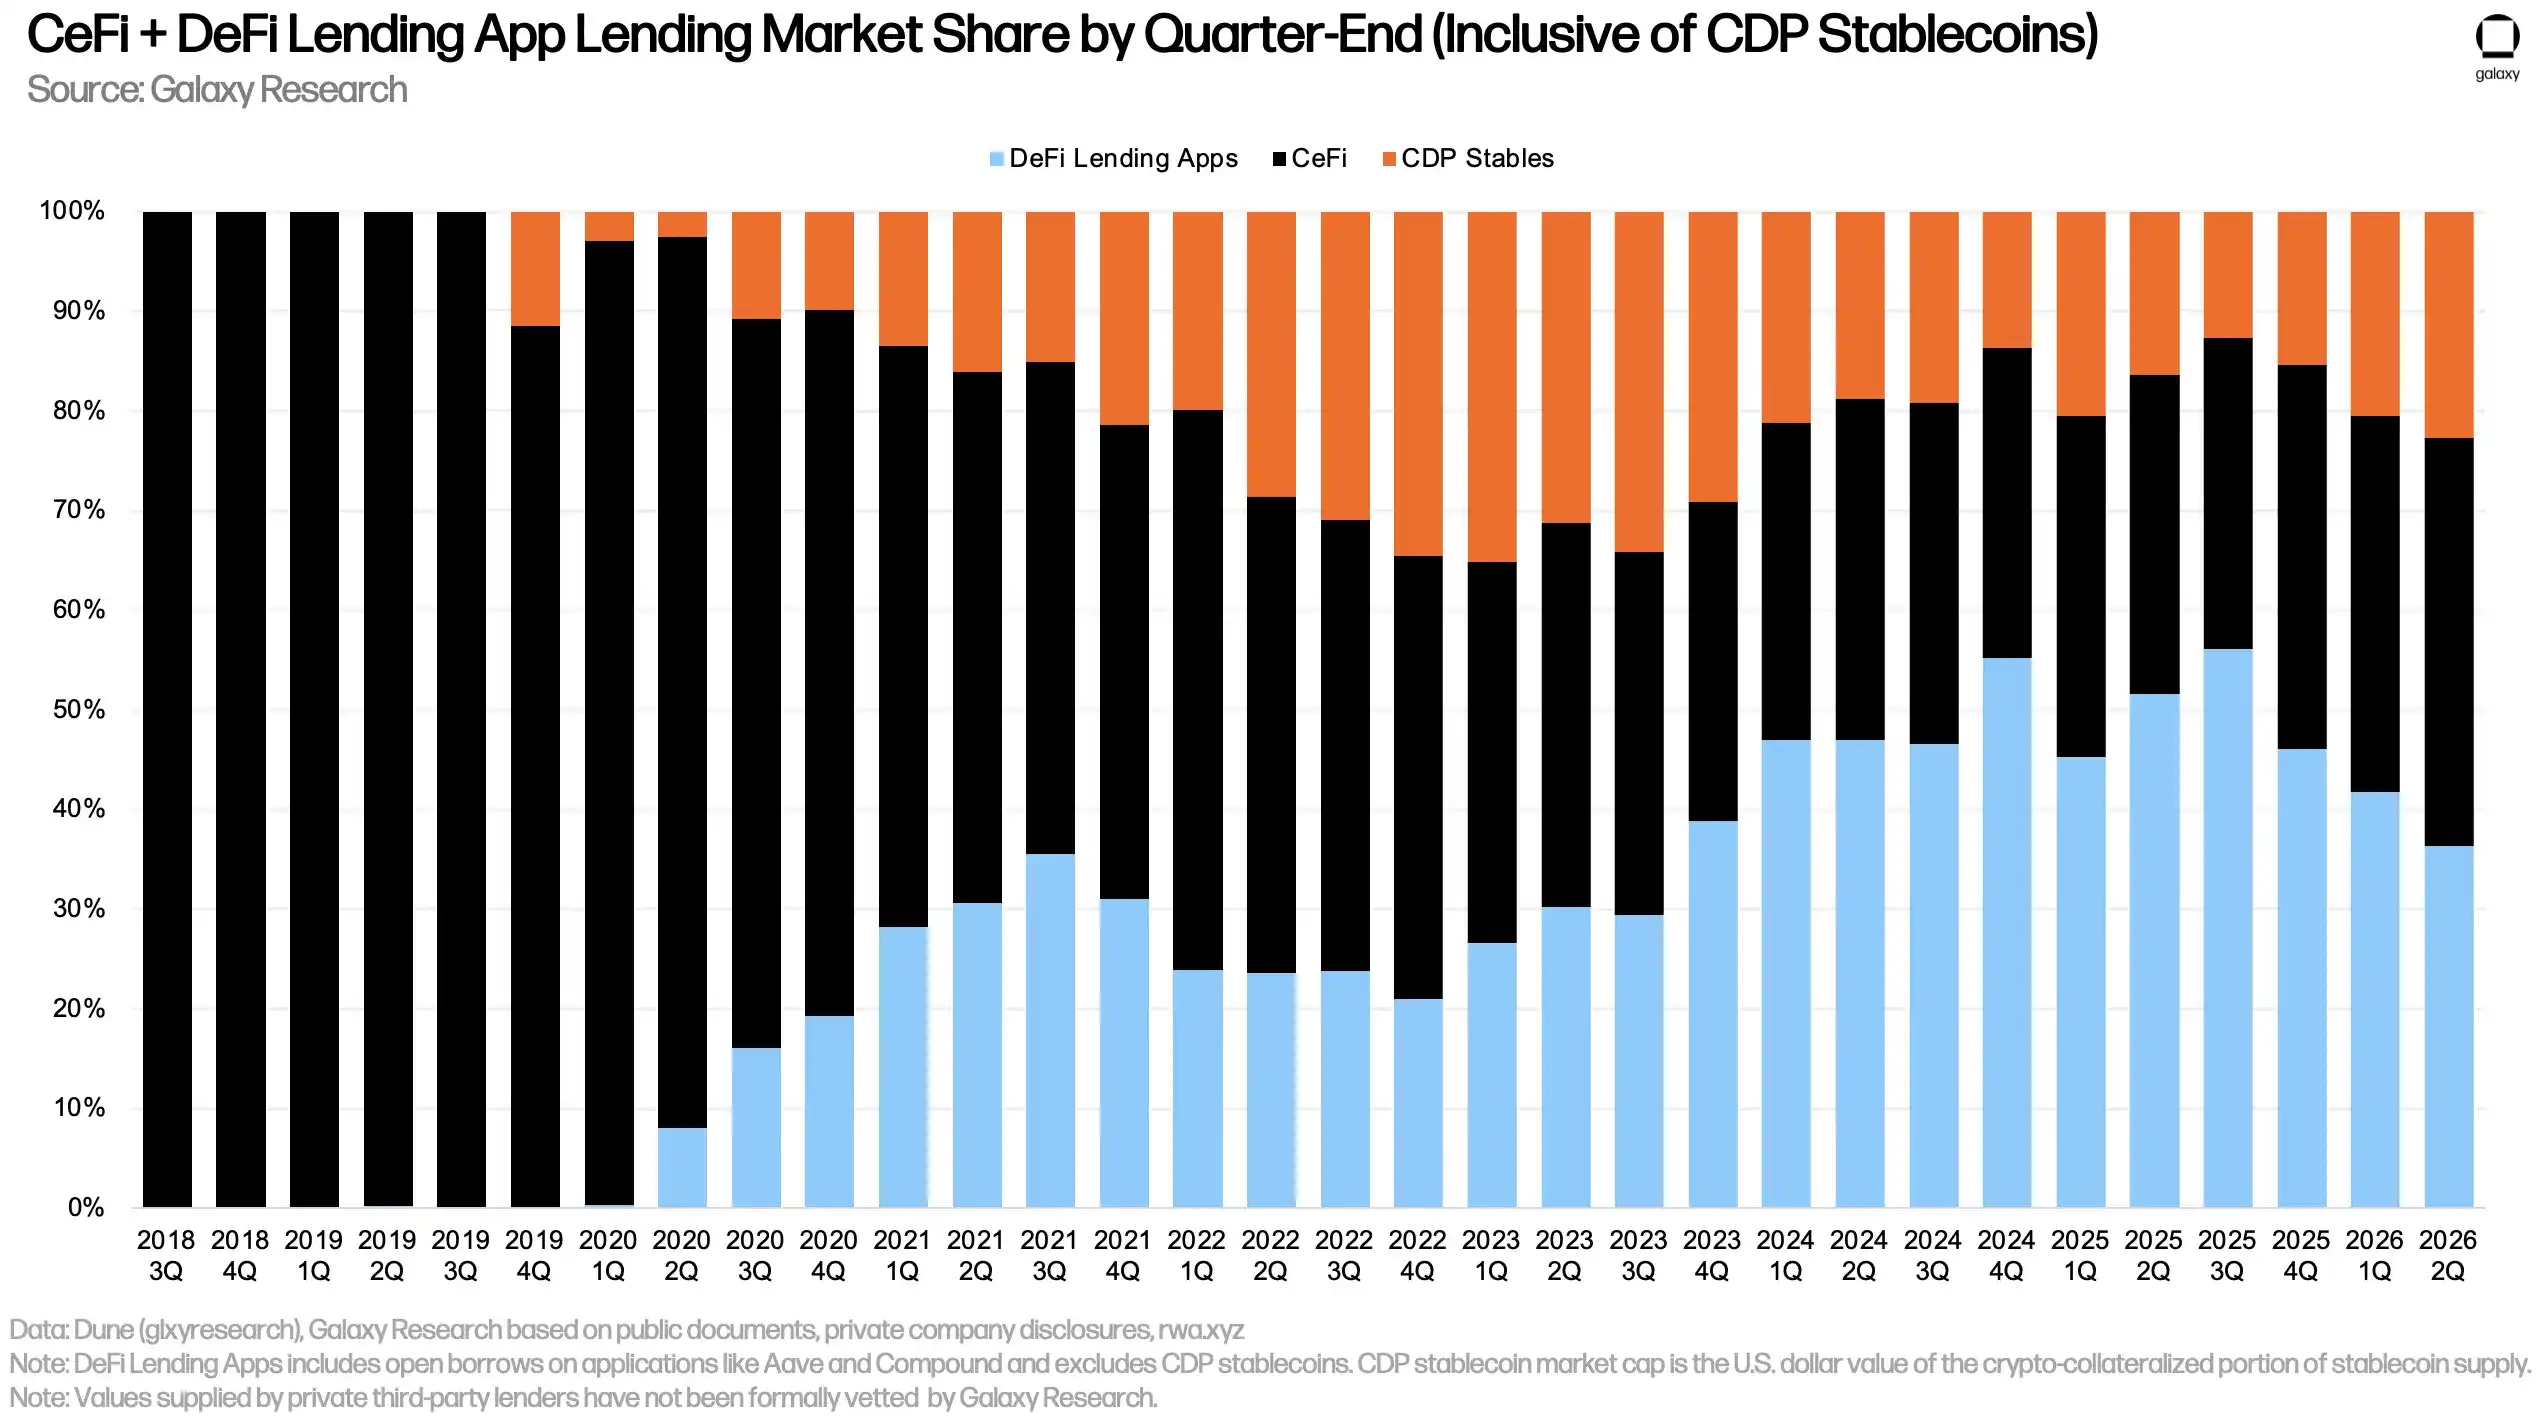
Chart: DeFi, CeFi, and CDP stablecoin shares in the crypto-collateralized lending market.
Other Perspectives on DeFi Lending
Since reaching its all-time high of $47.13 billion on September 19, 2025, outstanding borrowings in DeFi lending applications have significantly contracted. As of July 21, 2026, on-chain lending stood at $21.94 billion, down $25.19 billion (53.45%) from the peak.
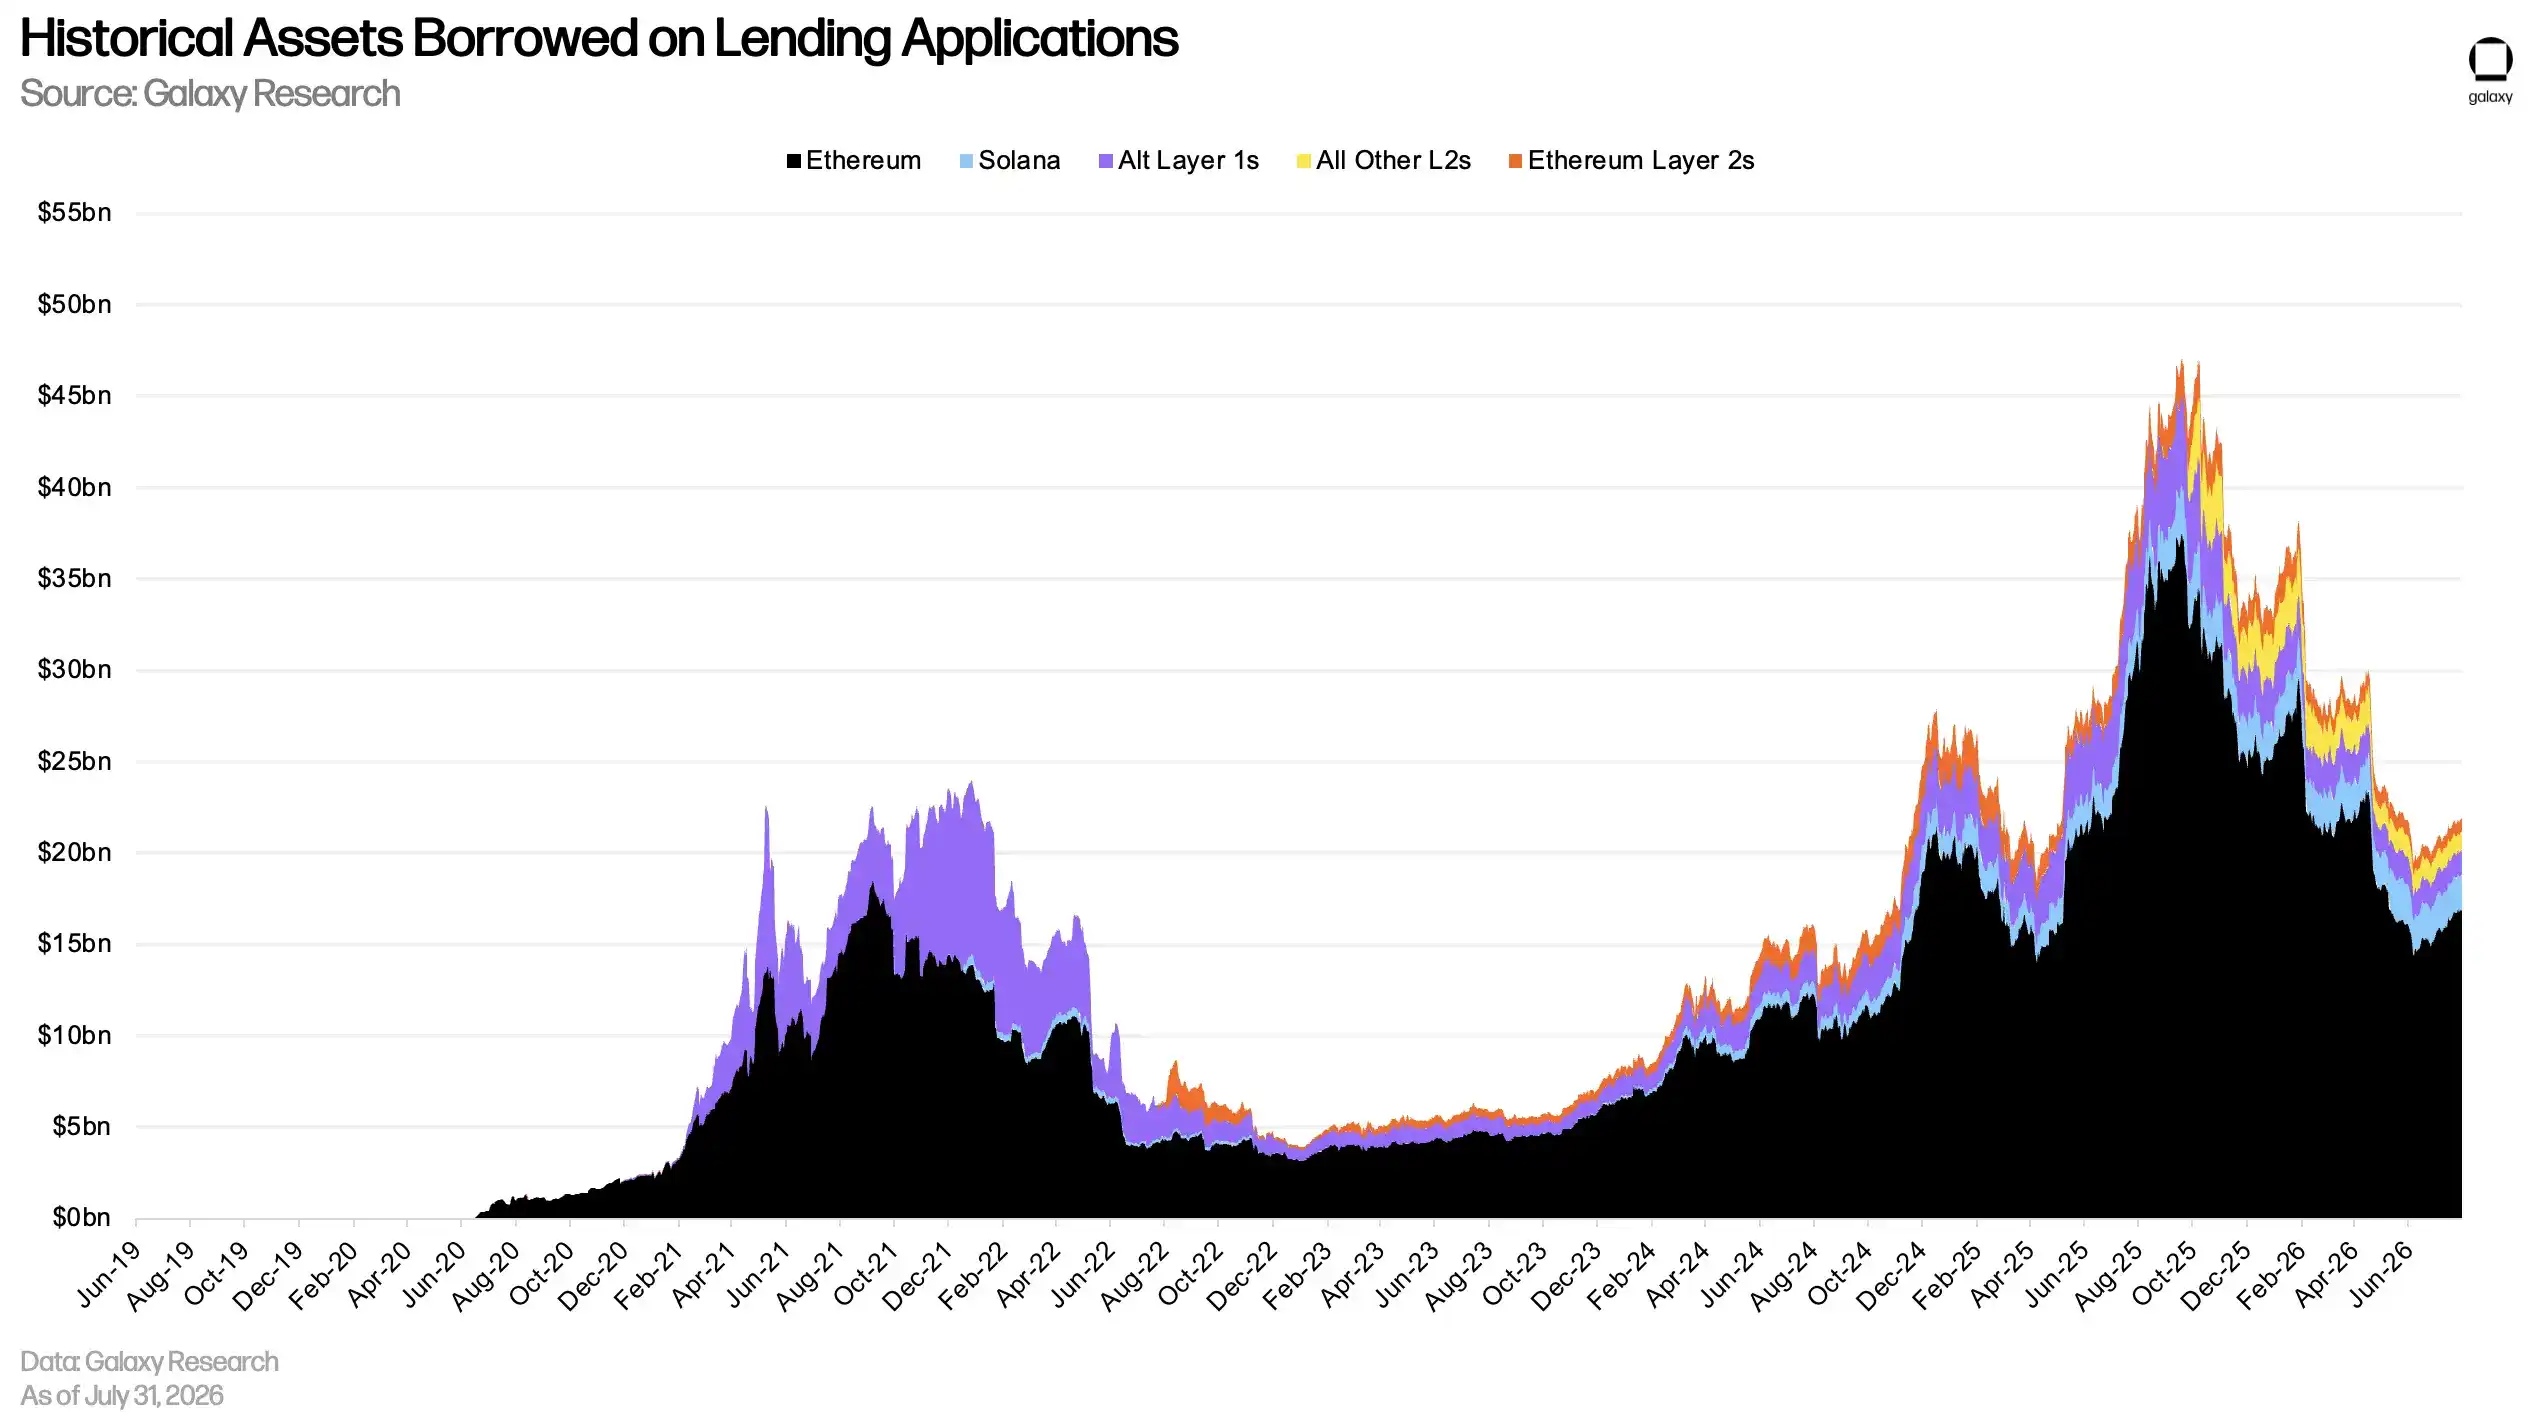
Chart: DeFi lending application outstanding borrowings since the 2025 peak.
Since the end of Q1 2026, the drawdown in DeFi outstanding borrowings has intensified further but has recently begun to moderate slightly.
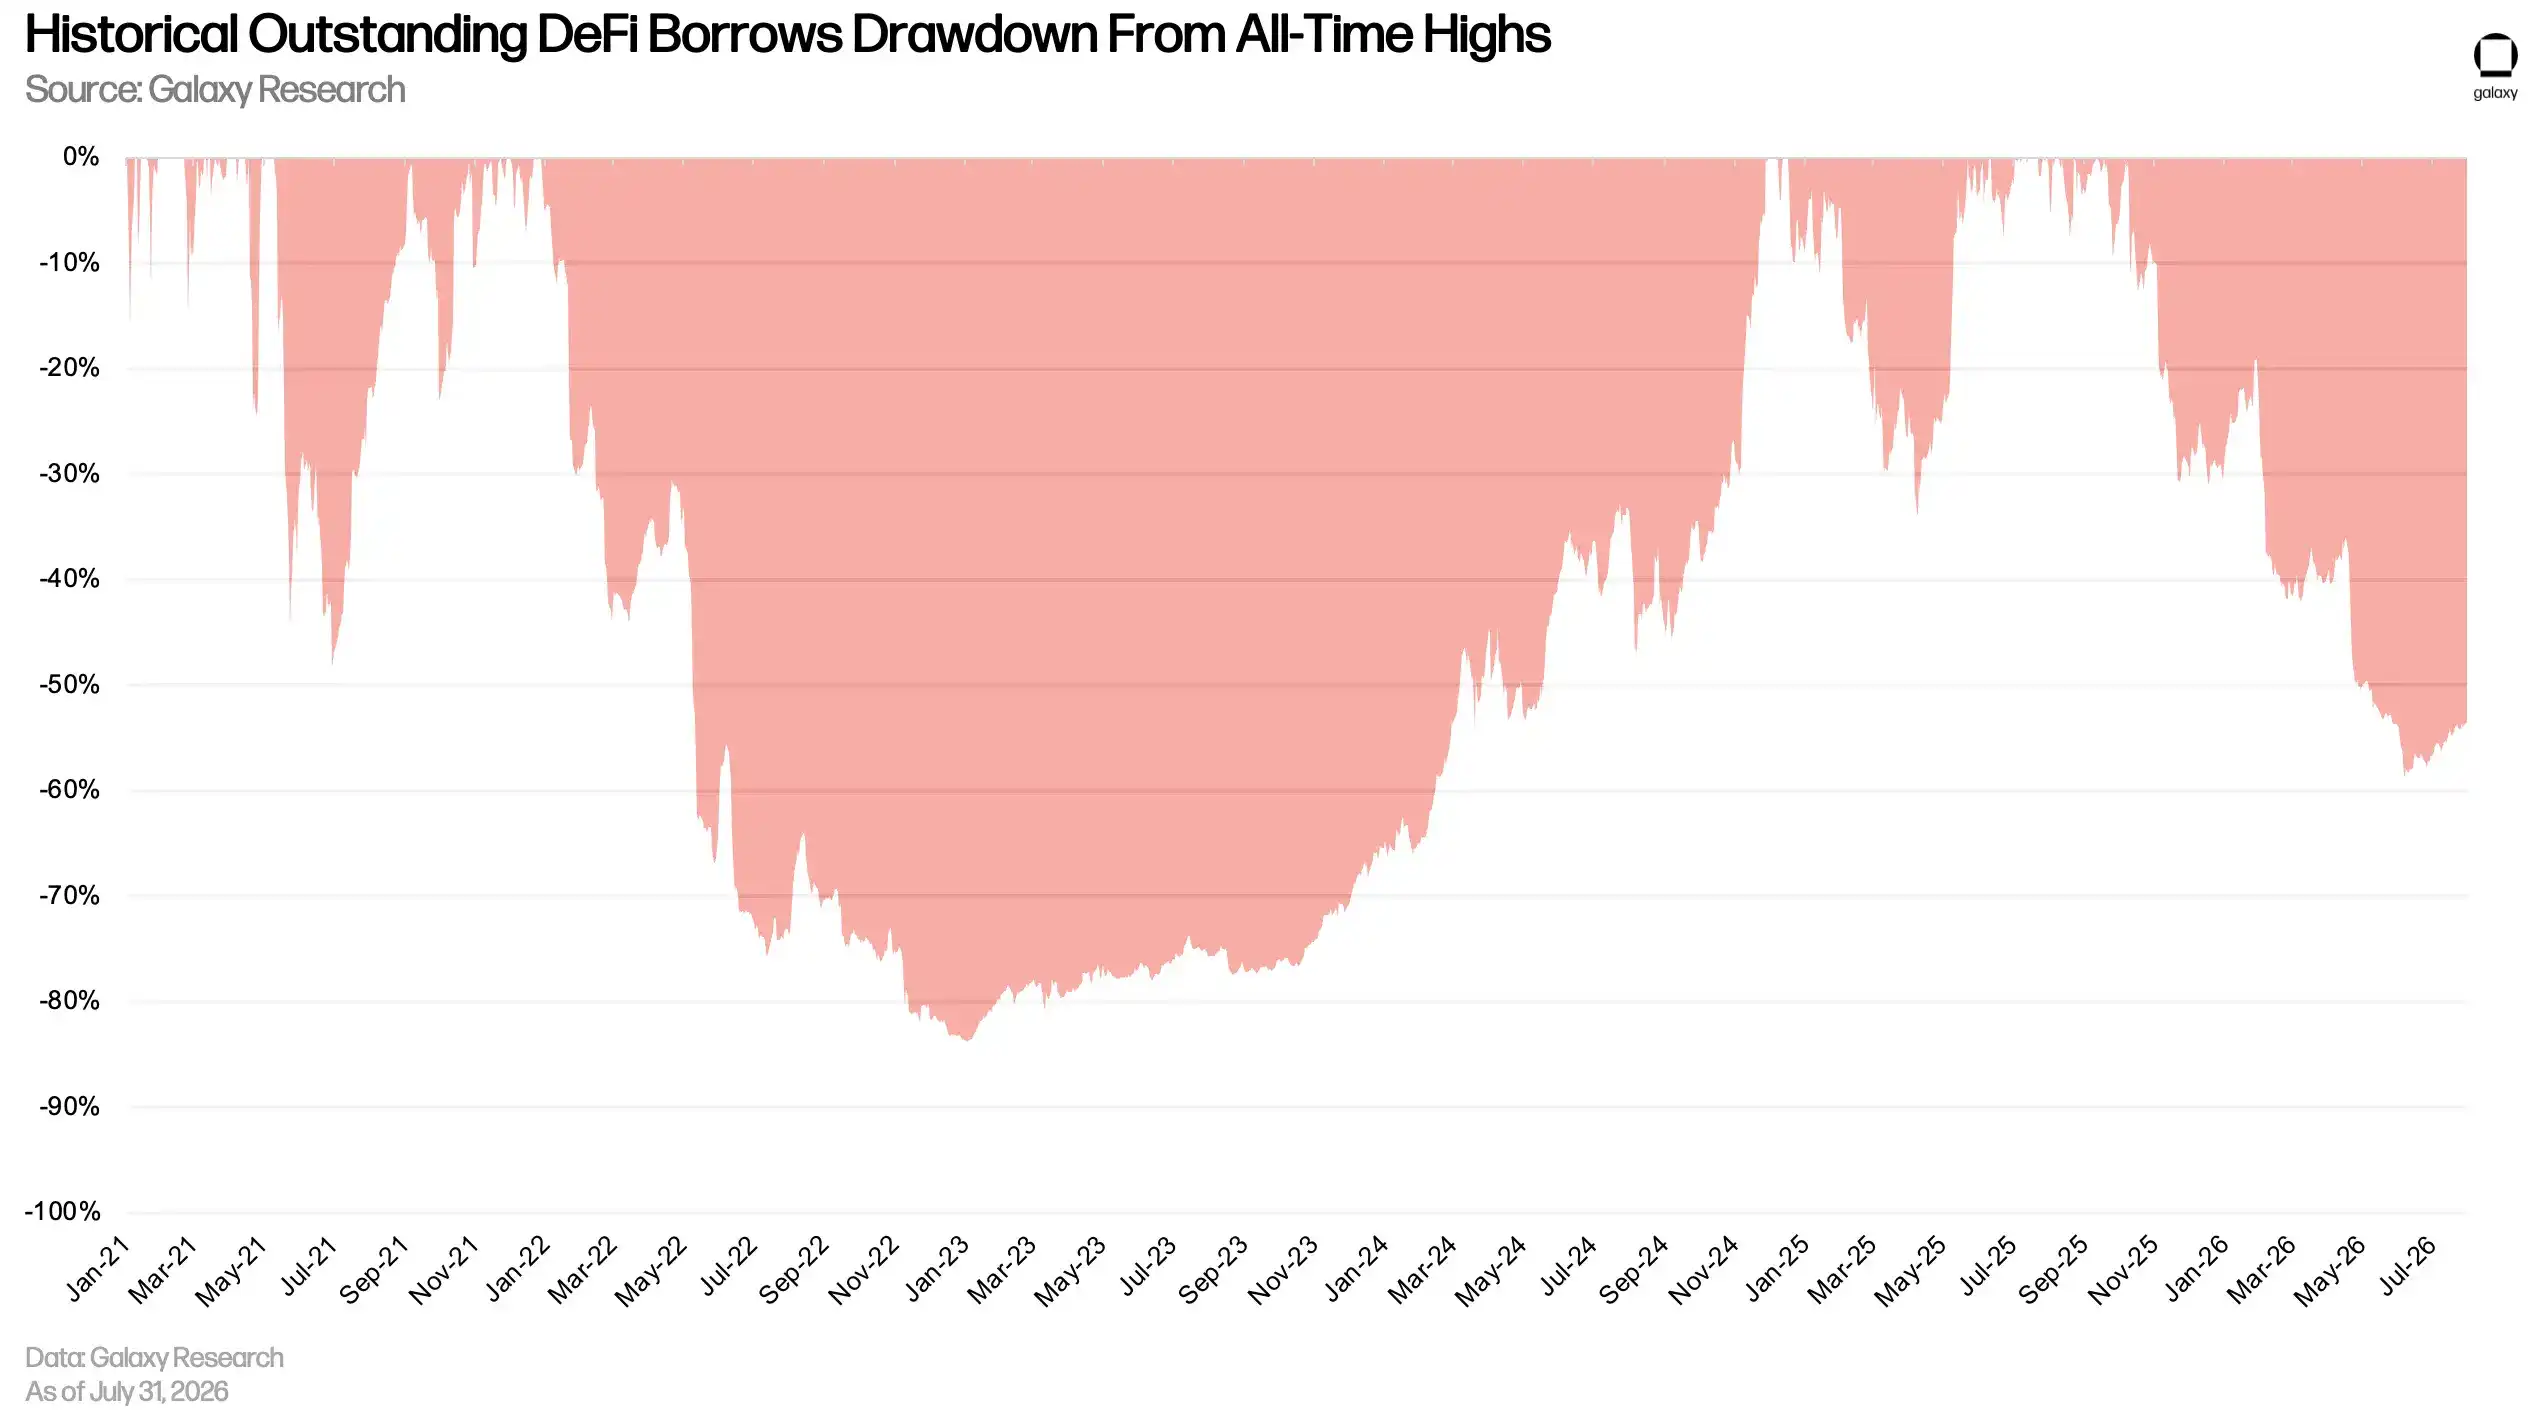
Chart: Recent changes in the drawdown magnitude of DeFi outstanding borrowings.
Stablecoins
Stablecoin weighted average borrowing rates increased in Q2. On a seven-day moving average basis, stablecoin borrowing rates rose by 27 bps from March 31 to June 30. After the quarter ended, stablecoin rates continued to climb to 3.88%.
This metric combines borrowing costs in lending protocols and minting fees for CDP stablecoins, weighted by outstanding borrowings.
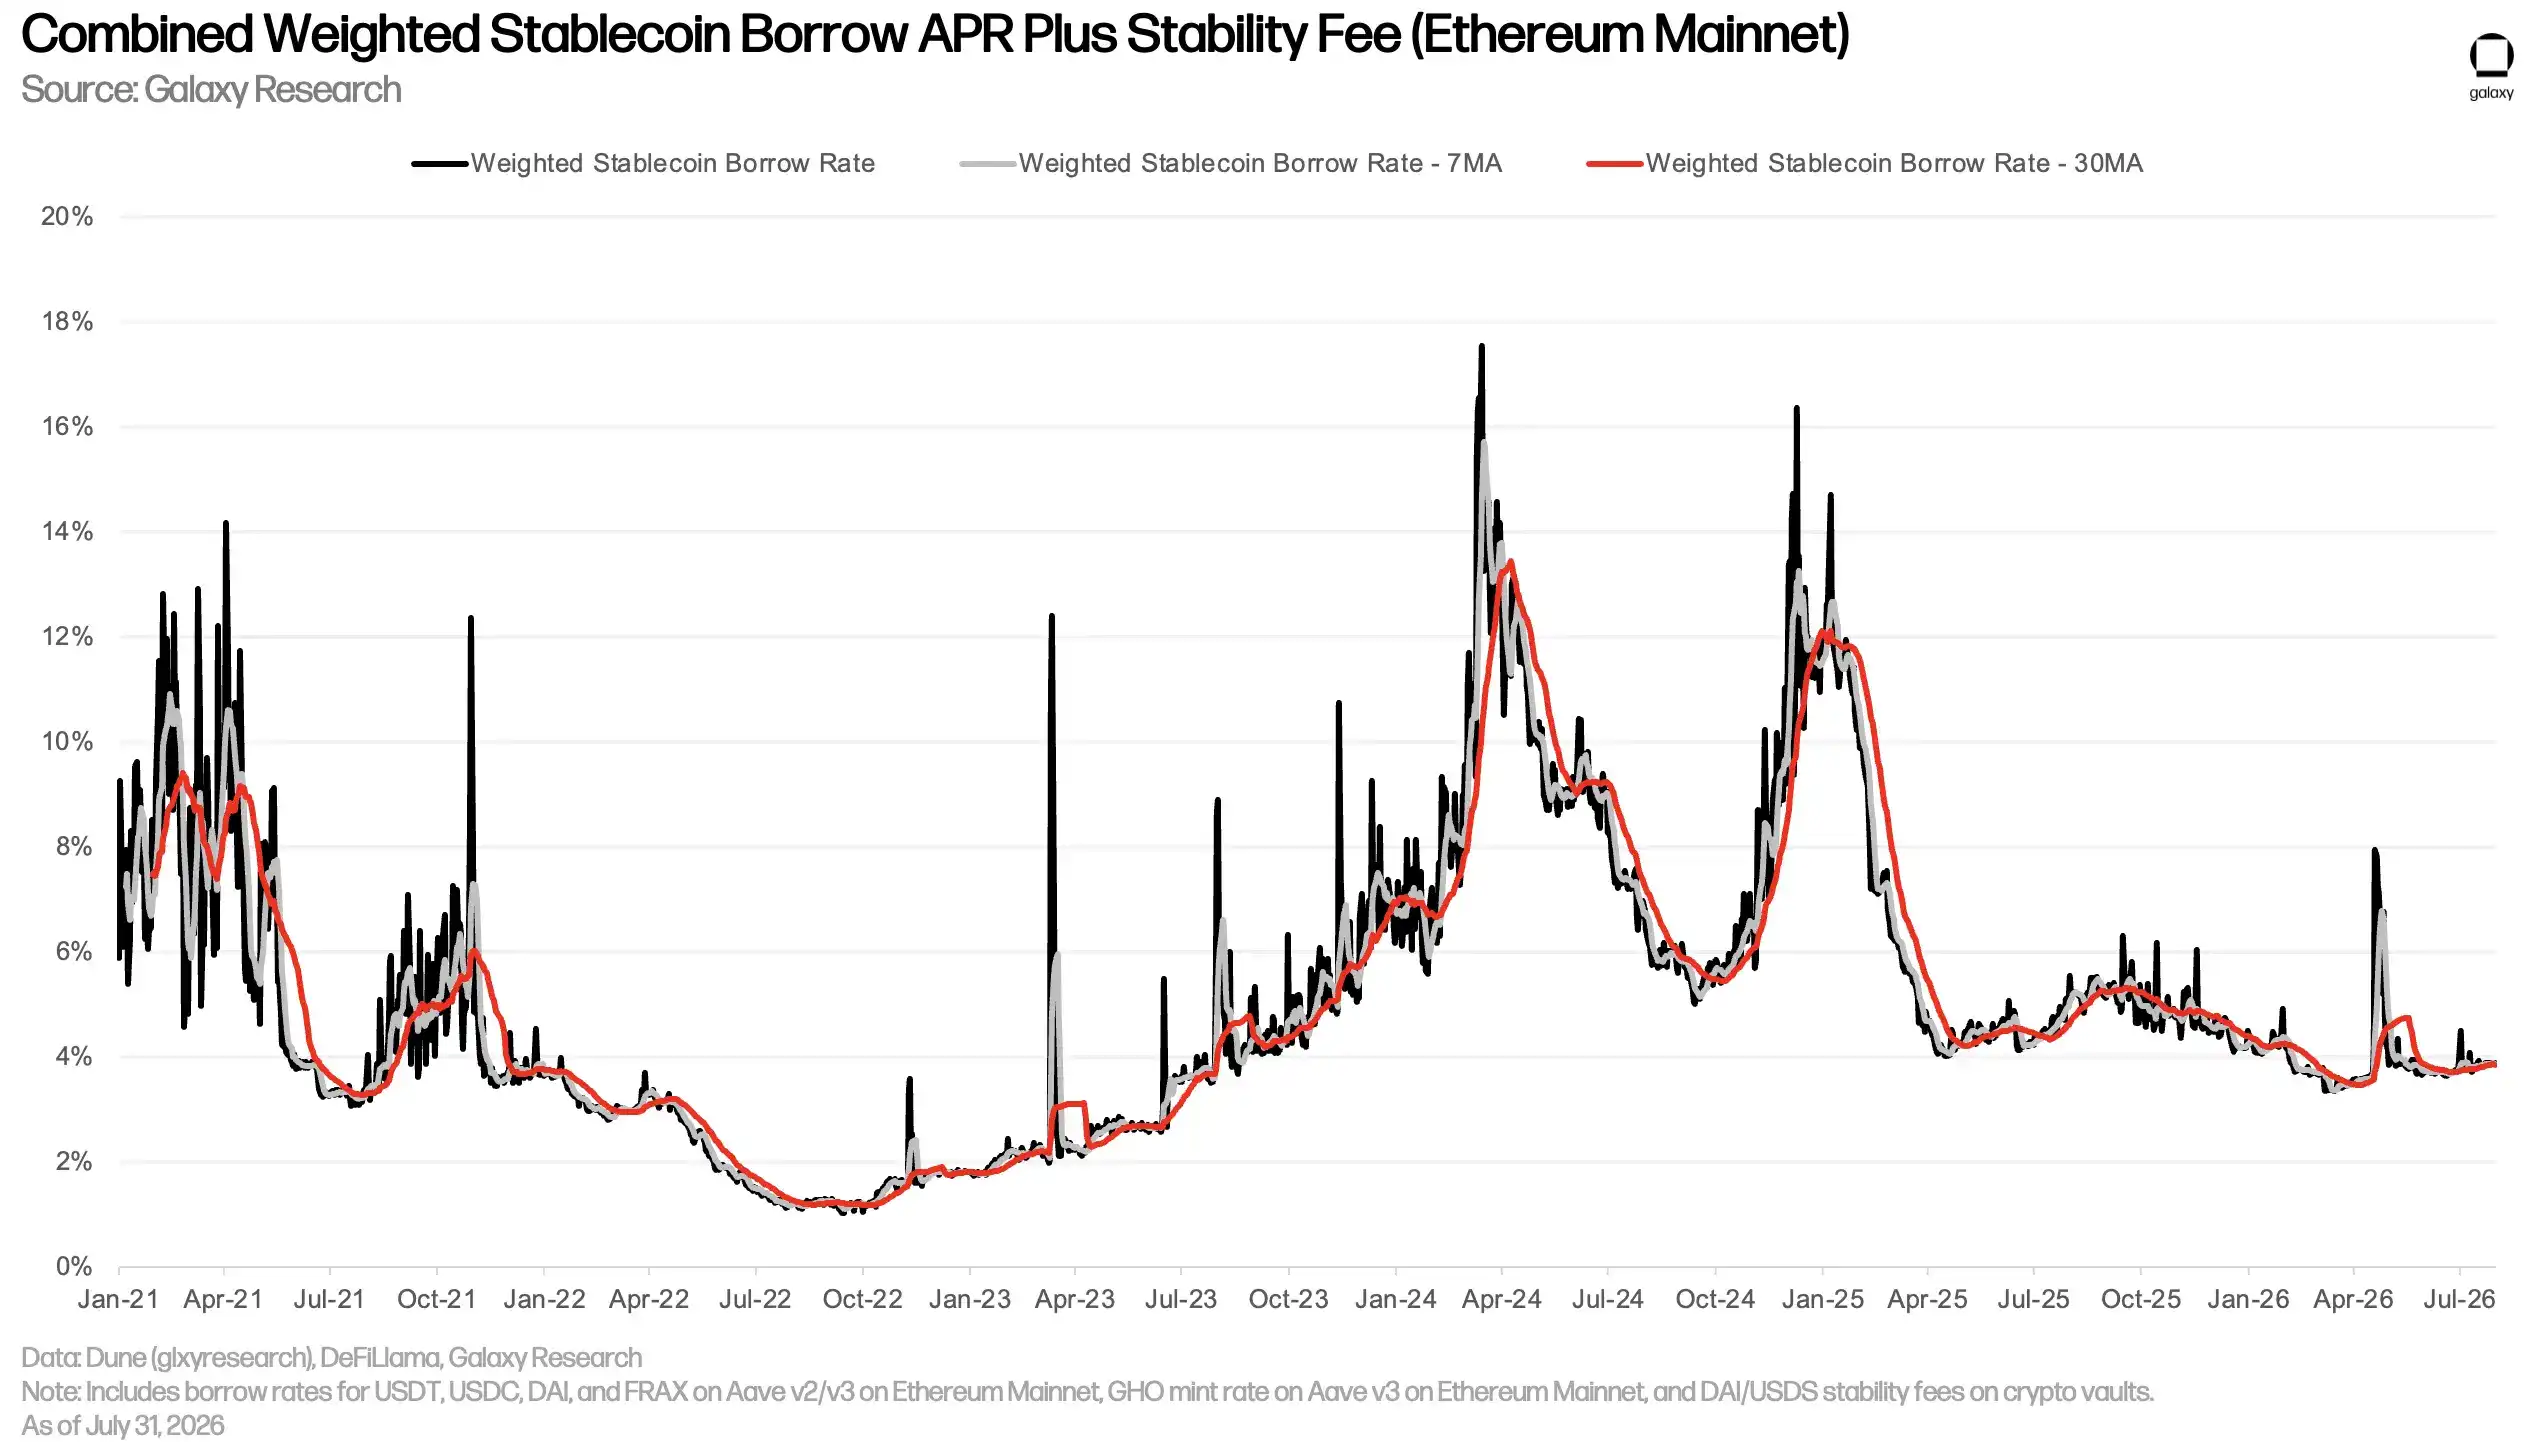
Chart: Stablecoin weighted average borrowing rate trend.
The chart below further breaks down the cost of borrowing stablecoins via lending applications versus minting CDP stablecoins using crypto collateral. The two rates track closely, though CDP minting rates typically exhibit less volatility as they are periodically adjusted manually rather than moving entirely in sync with the market. For over 21 months, both rates have had the Federal Funds Rate as a lower bound.
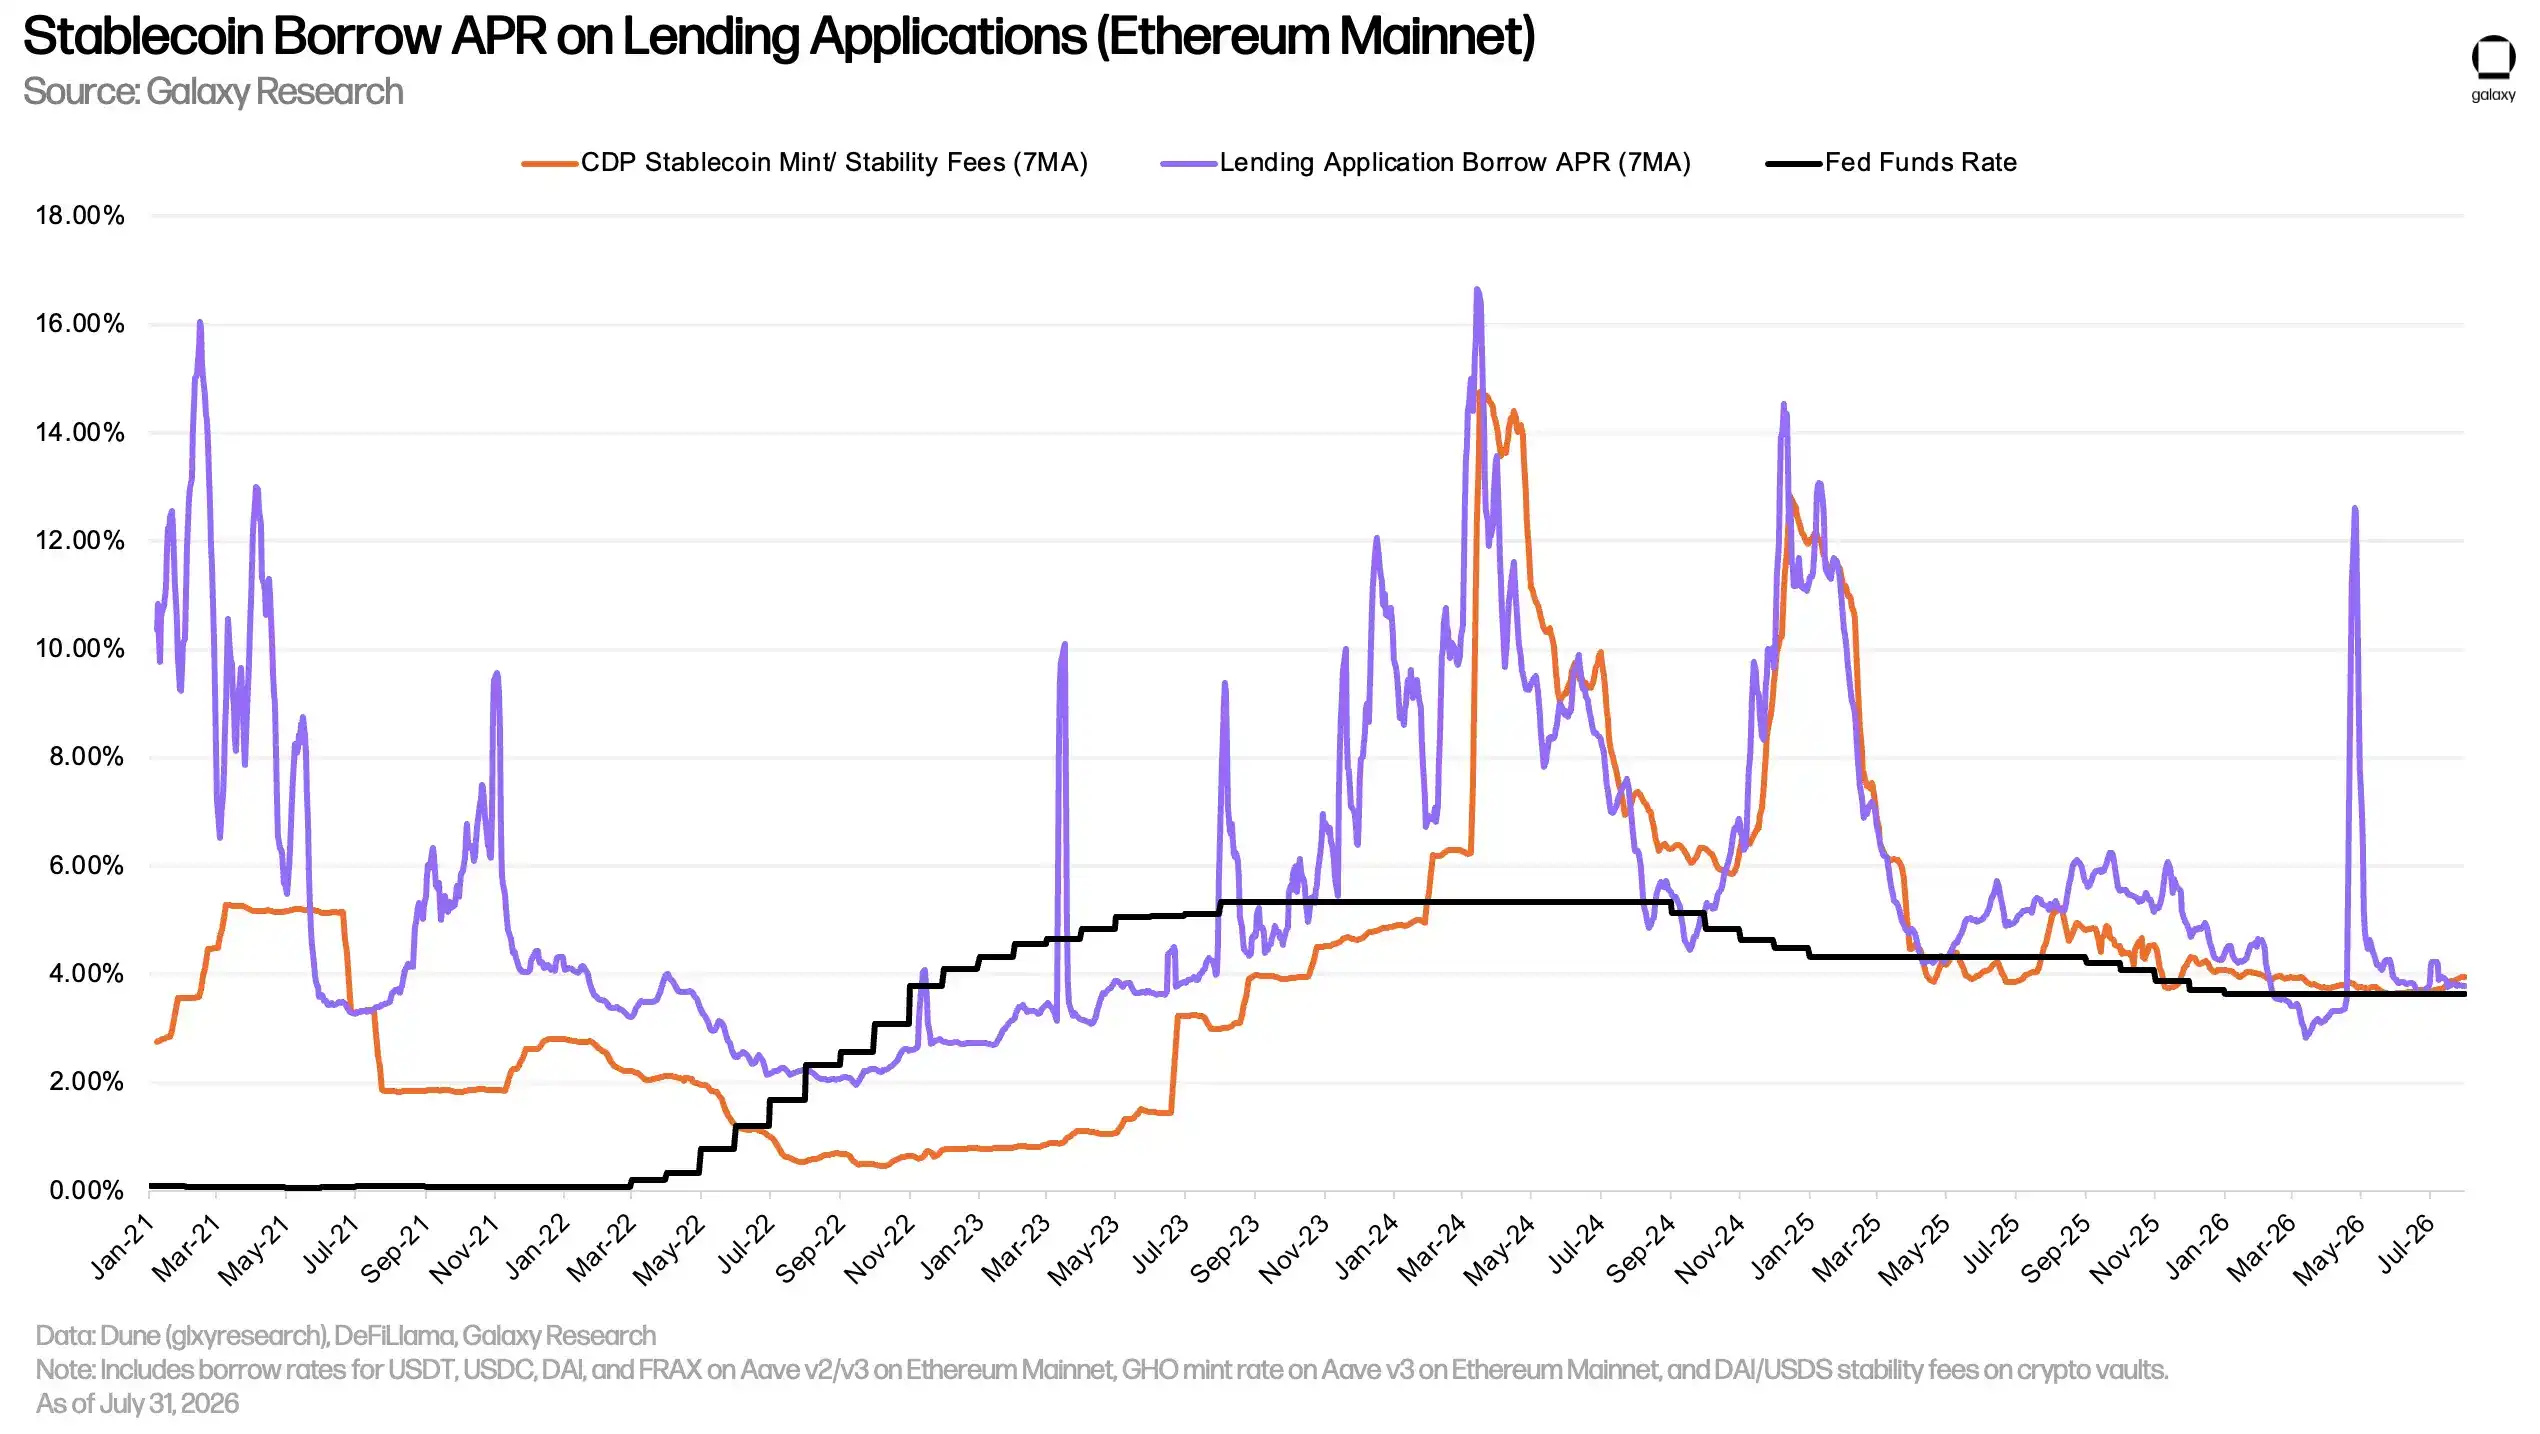
Chart: DeFi stablecoin borrowing rate, CDP stablecoin minting rate vs. Federal Funds Rate.
Throughout Q2, the benchmark OTC lending rate for USDC fluctuated between 4.25% and 5%. At quarter-end, the rate was 4.25% and remained there until August 3.
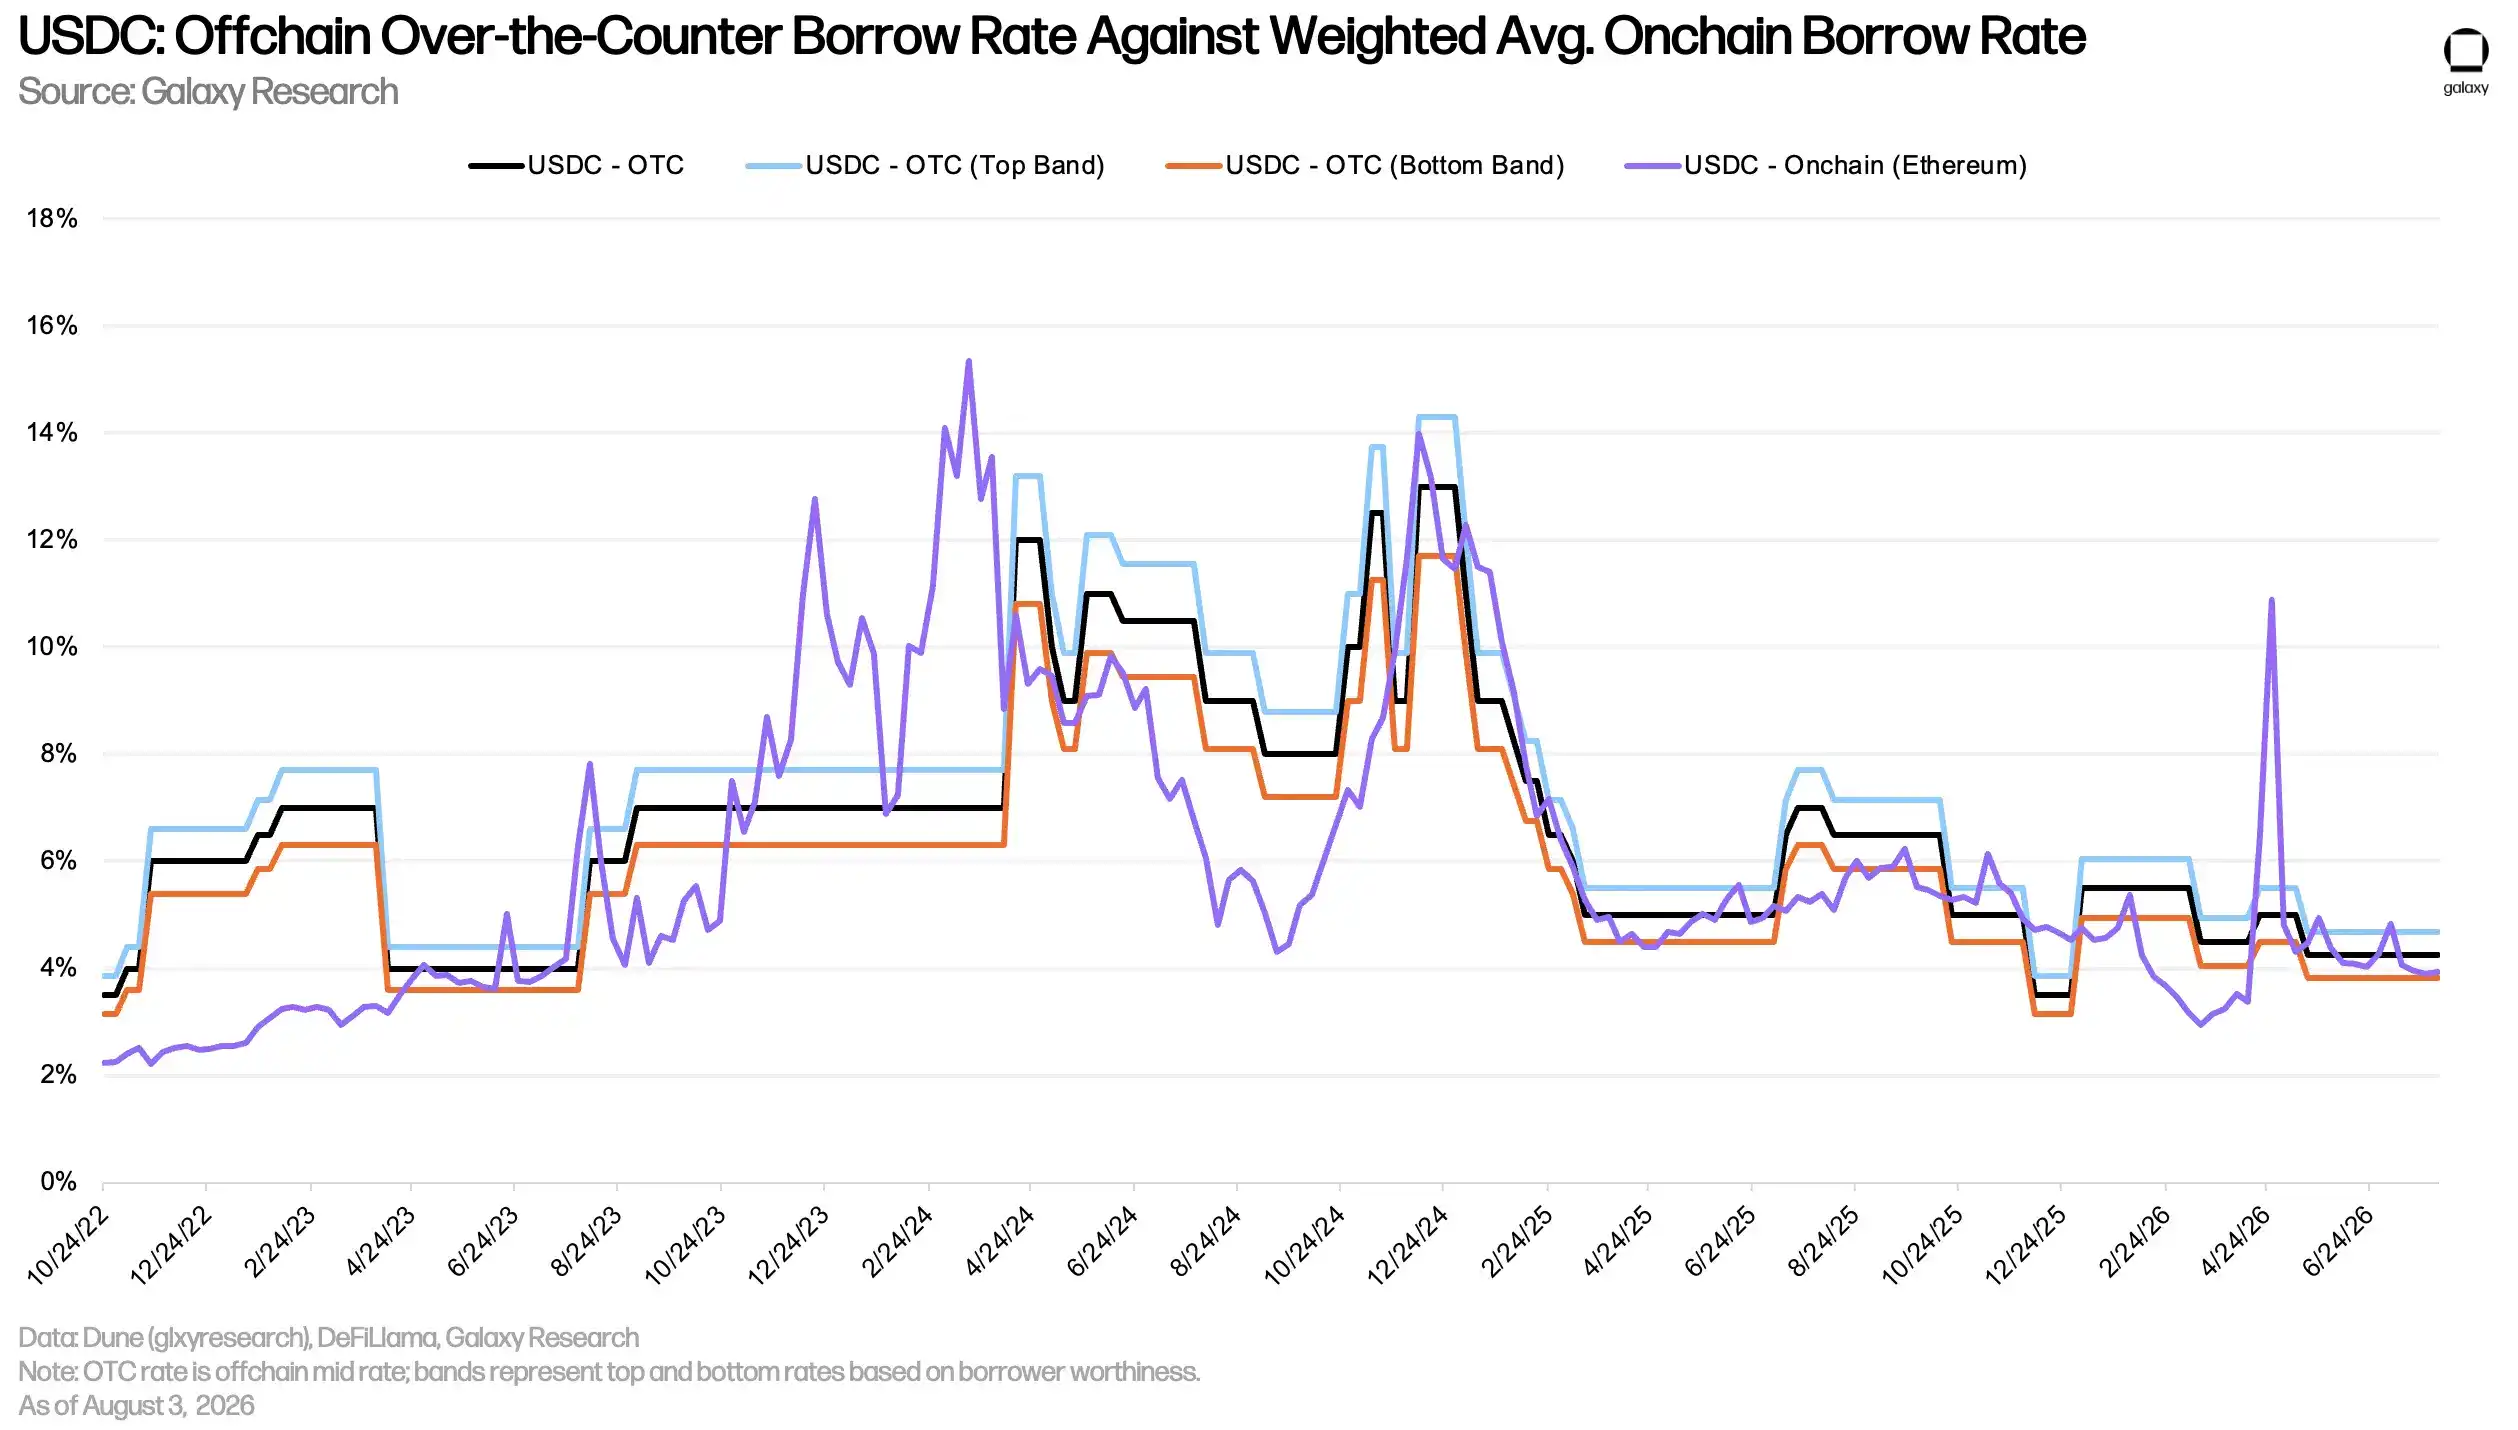
Chart: USDC on-chain and OTC lending rate trends.
The chart below tracks the same rate metrics but for USDT. Like USDC's OTC rates, USDT's relevant rates also fluctuated between 4.25% and 5%.
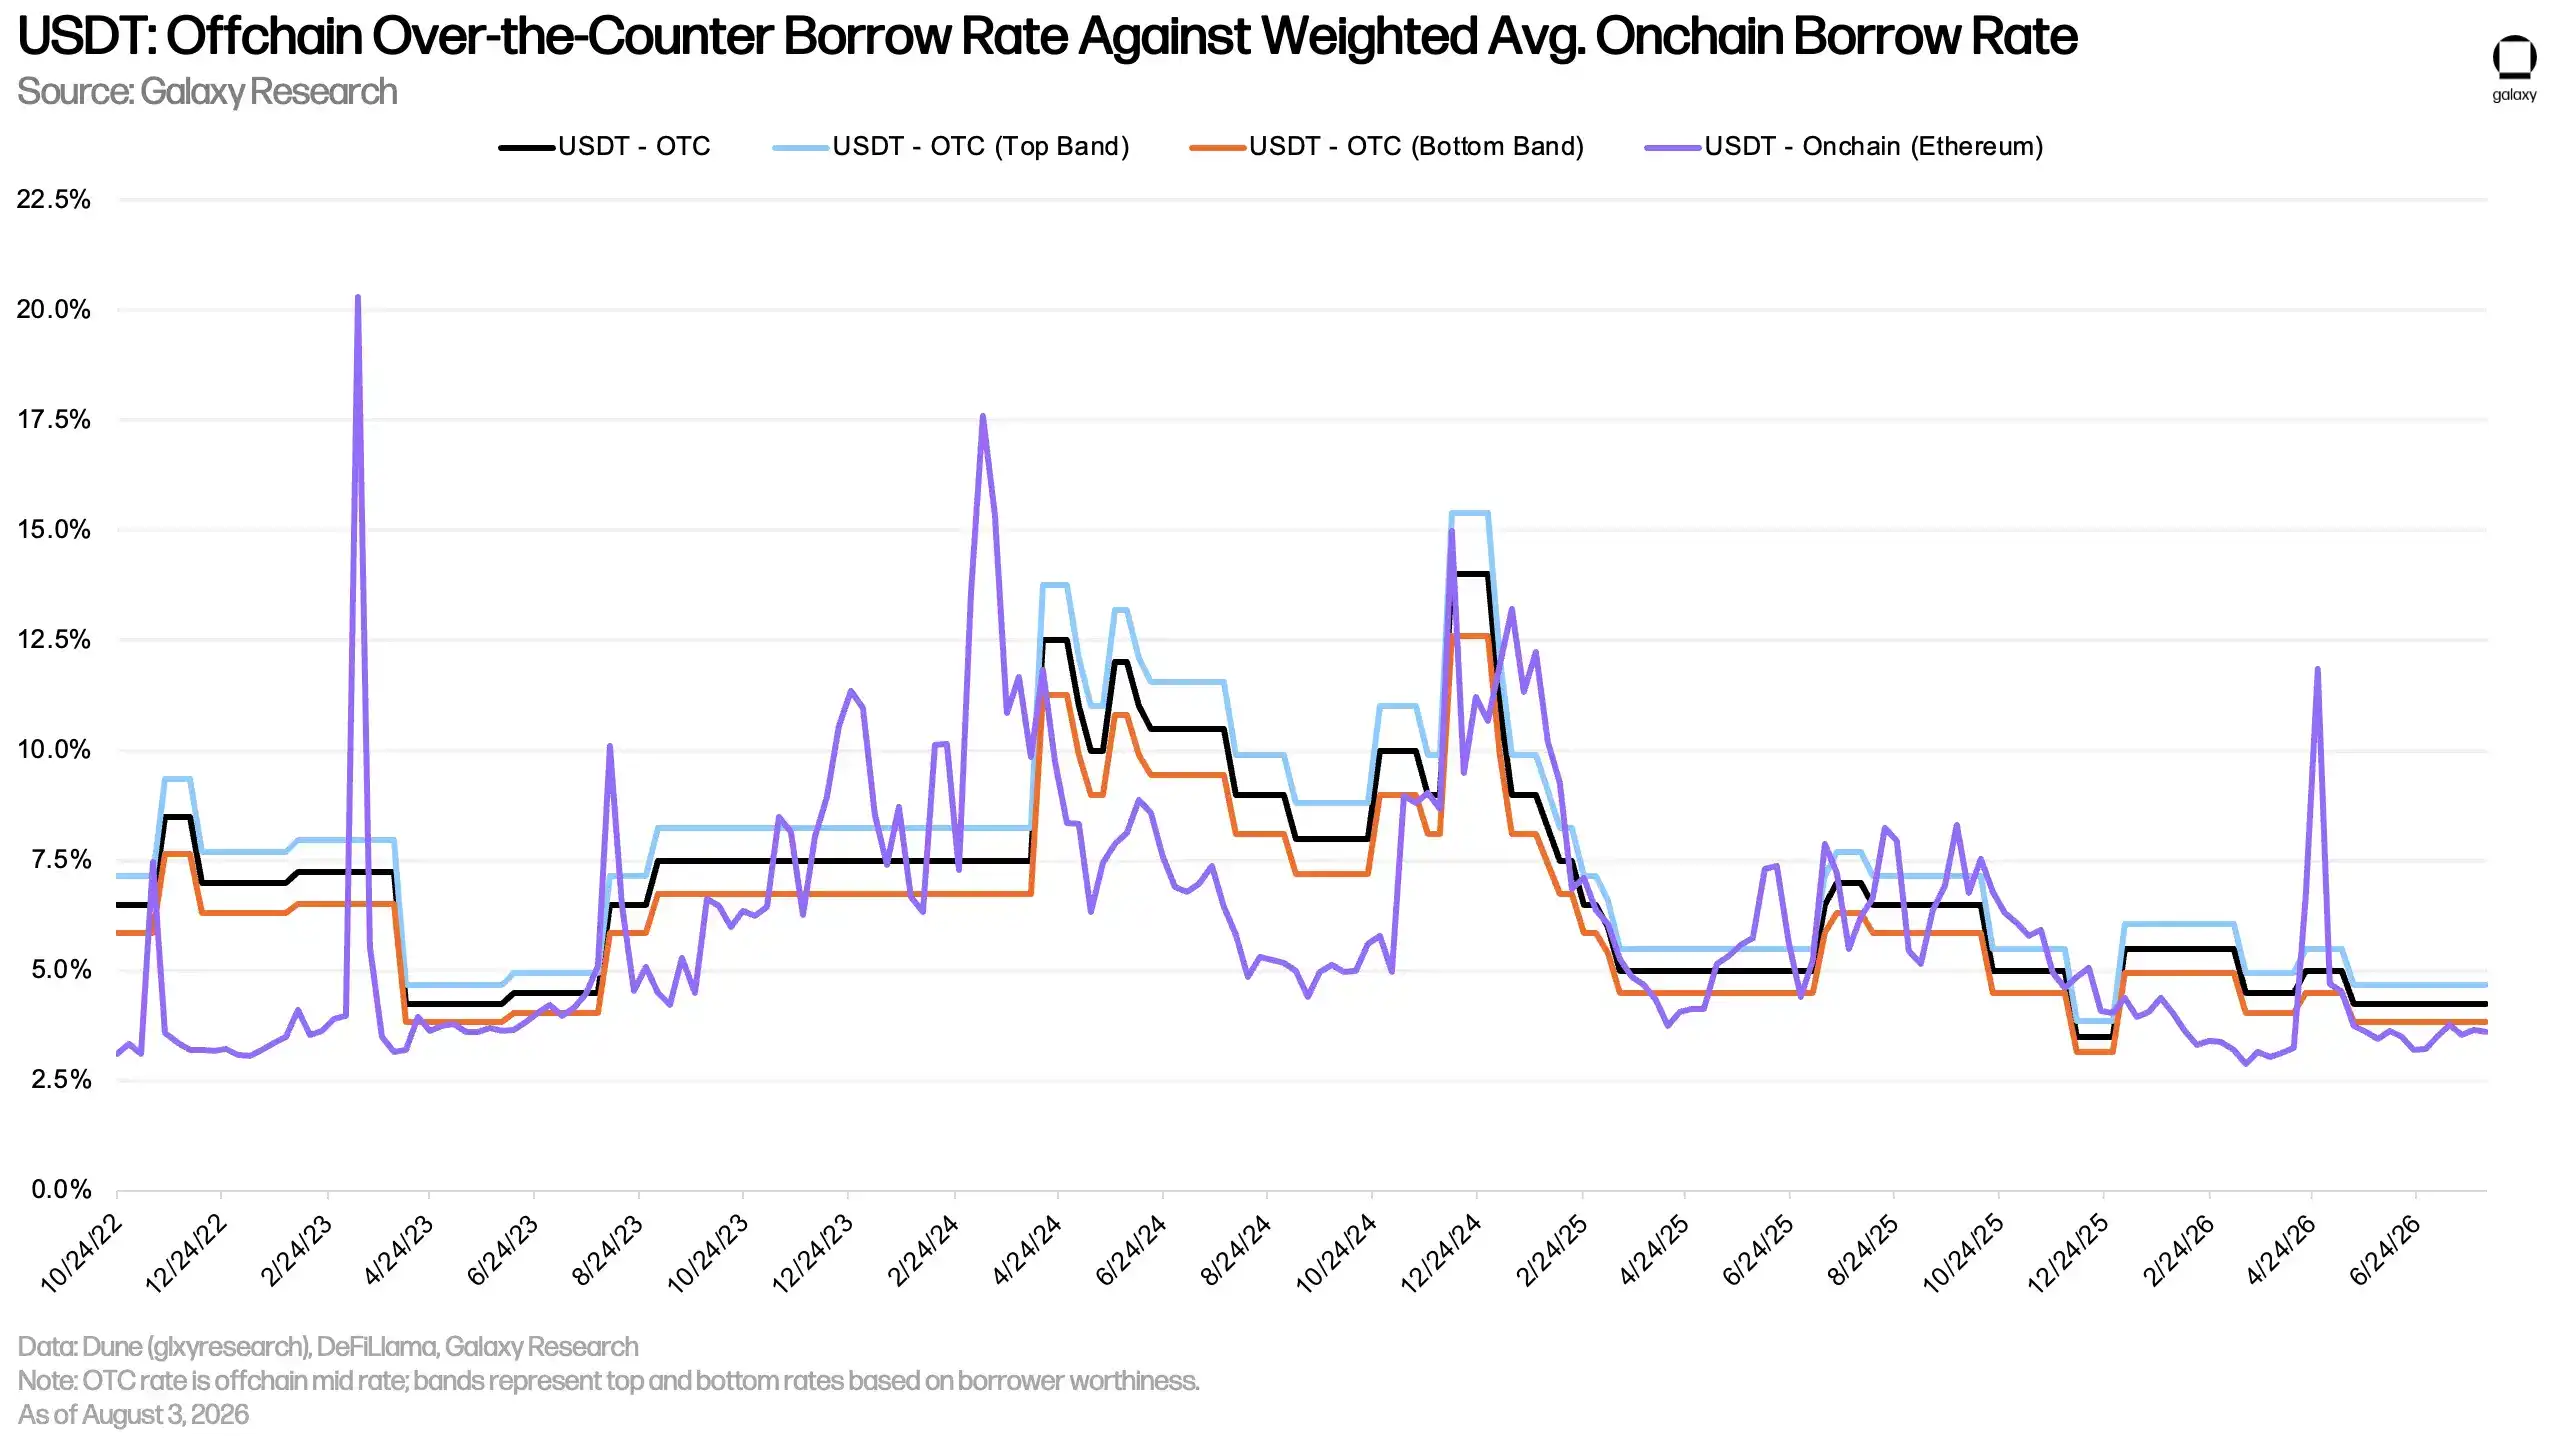
Chart: USDT on-chain and OTC lending rate trends.
Bitcoin
The chart below shows the weighted borrowing rate for Wrapped Bitcoin (WBTC) across multiple lending applications and blockchain networks. The cost of borrowing WBTC on-chain is typically low because wrapped Bitcoin is primarily used as collateral in on-chain markets, with less intrinsic demand for borrowing WBTC itself. Unlike stablecoins, on-chain BTC borrowing costs are relatively stable as users borrow and repay BTC less frequently.
In Q2, on-chain BTC borrowing rates fluctuated between 0.44% and 0.5%.
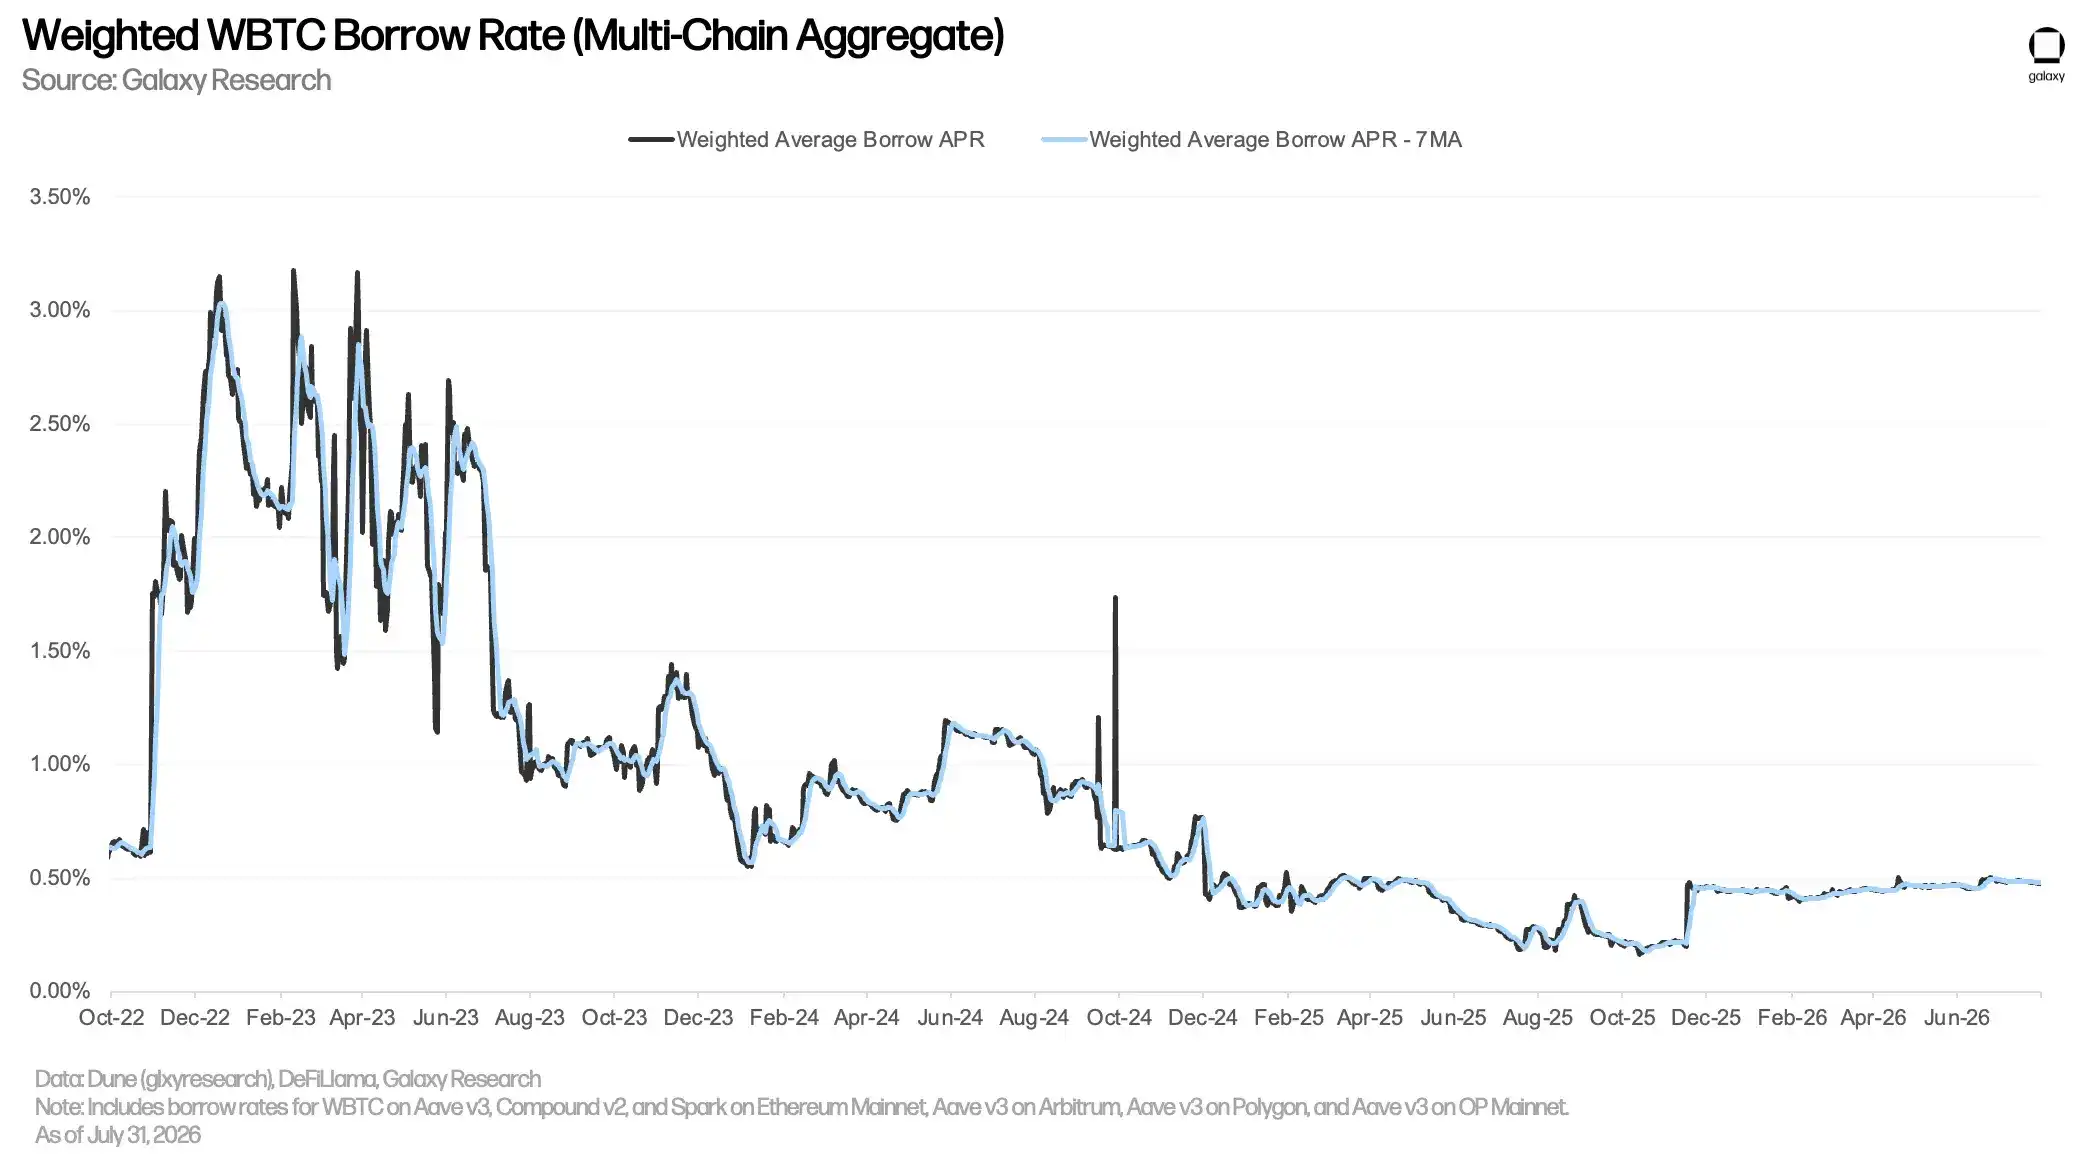
Chart: On-chain weighted BTC borrowing rate trend.
The longstanding gap between on-chain and off-chain OTC market BTC borrowing rates persisted throughout Q2. In OTC markets, BTC borrowing demand stems primarily from two sources: 1) demand to short BTC; 2) using BTC as collateral to borrow stablecoins or cash. The former demand is less common in on-chain lending markets, creating the spread between on-chain and OTC BTC borrowing costs.
Throughout Q2, BTC's OTC lending rate remained unchanged at 1%.
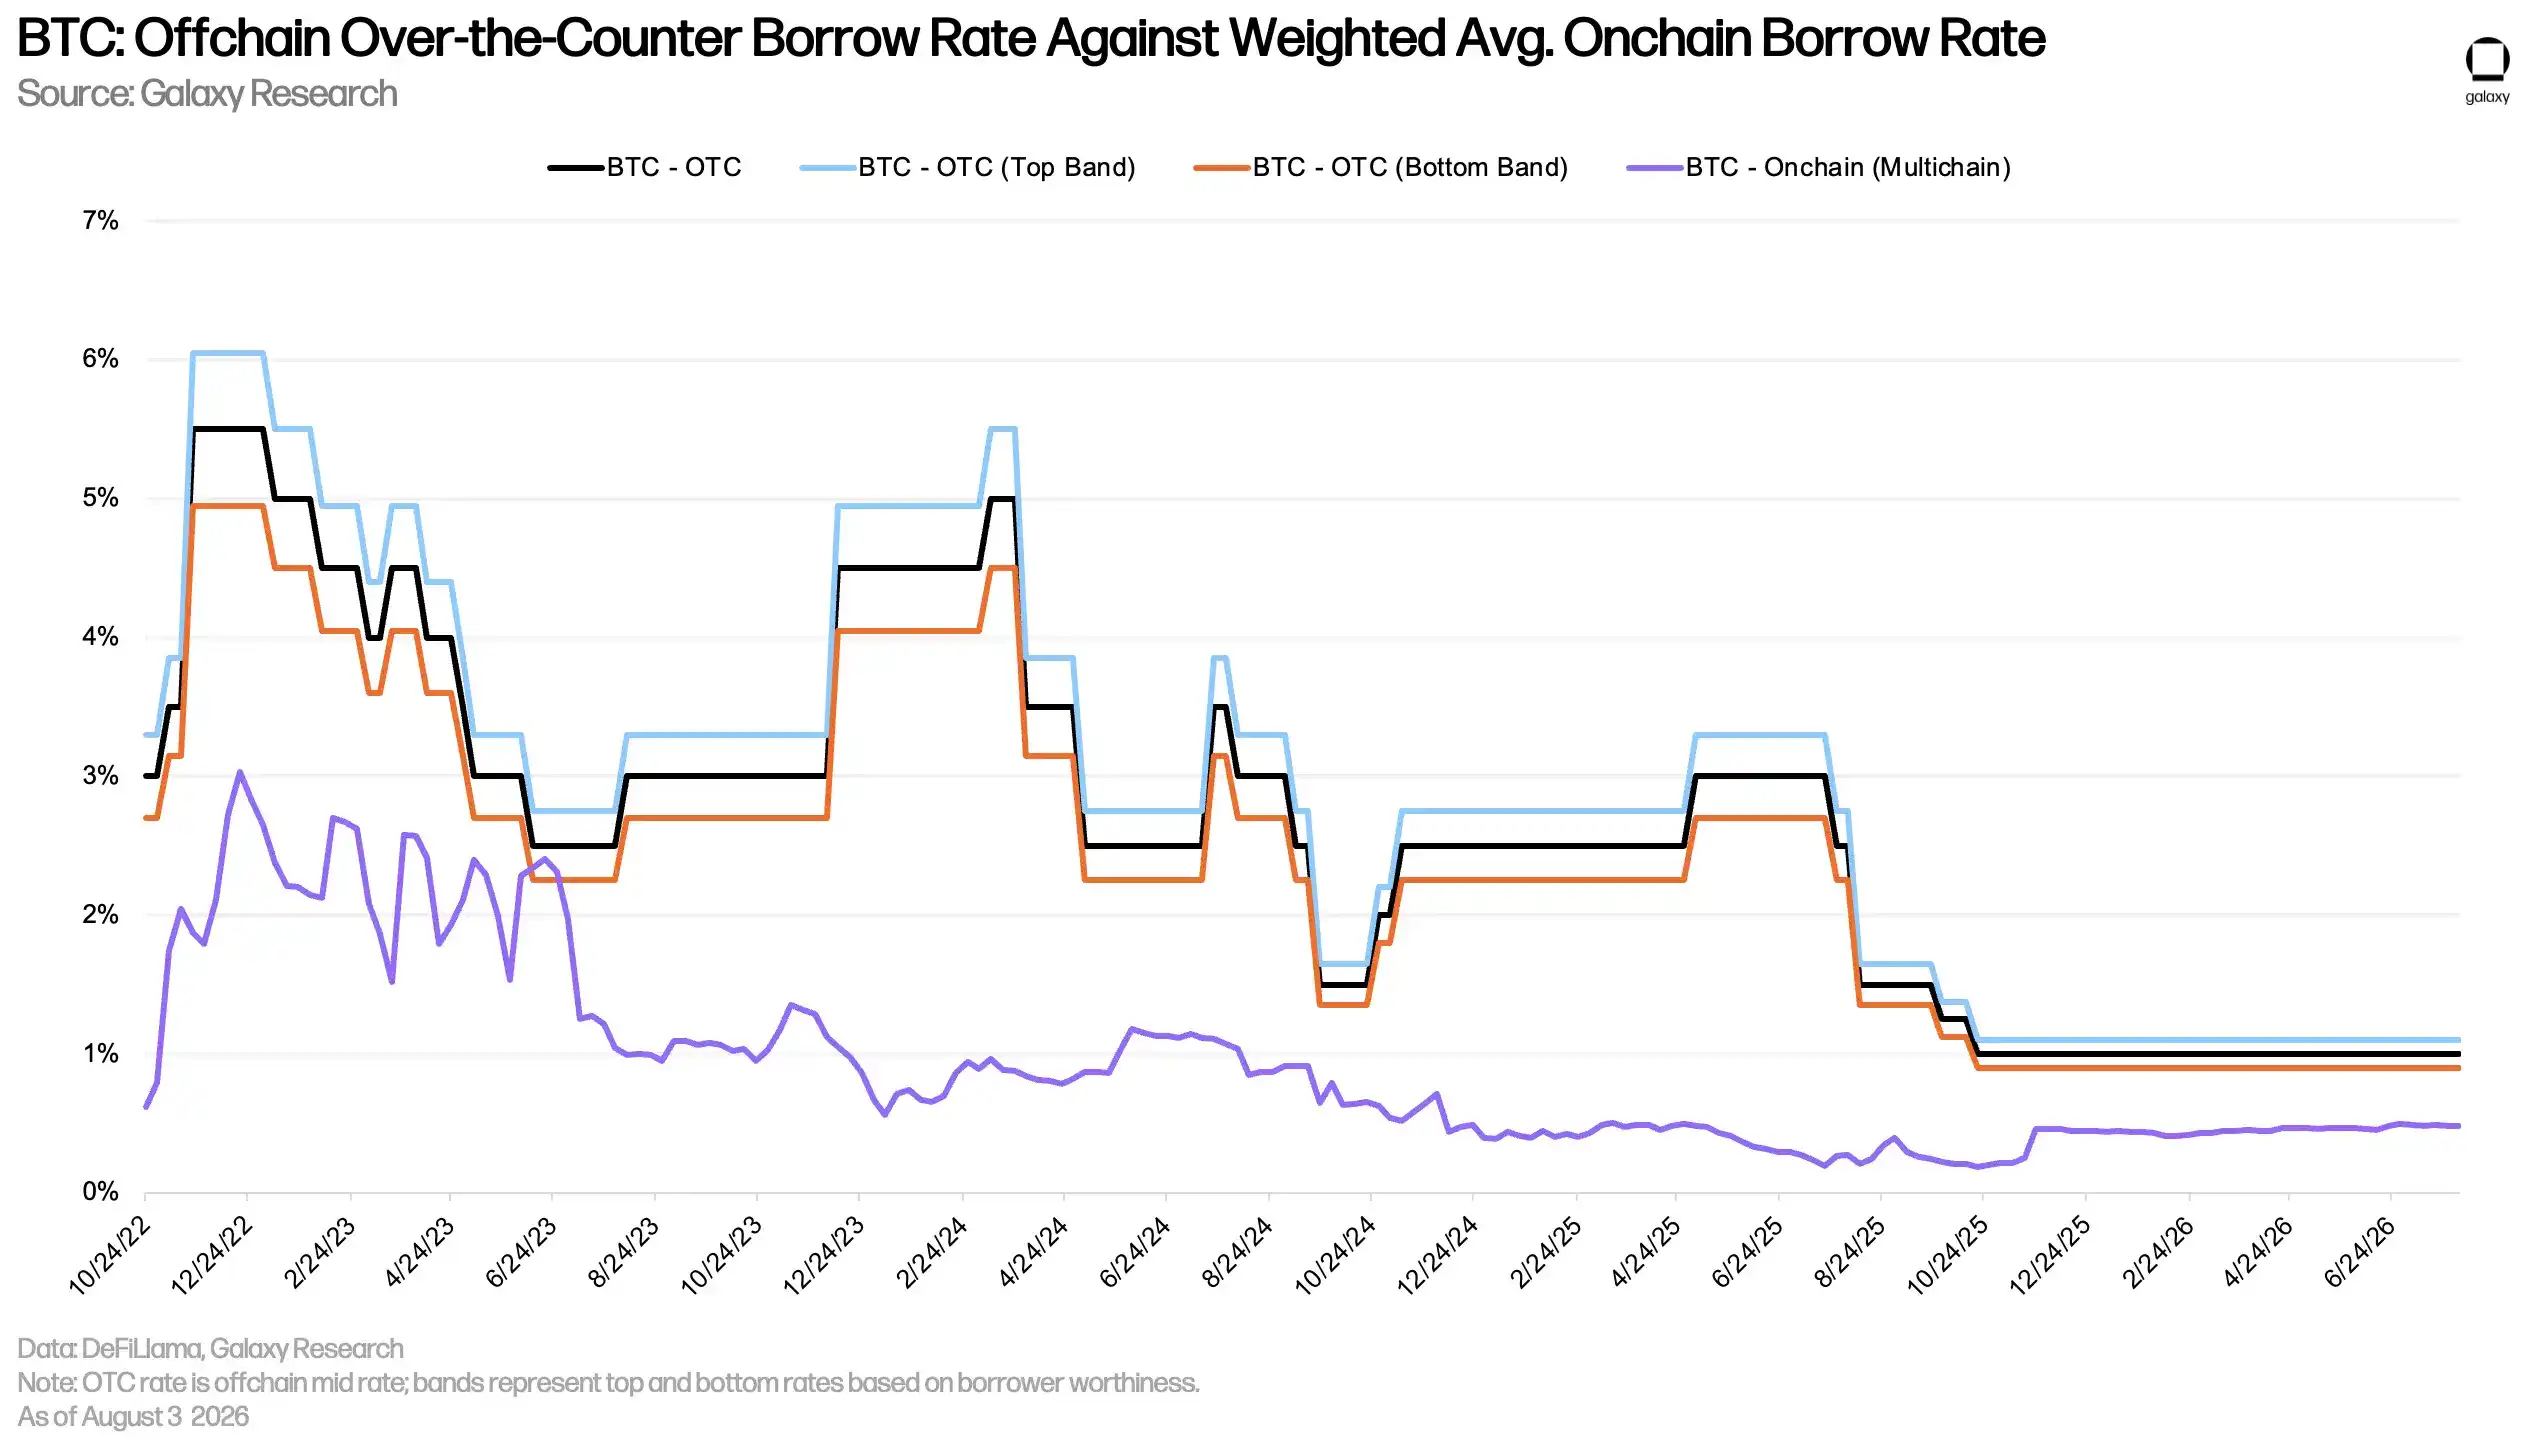
Chart: BTC on-chain vs. OTC borrowing rate comparison.
ETH and stETH
The chart below shows the weighted borrowing rates for ETH and stETH (the token obtained by staking ETH via the Lido protocol) across multiple lending applications and blockchain networks. Historically, ETH borrowing costs are typically higher than stETH because demand for borrowing ETH itself is higher. Users frequently borrow ETH to create recursive leverage loops to amplify exposure to Ethereum network staking APY, using stETH obtained via Lido as collateral.
Therefore, under normal market conditions, ETH borrowing costs average around the Ethereum network staking APY, plus or minus about 50 bps. Once borrowing costs exceed staking yields, this strategy becomes uneconomical, so ETH borrowing APR rarely stays above staking APY for long.
Similar to WBTC, stETH borrowing costs are typically low as this asset is primarily used as collateral.
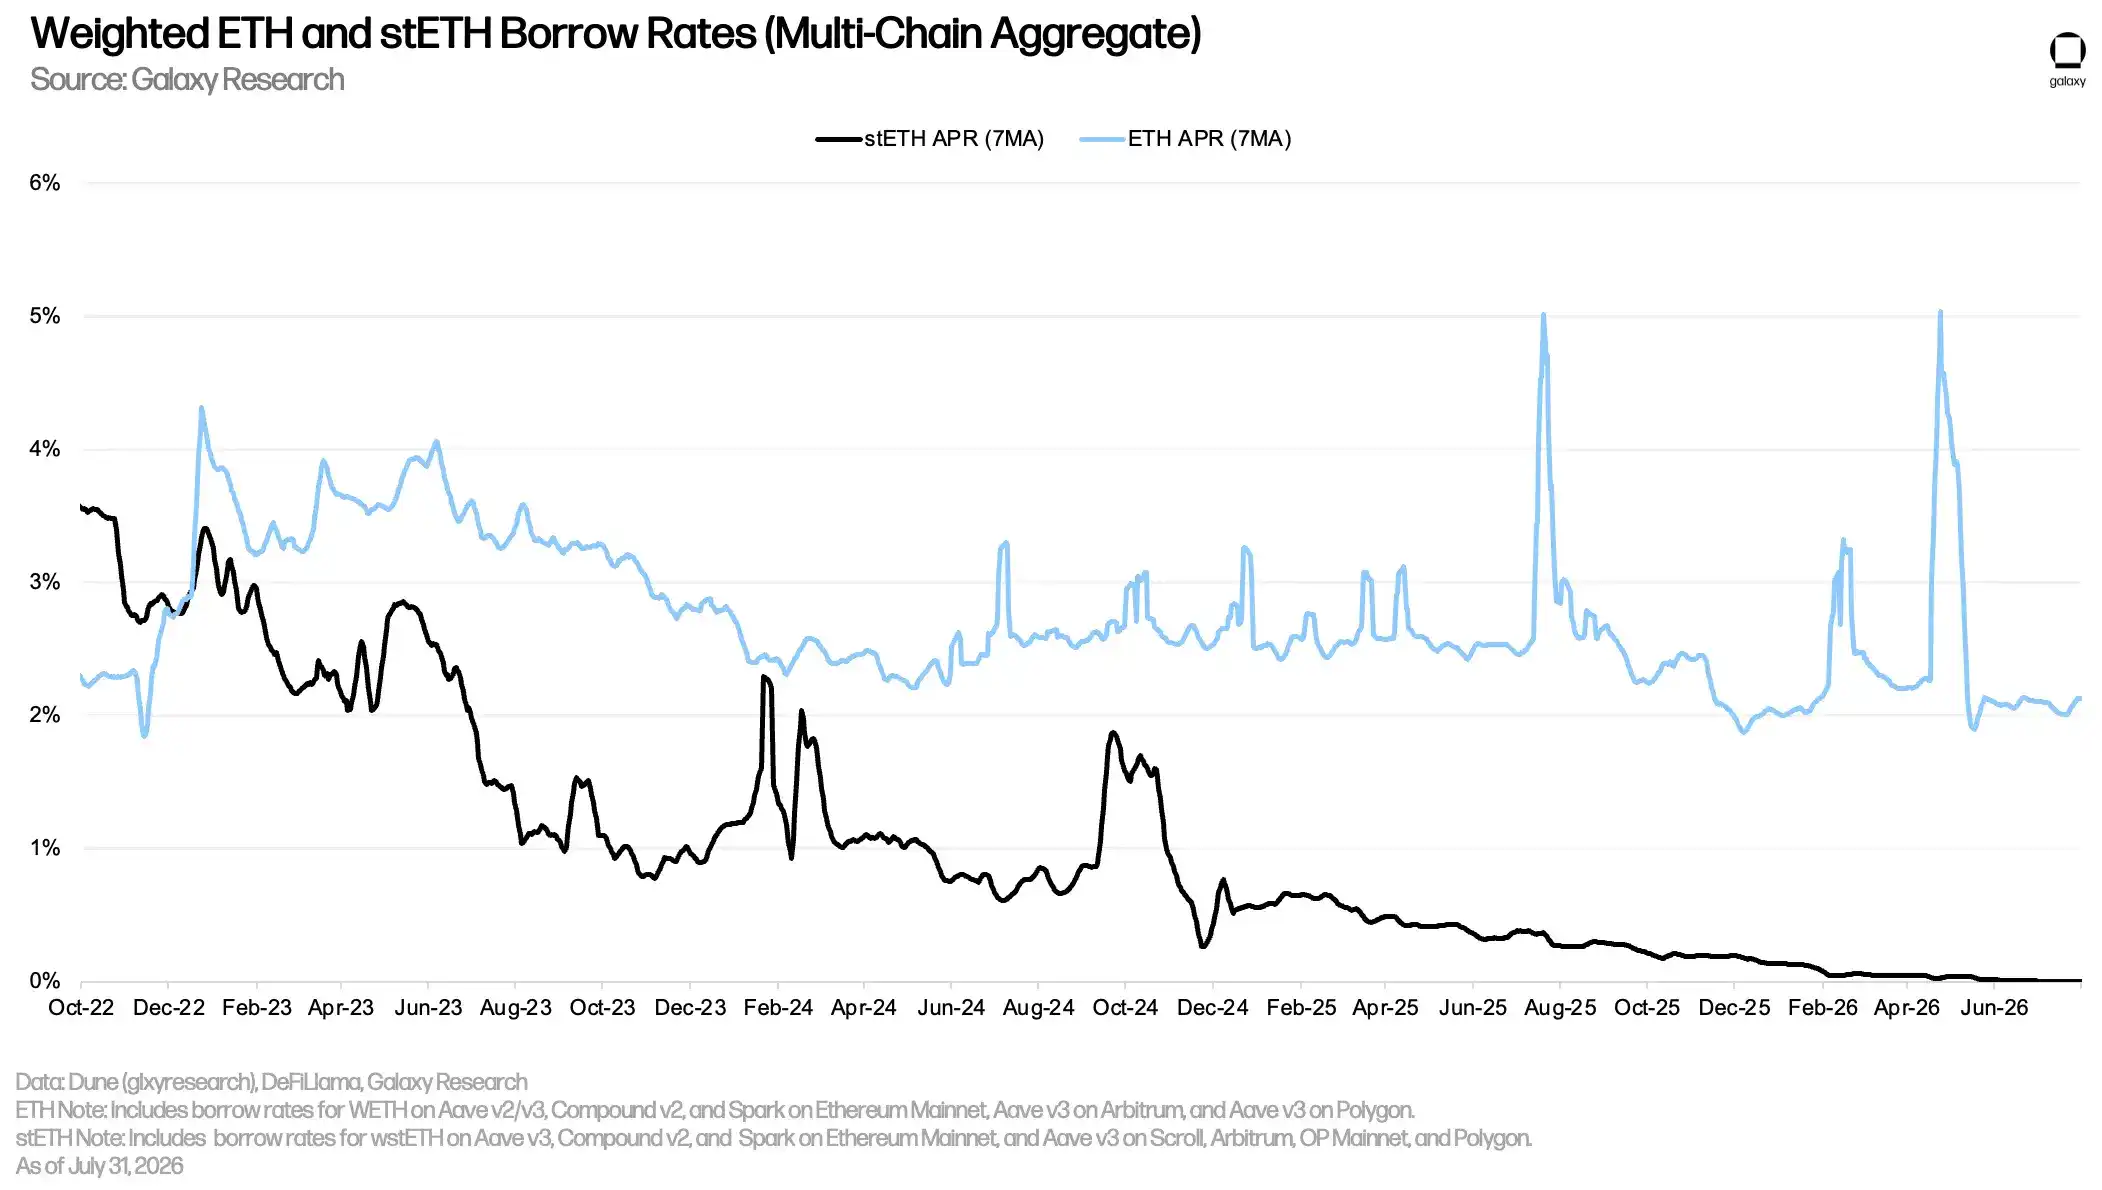
Chart: ETH and stETH on-chain weighted borrowing rate trends.
Users can post yield-bearing Liquid Staking Tokens (LSTs) or Liquid Restaking Tokens (LRTs) as collateral to borrow ETH at low, sometimes even negative net, cost. This funding cost advantage drives a recursive leverage strategy: repeatedly depositing LSTs and LRTs as collateral, borrowing unstaked ETH, staking it, and using the newly acquired LSTs/LRTs to borrow more ETH, thereby amplifying exposure to ETH staking APY.
This strategy only works as long as ETH borrowing costs are lower than the staking APY earned by LSTs and LRTs. Except for a few special periods, users have generally been able to execute this strategy successfully.
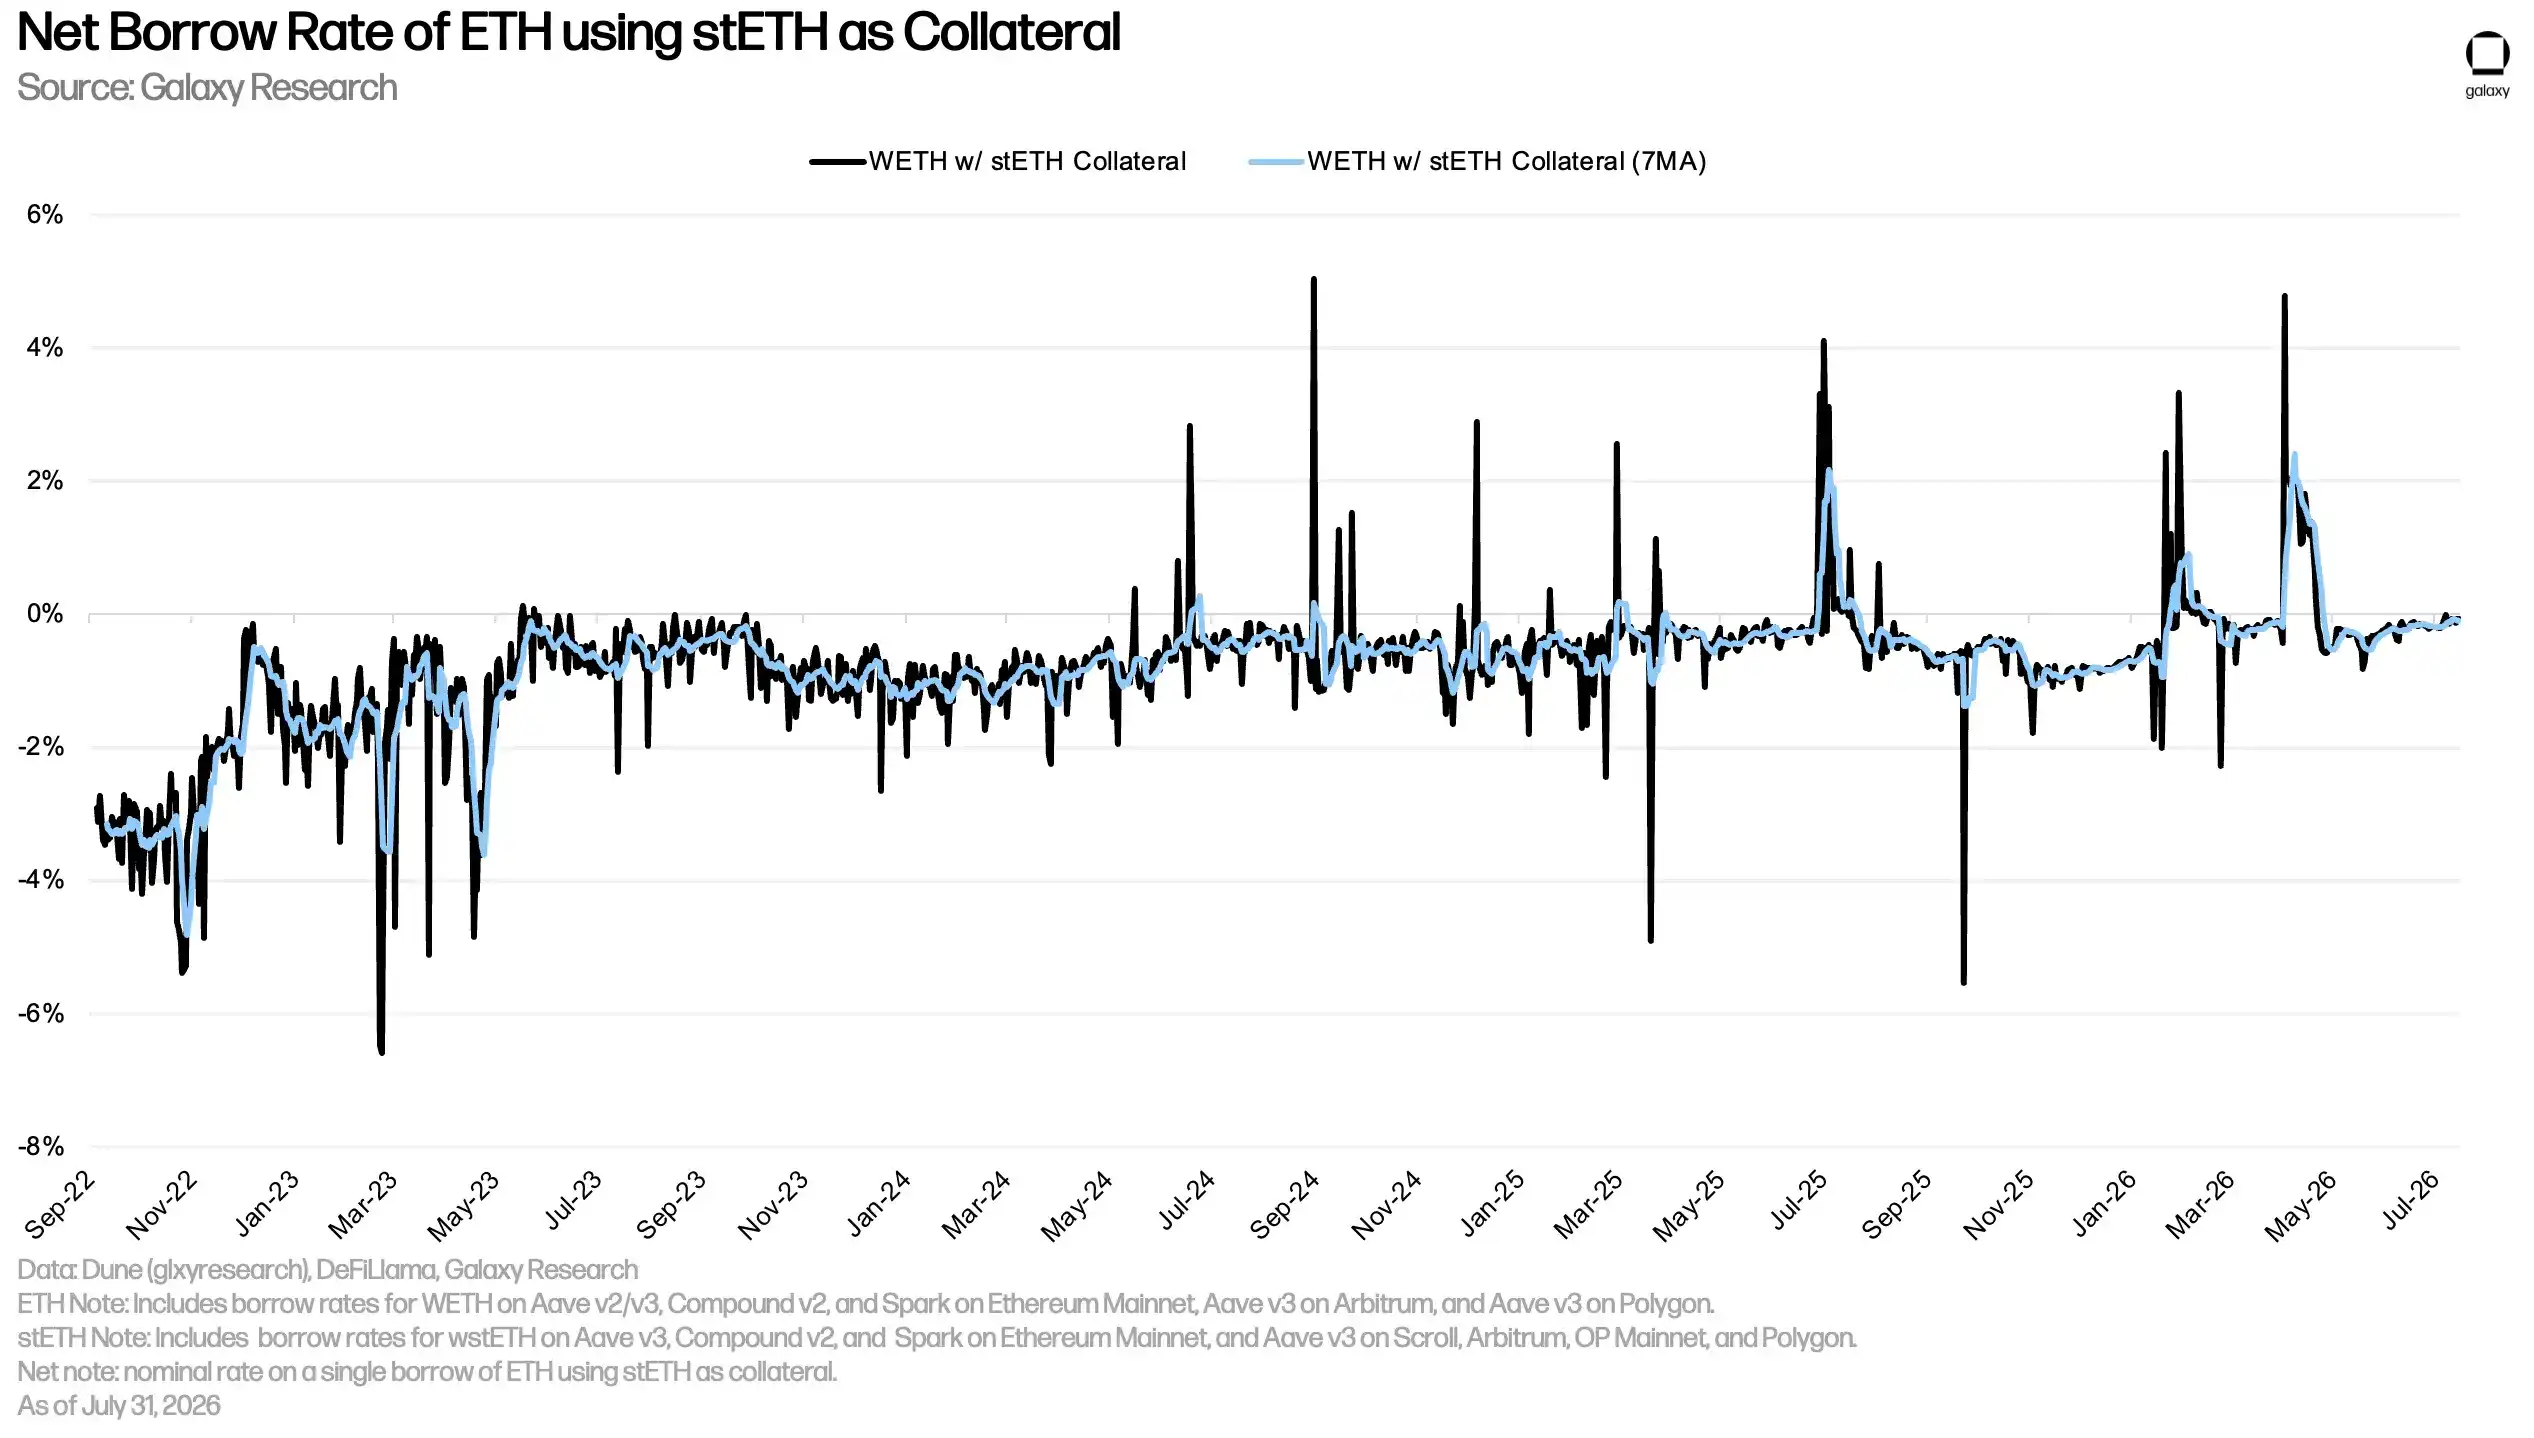
Chart: Borrowing cost vs. staking yield for ETH recursive staking strategies.
ETH OTC Borrowing Rate
Similar to Bitcoin, borrowing ETH via on-chain lending applications has historically been cheaper than borrowing via OTC markets. This is due to two main factors. First, like BTC, off-chain markets have ETH borrowing demand from short sellers, which is less common on-chain.
Second, the Ethereum staking APY forms a lower bound for off-chain ETH lending rates. If yields fall below what could be earned by directly staking ETH, asset providers have little incentive to deposit ETH off-chain, and off-chain platforms lack the incentive to lend at rates below staking yields. In contrast, in on-chain markets, the Ethereum staking APY tends to form an upper bound for ETH lending rates.
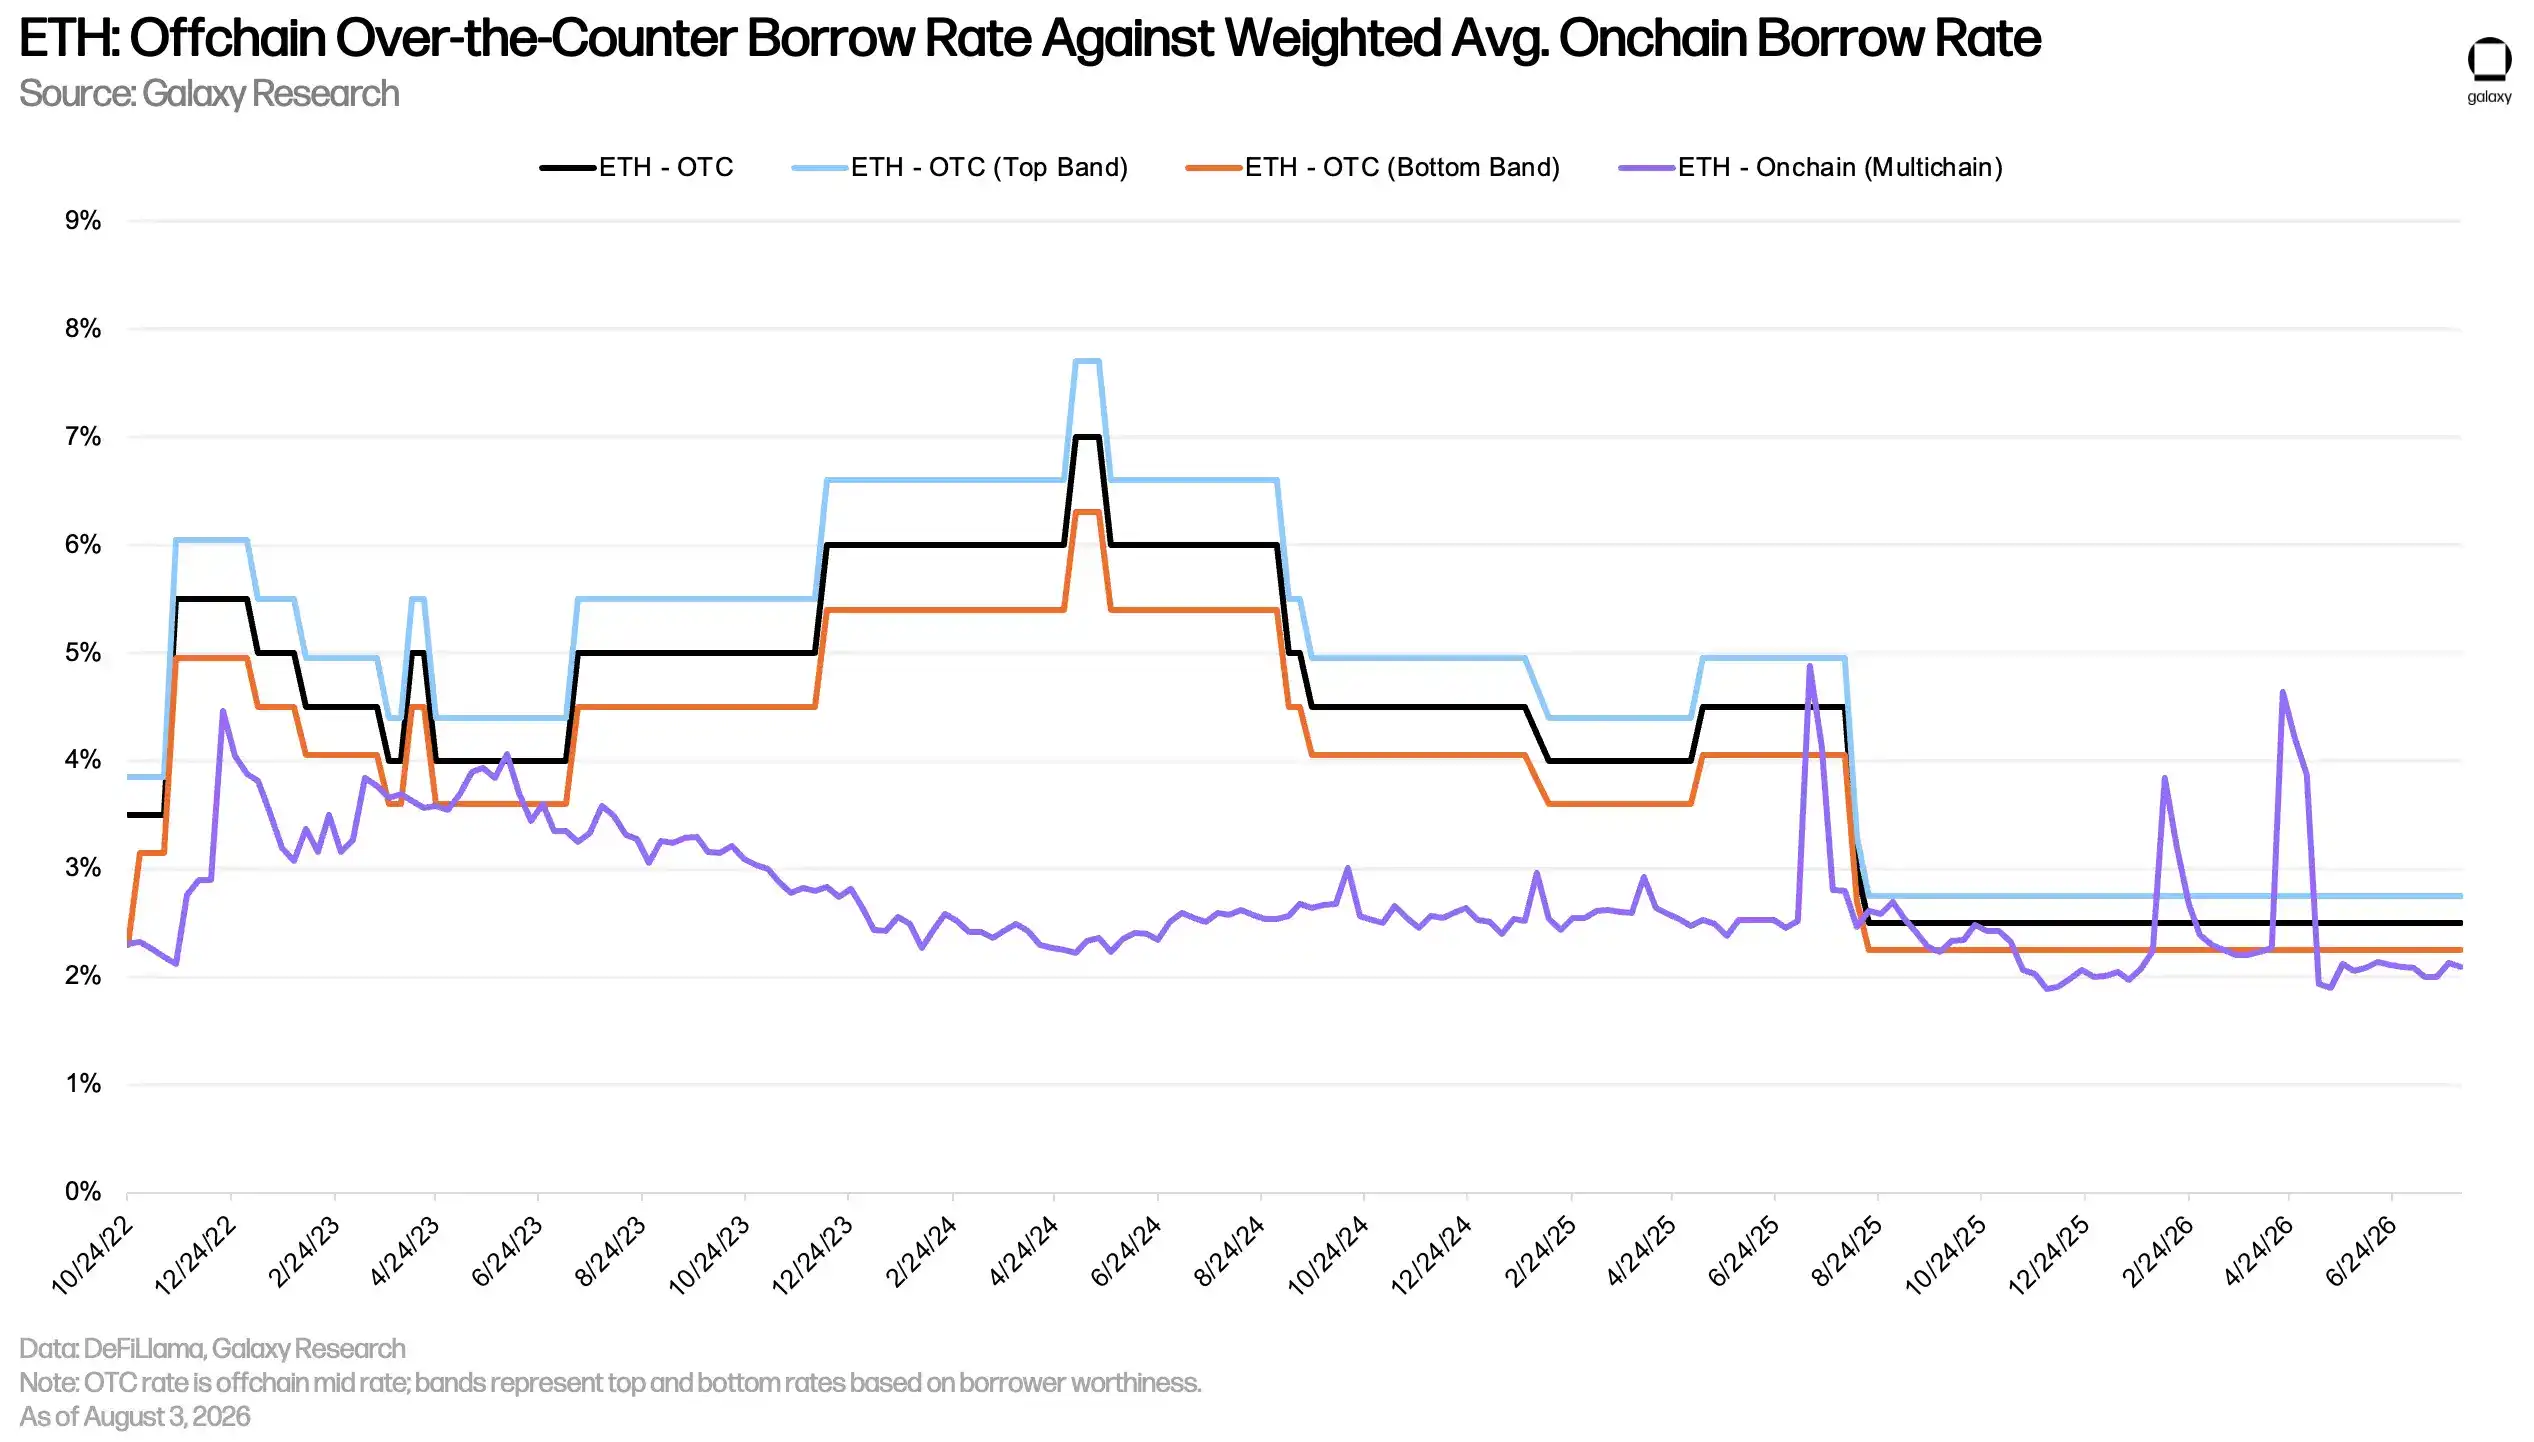
Chart: ETH on-chain vs. OTC lending rates and Ethereum staking APY comparison.
Aave Ledger Perspective
The following is a detailed analysis of the filtered lending ledger for the Aave V3 Core instance, currently the largest on-chain lending market. We applied the following filters:
-
Minimum Debt Size ($100): We excluded positions with debt below this threshold from the main aggregates. This removes dust positions but skews results toward larger loans.
-
Health Factor (HF) Statistical Upper Bound (HF ≤ 50): We also excluded positions with snapshot Health Factors above 50 from the main sample. Such highly overcollateralized loans are often small and less relevant for risk analysis. Within loans below this bound, the debt-weighted HF average and HF percentile statistics only include loans with snapshot HF ≥ 1 and ≤ 50.
Loans with HF < 1 are not included in these HF statistics; loans with HF = 1 are included. A higher HF indicates a safer loan; HF < 1 means the position is eligible for liquidation. Health Factor is calculated as: (Total Collateral Value × Weighted Average Liquidation Threshold) ÷ Total Borrowed Value.
-
Debt-to-Equity (D/E): We calculate this metric only for loans where collateral value exceeds debt, i.e., equity is positive. Positions with non-positive equity are excluded from D/E distribution and debt-weighted average D/E. This rule is independent of the minimum debt filter—a loan with debt > $100 but non-positive equity is still excluded from D/E-related stats.
According to the snapshot on August 7, 2026, after applying these filters, there were 19,073 outstanding loans. Although "Efficiency Mode" (e-mode) loans on Aave constitute only 8.91% of total outstanding positions, e-mode and regular loans account for roughly half of the outstanding debt each. In e-mode loans, borrowed and collateral assets have high price correlation, e.g., ETH and WETH.
This ratio has declined since Galaxy Research's previous Aave ledger analysis on April 22, 2026, when e-mode vs. regular debt was approximately 60/40. The change is primarily due to a decrease in e-mode outstanding debt.

Chart: Distribution of position counts and debt amounts for e-mode vs. regular loans in Aave V3 Core.
The table below summarizes debt-weighted risk metrics for the filtered ledger, showing figures for all positions, e-mode positions, and regular positions separately.
On average, e-mode borrowers are significantly more leveraged. Their debt-weighted LTV is ~90%, debt-weighted HF is ~1.06, and D/E is ~10.7. This means a relatively small shock to collateral prices could quickly push many of these loans into stressed territory.
In contrast, non-e-mode loans have a significantly larger safety cushion, with debt-weighted LTV ~49%, HF ~1.79, and D/E ~1.07. This partially compensates for the risk from a lack of price correlation between borrowed and collateral assets, e.g., using cbBTC as collateral to borrow USDC.
Debt-weighted average is calculated as:
D/E = Σ_i (D_i × (D_i ÷ (C_i − D_i))) ÷ Σ_i D_i
Only loans where C_i > D_i are included, where D_i is the debt of a single position and C_i is its collateral value.
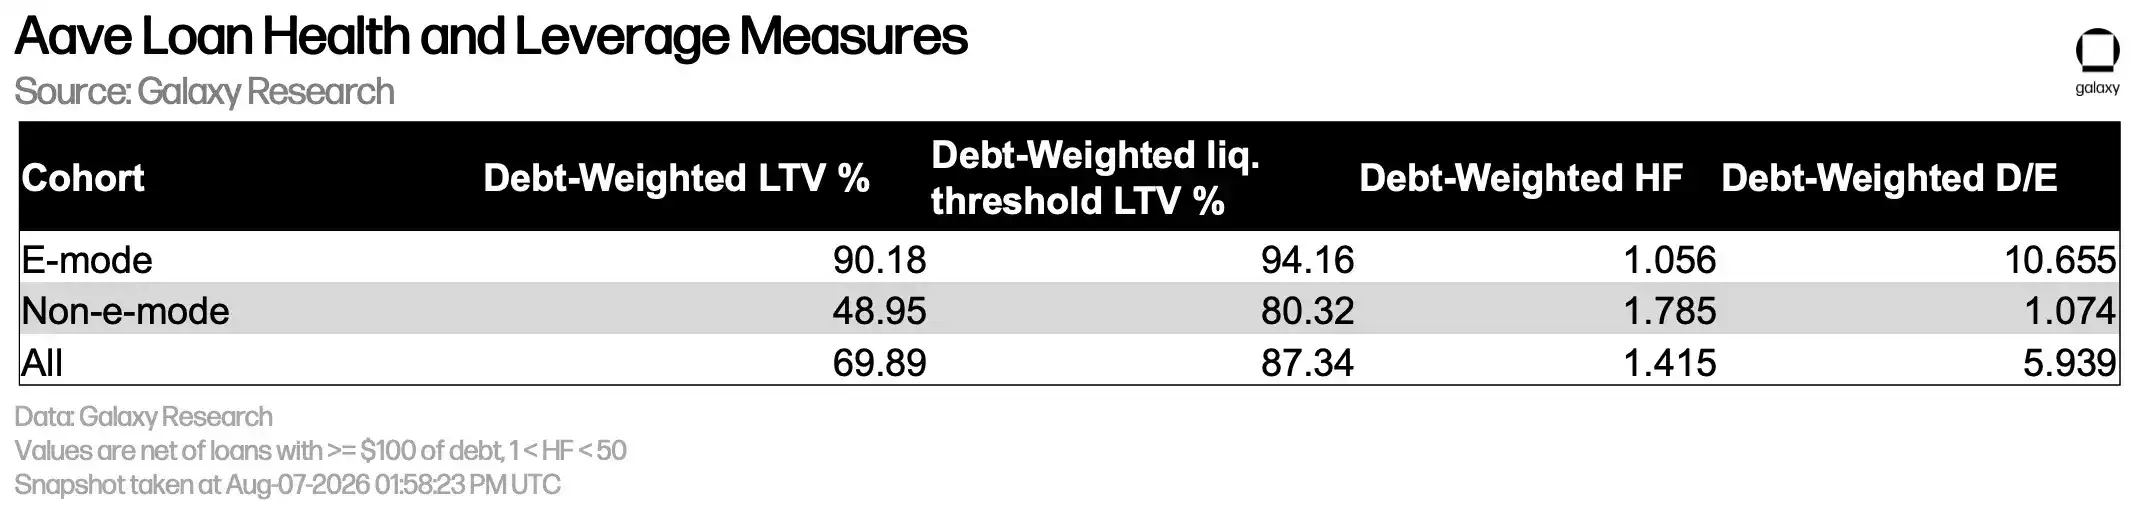
Chart: Debt-weighted risk metrics for all positions, e-mode, and regular loans in Aave V3 Core.
The next table ranks all enabled collateral assets in Aave V3 Core by their USD value in the statistical sample. ETH-related collateral dominates: WETH, Etherfi's wrapped restaked ETH (weETH), and Lido's wrapped stETH (wstETH) account for approximately 24%, 16%, and 14% respectively, together comprising 54.6% of total usable collateral. WBTC also holds a significant share at ~14%.
Thus, a handful of assets effectively back the majority of collateral in the entire ledger. Beyond these, stablecoins and other yield-bearing tokens hold smaller but still meaningful shares.
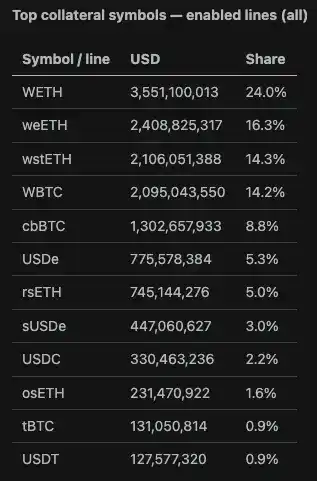
Chart: USD value and market share of various collateral assets in Aave V3 Core.
The table below ranks borrowed assets by USD size and share of total borrowings in the sample. WETH dominates on the liability side, accounting for slightly over 37%. This aligns with expectations given the prevalence of recursive leverage strategies using ETH-related assets as collateral.
Stablecoin borrowings are also substantial, with USDT and USDC together accounting for about half of total borrowings—USDT ~28%, USDC ~22%—while other assets have noticeably smaller shares.
Compared to our previous analysis of the Aave V3 Core ledger, WETH's share of outstanding liabilities has declined noticeably from 51.1%, consistent with the earlier-mentioned decrease in e-mode loan size.
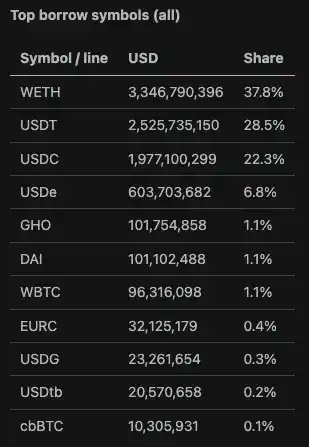
Chart: USD size and share of various borrowed assets in Aave V3 Core.
E-mode Perspective
Within e-mode loans, collateral is highly concentrated in ETH liquid staking and restaking wrapped assets. weETH alone accounts for ~42% of collateral in this category. Adding rsETH and wstETH, such assets collectively comprise ~66.2% of e-mode collateral.
Therefore, from a risk perspective, e-mode is less a "diversified collateral basket" and more a highly concentrated Ethereum staking basis bet at its core.
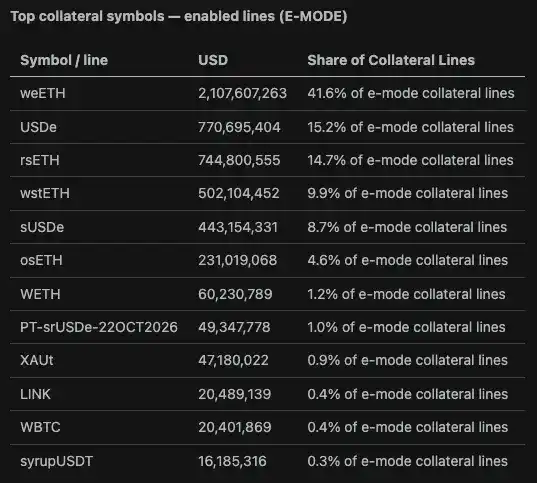
Chart: Composition of e-mode collateral assets in Aave, dominated by ETH staking and restaking assets.
Within e-mode borrowings, liabilities are almost entirely dominated by WETH. WETH alone constitutes ~73% of total e-mode debt. This is exactly as expected when users post assets highly correlated with ETH as collateral to recursively borrow ETH for leverage loops.
Stablecoin borrowings still hold a meaningful size, with USDT, USDe, and USDC together accounting for roughly the low teens percentage of e-mode borrowings.
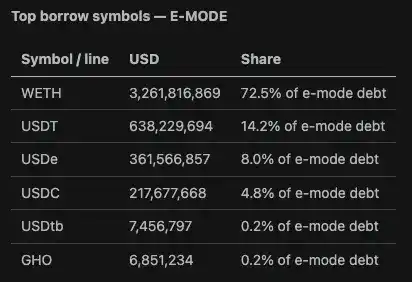
Chart: Composition of e-mode borrowed assets, overwhelmingly dominated by WETH.
The table below ranks e-mode positions involving different collateral assets, showing debt-weighted risk metrics and, where applicable, the implied number of loops calculated for the subsample where a single asset constitutes at least 99% of the collateral. Thus, unlike the earlier, more neutral market cap ranking, this table resembles a leaderboard of "which assets are being leveraged most recursively."
Liquid restaking and liquid staking ETH wrapped assets cluster at the top. These assets exhibit high debt-weighted LTV, D/E typically in the high single to low double digits, and Health Factors not far from 1. This aligns with high-leverage, repeatedly executed ETH beta loop strategies.
Implied number of loops is calculated per loan using the formula:
Per-loan N_i = ln((1 − (D/E)_i(1 − L_i)) / L_i) / ln(L_i)
using each loan's own current LTV, L_i, and D/E, and only for the subsample where a single asset constitutes ≥ 99% of the collateral. The reported value is the debt-weighted average of individual N_i.
Loans are excluded if L_i is not in (0,1), if the logarithm argument is non-positive (i.e., leverage exceeds the loop limit corresponding to L_i/(1−L_i)), or if the result is not a finite value.
Values are displayed only if at least one qualifying loan exists for Liquid Staking ETH, Liquid Restaking ETH, Yield-bearing Stablecoins, or Pendle PT assets.

Chart: Leverage levels, Health Factors, and implied loop counts for different e-mode collateral assets.
Corporate Debt Strategies
We currently track $16.1 billion in outstanding debt used by companies to directly purchase digital assets or to fund their digital asset treasury strategies.
Due to limitations in Bloomberg's tracking of MicroStrategy's preferred shares, the timing of increases in the company's issued STRC share count may be offset in the time series. However, total debt issuance still serves as a good proxy for the company's outstanding liabilities.
In Q2, outstanding debt issued by Digital Asset Treasury (DAT) companies decreased by $1.5 billion, primarily due to MicroStrategy's completion of a $1.5 billion debt buyback in May.
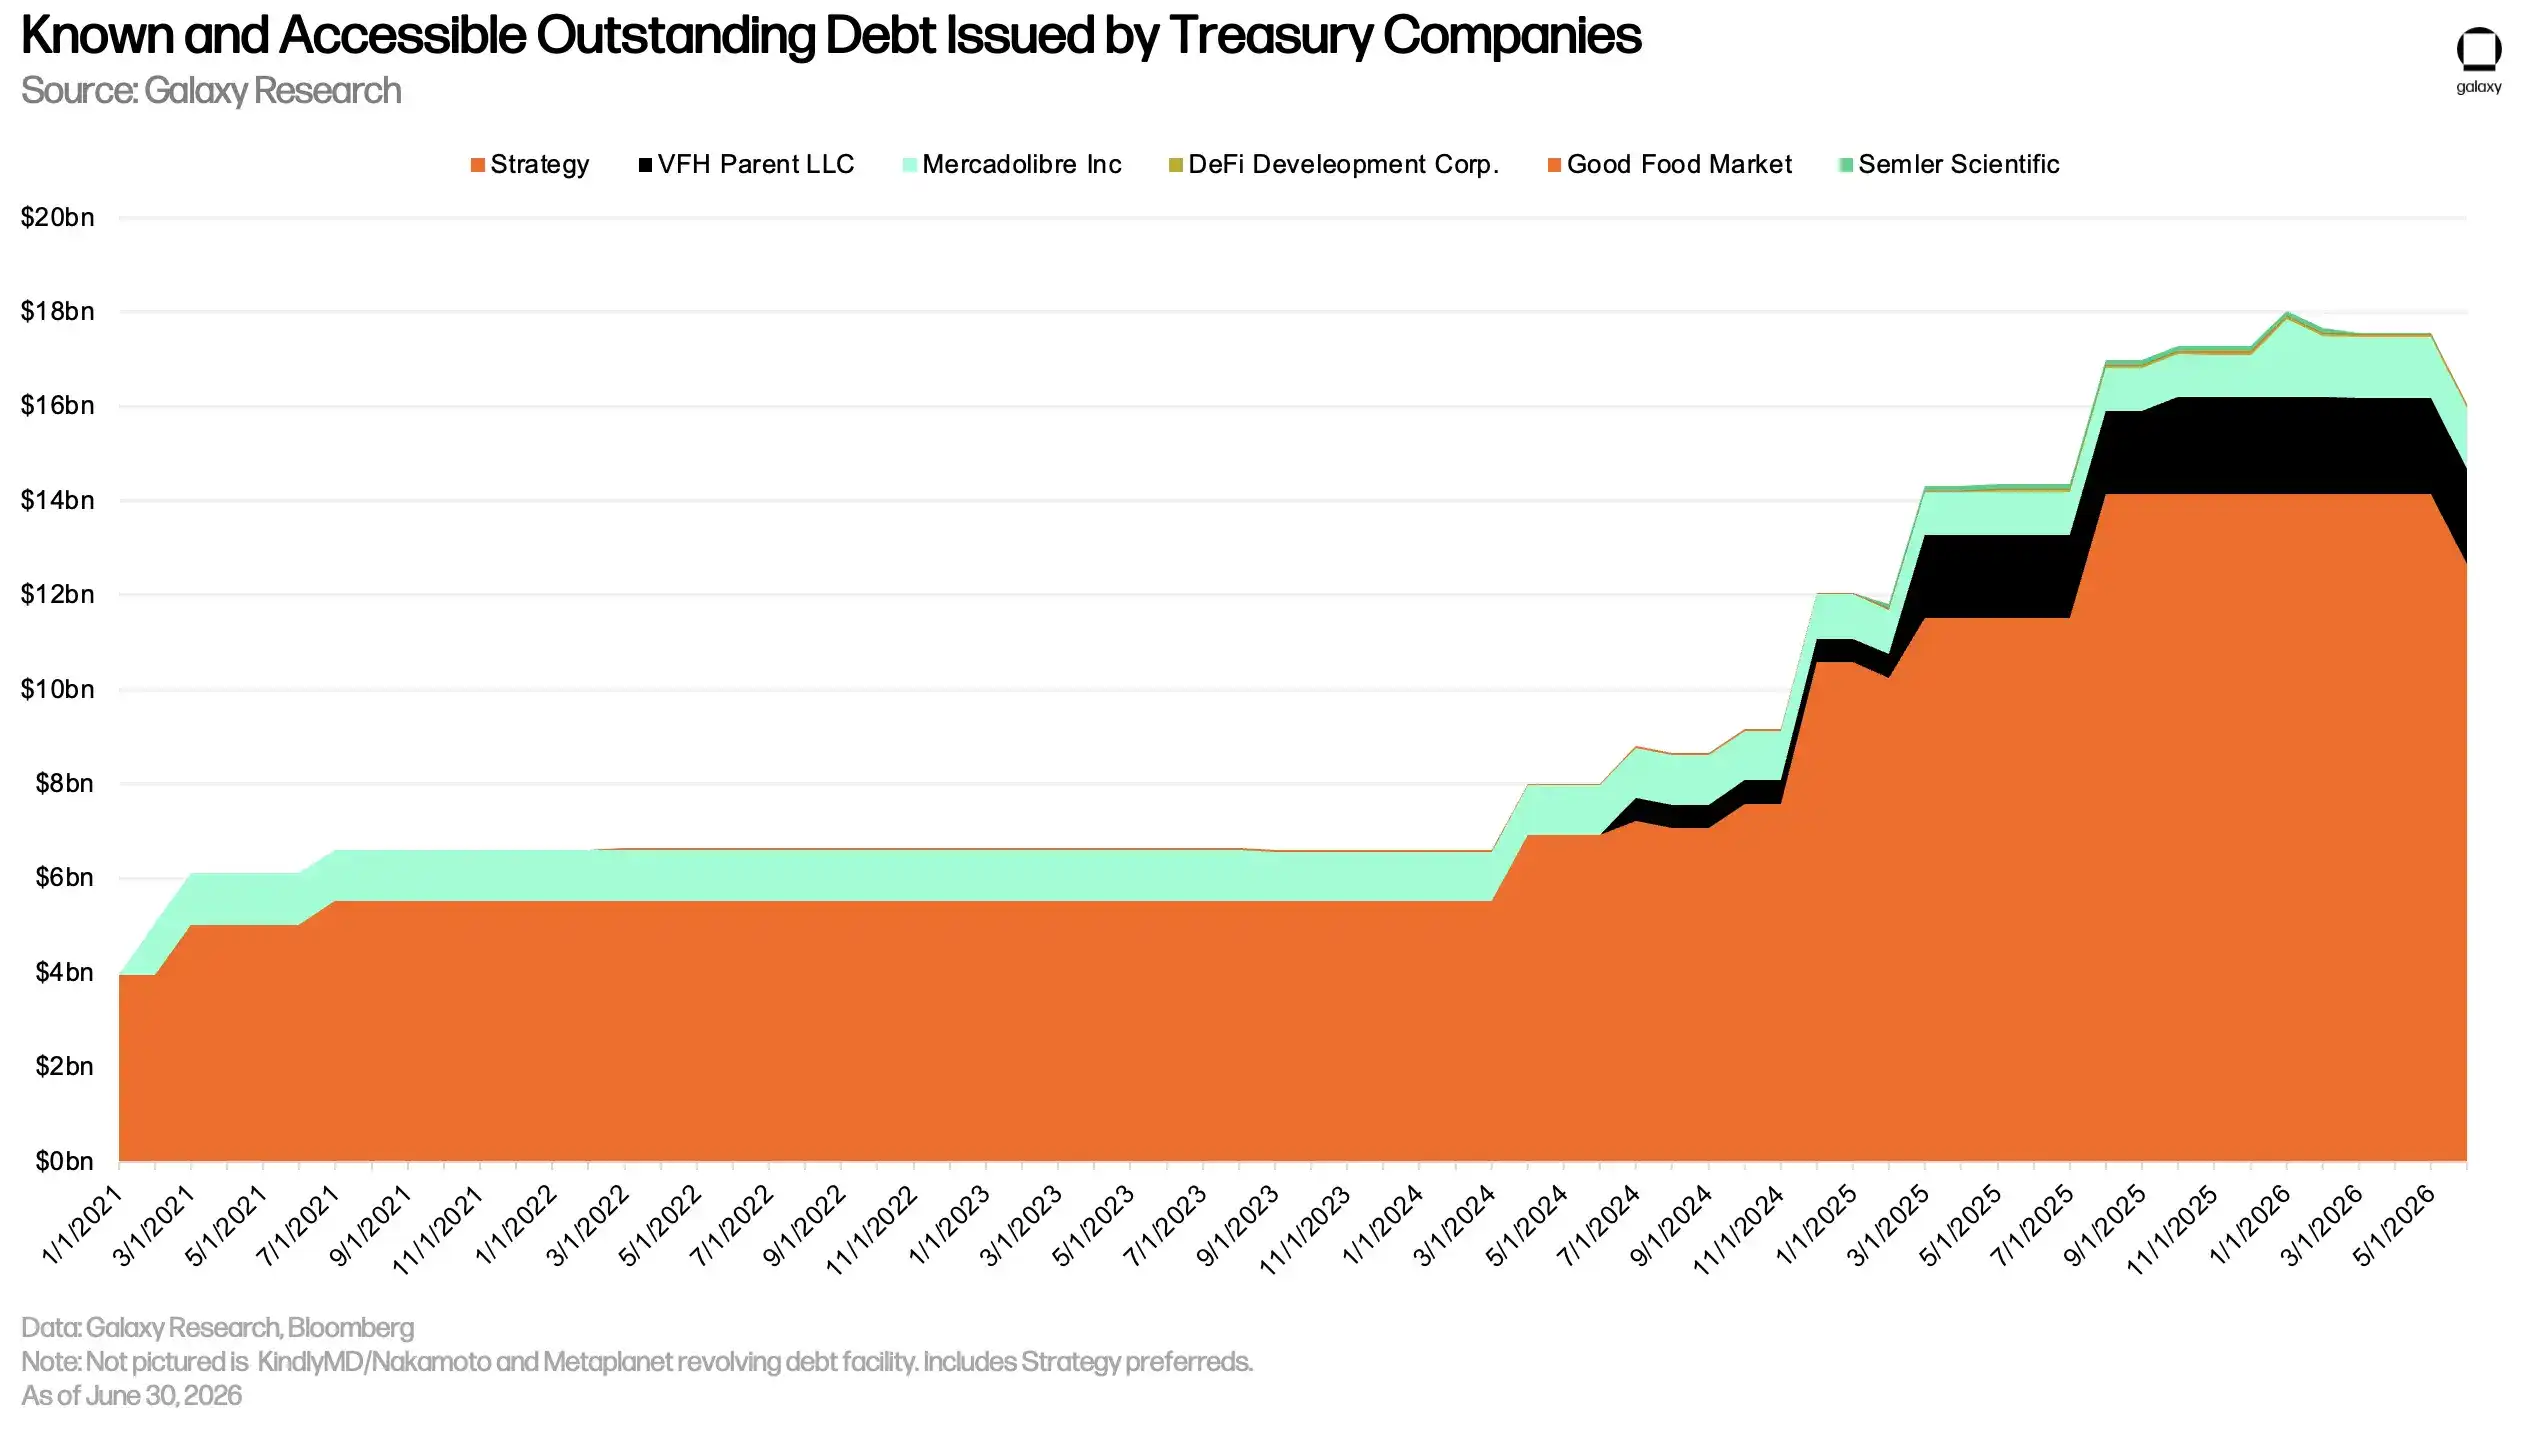
Chart: Outstanding debt used by Digital Asset Treasury companies to purchase or support digital asset treasury strategies.
The chart below details the actual quarterly interest payable on debt issued by DATs.
Note that MicroStrategy's STRC dividends are payable only when formally declared by the board and the company has legally available funds. However, any unpaid dividends continue to accumulate and must be paid before distributions to lower-tier securities.
Therefore, STRC dividend payments may be uneven and not made at fixed intervals.
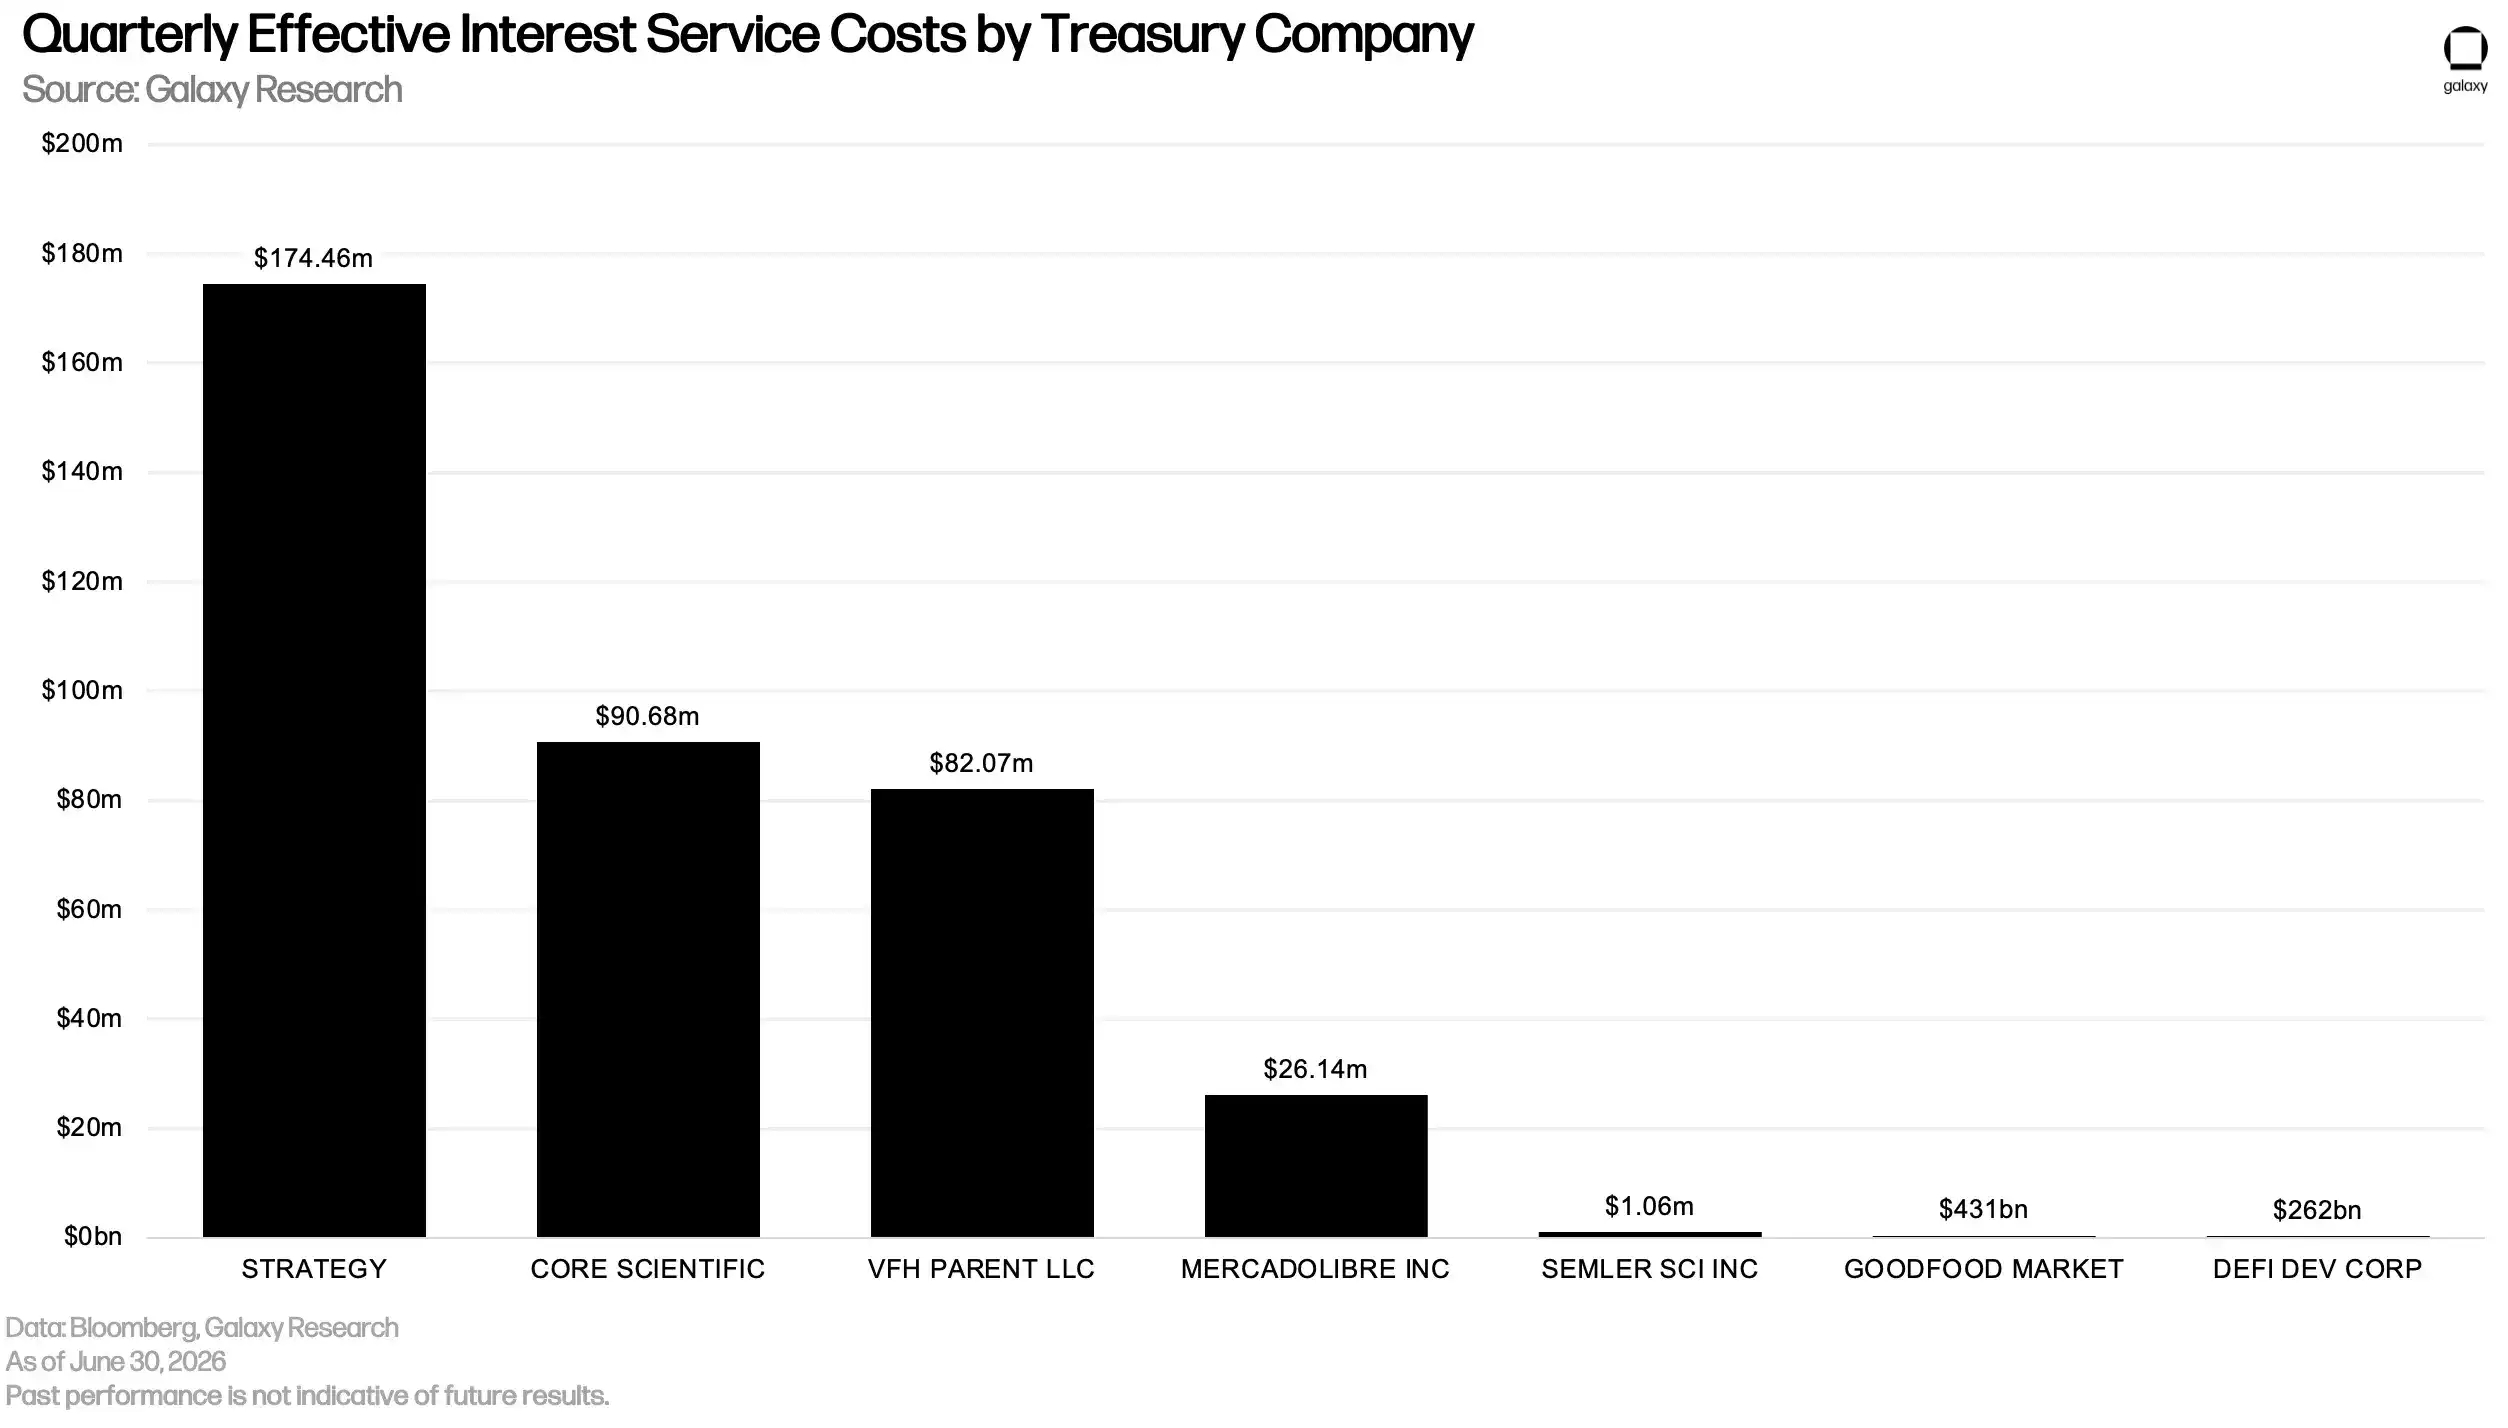
Chart: Effective quarterly interest expense corresponding to debt issued by Digital Asset Treasury companies.
Total outstanding crypto-related debt, including that borne by DATs, declined 15.08% QoQ in Q2. After reaching its all-time high in Q3 2025, total outstanding debt formed through on-chain and off-chain channels fell to $73.2 billion by the end of Q2 2026, marking the third consecutive quarterly decline.
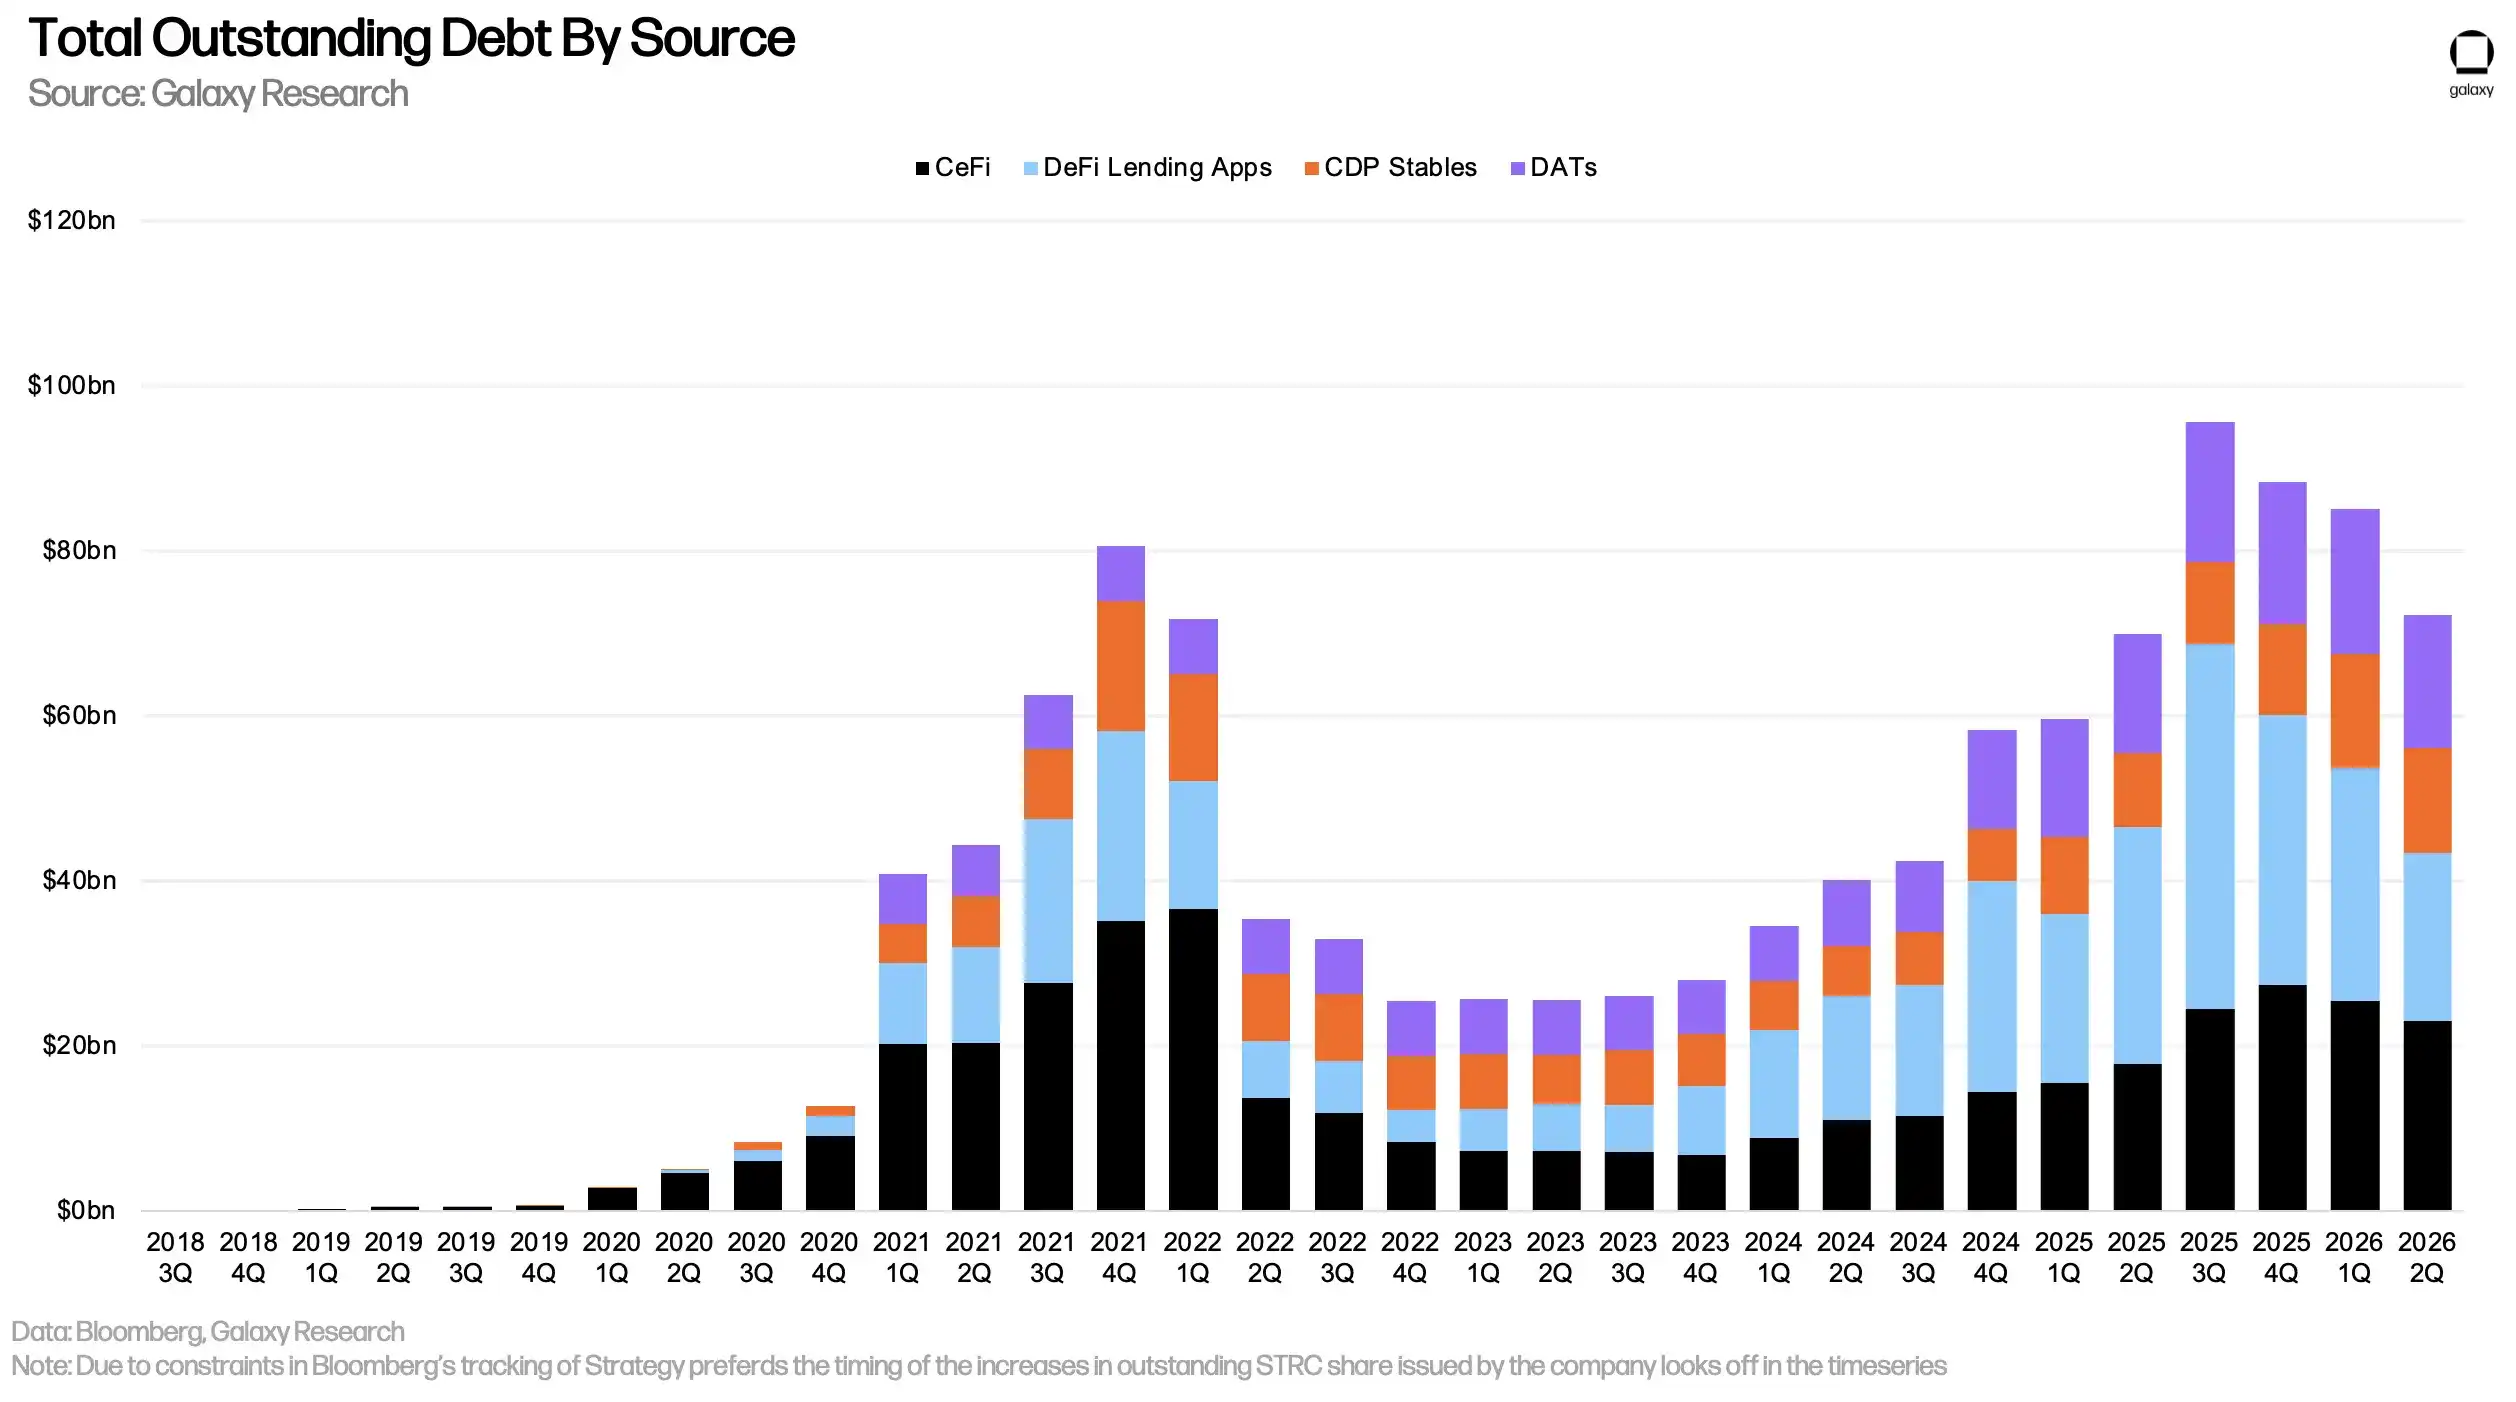
Chart: Total crypto debt across on-chain, off-chain, and digital asset treasury-related sources.
Futures Markets
Futures open interest, including perpetuals, declined 3.08% QoQ to $103.2 billion. During July, open interest began rising again, reaching approximately $114 billion by month-end.
Note that the full size of futures open interest cannot be directly interpreted as the absolute amount of actual market leverage. This is because a portion of futures positions may be hedged with spot longs, giving traders delta-neutral exposure to the underlying asset. Therefore, open interest alone cannot directly observe the true aggregate leverage ratio across the entire market.
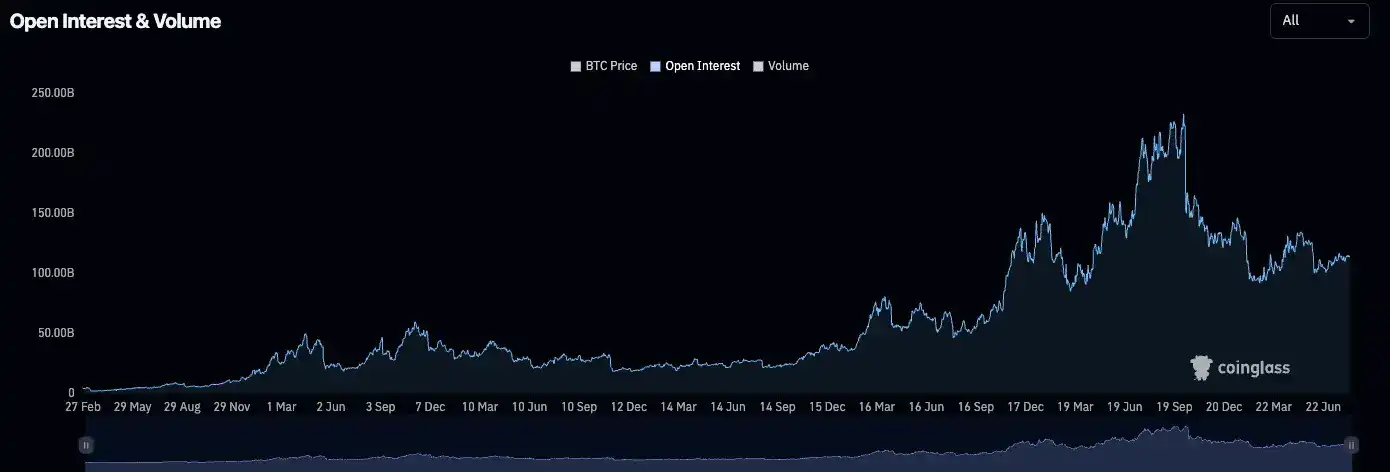
Chart: Total crypto futures open interest, including perpetuals.
Throughout Q2, BTC futures open interest largely oscillated between $44 billion and $62 billion. BTC OI started the quarter at $48.04 billion and ended June 30 down 6.24% at $45.04 billion. Since then, BTC OI has recovered slightly, reaching approximately $48 billion again by early August.
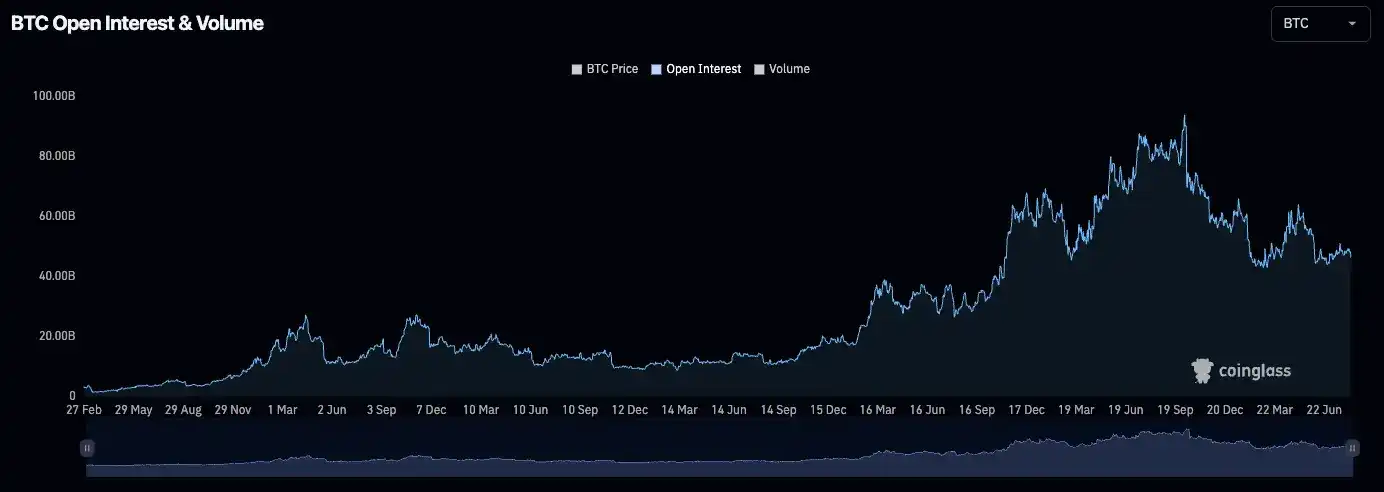
Chart: BTC futures open interest during Q2 and into July.
ETH open interest declined more sharply than BTC's in Q2. Starting the quarter at $29.84 billion, ETH OI fell to $21.99 billion by June 30, a drop of 26.31%.
However, since the quarter ended, ETH OI has rebounded to $25.74 billion.
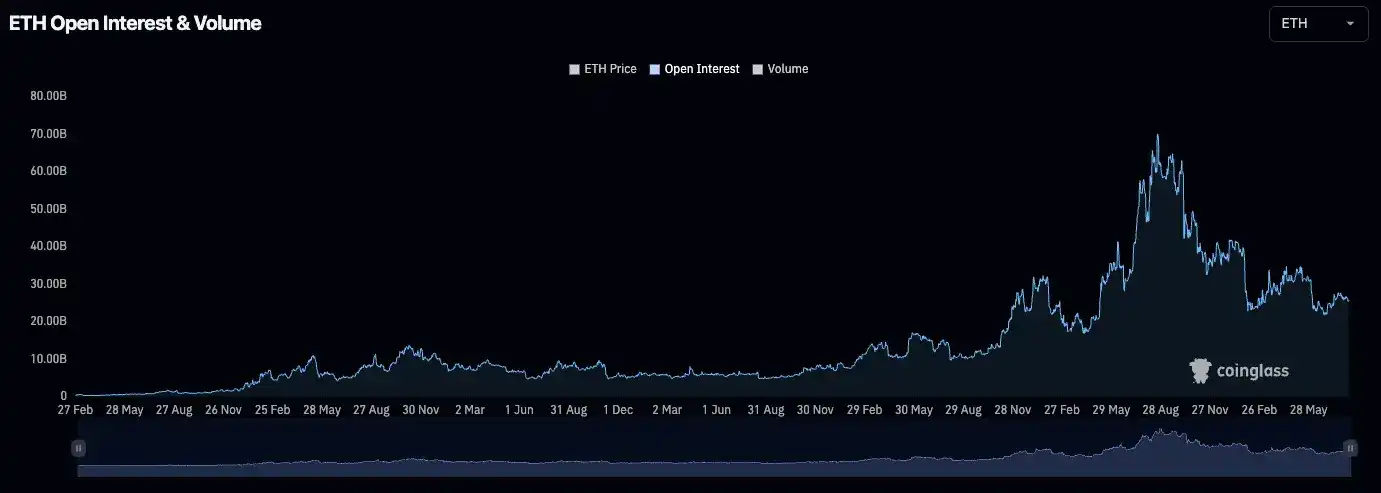
Chart: ETH futures open interest during Q2 and into July.
By the end of Q2, BTC and ETH-related futures open interest combined reached $67.07 billion, representing 65% of the total futures market.
Conclusion
In our view, Q2 2026 provides further evidence that leverage within crypto markets is gradually being digested following the sharp futures market decline on October 10, 2025.
Lending markets are "walking down the stairs, not riding the elevator down." The market has now contracted for three consecutive quarters at relatively manageable magnitudes, rather than experiencing the large, cliff-like declines seen in single quarters during the 2022 bear market.
Corporate treasury debt and futures open interest show similar trends. The market is experiencing a controlled retrenchment, not a forced deleveraging. Meanwhile, early July data also began to suggest that open interest and DeFi borrowings may be nearing a bottom.
If this trend continues, even if the market contracts further, its ability to withstand stress may be stronger than in the previous cycle, potentially avoiding a repeat of the market turmoil triggered by cascading liquidations and institutional defaults. For now, market deleveraging continues, but the overall process remains relatively orderly.