BTC Faces Triple Resistance at $80,000 Milestone, HYPE Hits New Highs Signaling Potential | Invited Analysis

Odaily星球日报Publié le 2026-05-26Dernière mise à jour le 2026-05-26

Résumé

This weekly analysis maintains a structured framework, focusing on Bitcoin (BTC) and HYPE, dissecting their multi-timeframe price action to identify key support and resistance zones and formulate actionable trading plans. The previous week's short position on BTC yielded a 2.78% gain, reinforcing the "signal-driven, disciplined" approach. For Bitcoin, the core scenario revolves around the battle between the 78,500–79,500 USD resistance zone and the 73,500–75,000 USD support area. The daily chart shows BTC within a rising channel; a failure to hold support at the channel's midline could lead to a test of the lower boundary. The 4-hour chart details an 8-segment corrective structure from the 82,850 USD high. Two short-term strategies are proposed: (A) Selling on a failed rally into the 78.5k-79.5k zone, with a stop above 80,600, or (B) Selling a confirmed breakdown below the 73.5k-75k support, with a stop above 76,500. Medium-term positioning remains neutral. For HYPE, the 4-hour chart indicates a five-wave advance from the May 14th low, now showing potential exhaustion and a top warning signal near 65 USD. The core view is to watch for a potential short-term peak formation. The recommended strategy is to avoid chasing the rally and instead look for a long setup upon a pullback to the 47.5–50 USD support zone, provided clear stabilization and model confirmation signals appear. The report concludes with a detailed review of the prior BTC short trade, executed based on model s...

Continuing with our structured analytical framework this week, we dissect the current movements of Bitcoin and HYPE from multiple time dimensions, assess the struggle between buyers and sellers around key resistance and support zones, and formulate specific, actionable operational plans accordingly.

Last week's short position successfully yielded a 2.78% profit, once again validating the trading logic of 'signal-driven, strict discipline'. However, a single profitable trade does not necessarily indicate that the market direction is definitively correct – the market always retains the possibility of exceeding expectations.

The core variable for this week remains the battle between the $78,500–$79,500 resistance zone and the $73,500–$75,000 support zone. The outcome will be answered by the market itself.

Summary of Core Trading Views for This Week:

• Analysis of BTC's multi-cycle price structure. (Detailed in Part I)

• BTC price forecast and mid-term, short-term operational strategies for this week. (Detailed in Part II)

• Analysis of HYPE's hourly chart structure. (Detailed in Part III)

• HYPE price forecast and short-term operational strategy for this week. (Detailed in Part IV)

Market Verification of Last Week's Trading Strategies and Core Views:

• BTC Short-term Trading Results: Bitcoin completed one short-term short position (1x leverage) last week, achieving a profit of approximately 2.78%. (Detailed in Table I)

• Market Verification of BTC Price Forecast: In last week's article, we noted: If the price effectively breaks below the support zone of $78,500–$79,500, it will test the support strength near $75,000. The current market movement verifies our previous forecast.

I. Analysis of Bitcoin's Multi-Cycle Price Structure

1. BTC Daily Chart Structure Analysis

Bitcoin _ Daily Chart:
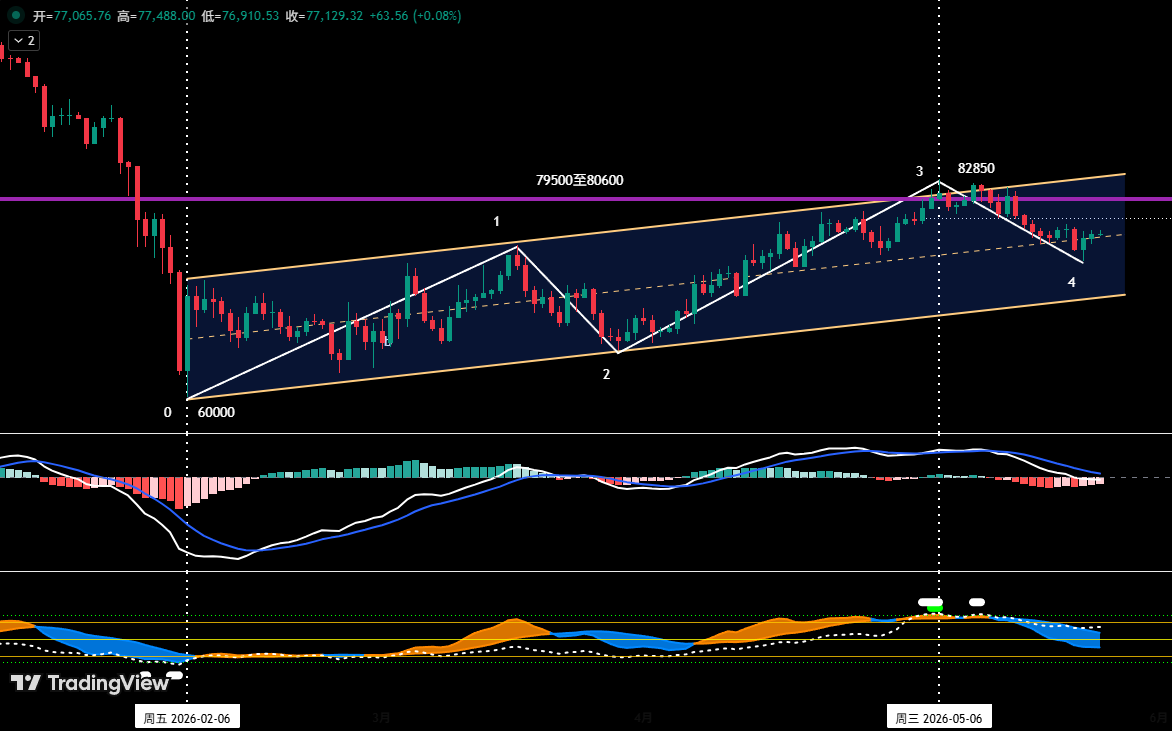
Figure 1

• As shown in (Figure 1), since establishing a stage low near $60,000 on February 6, 2026, Bitcoin's daily chart has constructed and maintained a clearly structured ascending channel: its lower boundary is formed by connecting the lows of February 6 and March 29, while the upper boundary is drawn parallel to the lower boundary through the high of March 17.

• In our April 27th weekly review, we pointed out: "The current price is facing dual pressure from the channel's upper boundary and the $79,500 to $80,600 resistance zone, making a breakthrough likely difficult". Subsequent market action confirmed this assessment. After nearly 20 days of tug-of-war between bulls and bears, although a new rebound high of $82,850 was reached on May 6, it failed to effectively break through this zone's resistance, and the price subsequently began to fluctuate downward.

From the current structure, the price has retraced from near the channel's upper boundary to the mid-channel area. If the price fails to find effective support near the mid-channel and resume its uptrend, the probability of subsequently seeking support at the channel's lower boundary is increasing.

2. In-Depth Analysis of BTC's Hourly Chart Structure

Bitcoin _ 4-Hour Chart
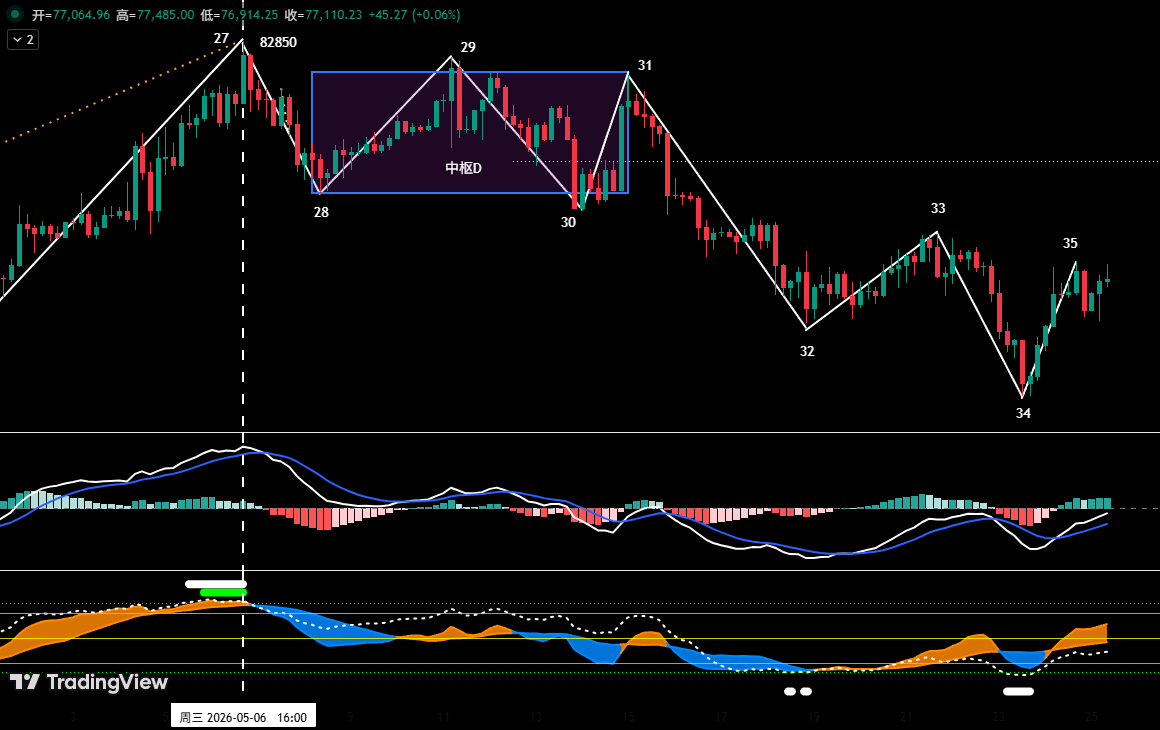
Figure 2

As shown in (Figure 2), from the May 6 high of $82,850 to the ongoing adjustment;

• On the 4-hour chart, it can be subdivided into an 8-segment adjustment structure: from "Segment 27-28" to "Segment 34-35"; Central D: Due to the overlapping of segments 28-29, 29-30, and 30-31, they constitute Central D.

• From the 4-hour chart structure, segment 34-35 is about to rebound to the $78,500–$79,500 zone. If the price faces resistance and falls back after rebounding to this zone, failing to form an effective breakthrough, the market is likely to continue the current fluctuating adjustment pattern and test the core support band of $73,500–$75,000 again.

II. Bitcoin Price Forecast and Operational Strategy for This Week

1. BTC Price Forecast for This Week:

Core View This Week: Focus on the outcome of the battle between bulls and bears for the $78,500–$79,500 resistance zone and the $73,500–$75,000 support zone.

2. Core Resistance Levels:

• First Resistance Zone: $78,500–$79,500 (near the boundaries of two central zones)

• Second Resistance Zone: $83,500–$84,500 (previous dense trading area)

3. Core Support Levels:

• First Support Zone: $73,500–$75,000 (previous key support area)

• Second Support Zone: $69,500–$70,500 (previous key support area)

4. Operational Strategy for This Week (Excluding Impact of Sudden News)

1. Mid-term Strategy:

Bitcoin _ Daily Chart: (Position Monitoring Model)
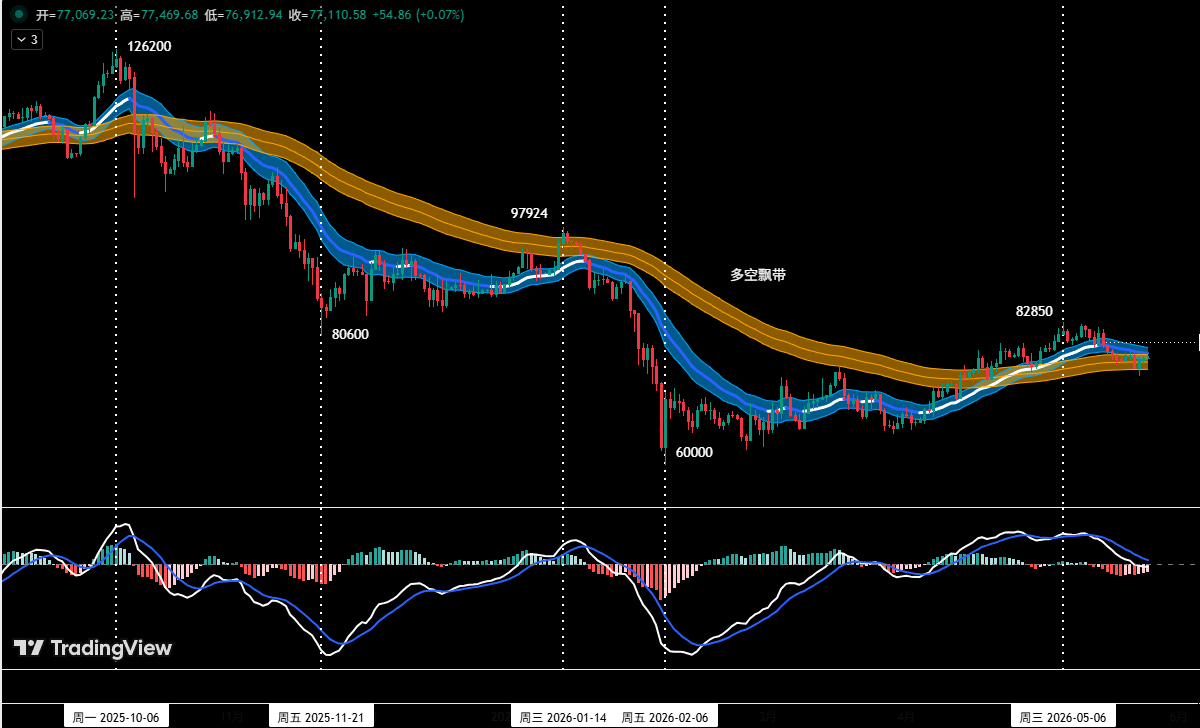
Figure 3

Position Monitoring Model: As shown in (Figure 3), based on trading rules, the market's mid-term direction is not yet clear. This week's mid-term strategy is to maintain a no-position, wait-and-see approach.

2. Short-term Strategy: Utilize 30% of capital, set stop-loss points, and look for "spread" opportunities based on support and resistance levels. (Using 30-minute/60-minute as the operational cycle).

3. In short-term operations, to dynamically respond to complex market developments, we have prepared two specific operational plans in advance: Plan A/B.

Plan A: Rebound Meets Resistance, Sell High.

• Entry: When the price rebounds to the $78,500–$79,500 zone and encounters resistance, combined with a top signal from the quantitative model, a short position below 30% can be established.

• Risk Control: Initial stop-loss set above $80,600.

• Exit: When the price adjusts near important support levels combined with model signals, gradually close the position to take profits.

Plan B: Effectively Breaks Support, Follow the Trend Short.

• Entry: When the price effectively breaks below the $73,500–$75,000 support zone combined with a model top signal, a short position below 30% can be established.

• Risk Control: Initial stop-loss set above $76,500.

• Exit: When the price falls to important support levels combined with model signals, gradually close the position to take profits.

III. HYPE Price Structure Analysis

HYPE_4-Hour Chart
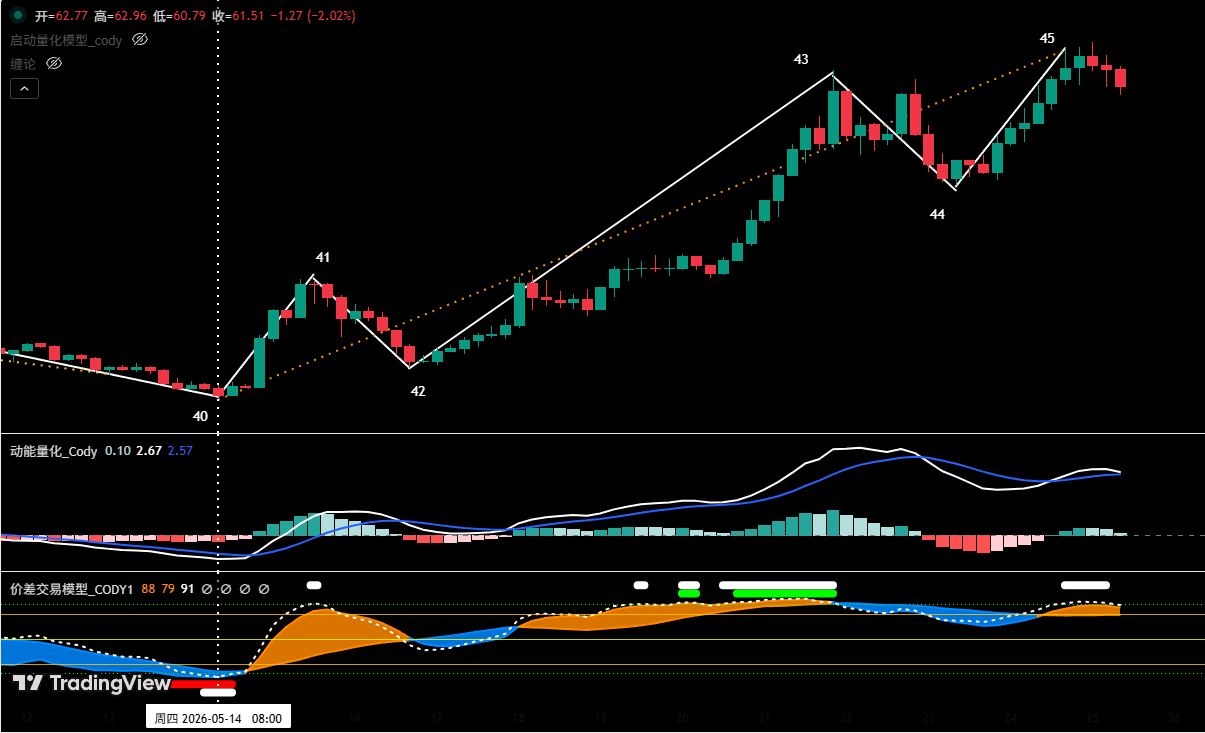
Figure 4

1. As shown in (Figure 4), the uptrend in HYPE starting from the May 14 low of $38.14 can be divided into a five-segment structure on the 4-hour chart: segments 40-41, 41-42, 42-43, 43-44, 44-45.

2. Our proprietary "Spread Trading Model" indicates that near endpoint 45, a top warning signal (white dot) has been triggered.

3. From the "Momentum Quantification Model" perspective, the rising segment (44-45) near $65 has shown signs of weakening upward momentum.

4. If the price forms a momentum bearish divergence state at "endpoint 45" and resonates with the top warning signal from the "Spread Trading Model", the probability of the price forming a short-term high here increases significantly.

IV. HYPE Price Forecast and Short-Term Operational Strategy for This Week

1. HYPE Price Forecast for This Week:

Core View on HYPE This Week:

• Observe whether "endpoint 45" can form a short-term high since the rise began on May 14.

• If a short-term high is formed, subsequently, look for short-term long opportunities when the price retraces to key support areas (e.g., $47.5 to $50) and shows clear signs of stabilization.

2. HYPE Short-Term Operational Strategy for This Week: (Buy on Support)

Currently, the strategy of "avoid blind chasing of highs, buy on dips" should be followed. If the price retraces to the $47.5 to $50 zone, finds support, and shows stabilization signals, combined with bottom signals triggered by both models, consider a light long position. Position size must be controlled below 30%, and strict stop-loss discipline must be maintained.

V. Operational Review

1. Short-Term Operation Review:(See Table I)

We strictly followed the operational plan. Based on trading signals from our proprietary "Spread Trading Model" and "Momentum Quantification Model", we completed one short-term (short) operation last week, achieving a trading profit of 2.78%.

1. Bitcoin Short-Term Trading Details Summary: (Leverage*1x)
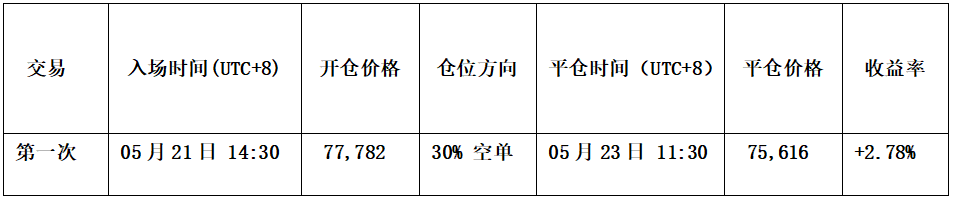
Table I

2. Short-Term Trading Review: (See Figure VI)

• Entry Strategy:

a. When the price rebounded near $78,500, encountered resistance, showed pressure signals, and the candlestick formed a "top reversal" bearish signal;

b. The "Spread Trading Model" triggered a top warning signal (white dot), and the "Momentum Quantification Model" formed a momentum bearish divergence signal.

Therefore, we established a 30% short position at $77,782.

• Exit Strategy:

a. When the price fell near $75,000 and found support, and the candlestick formed a "bottom reversal" signal;

b. The "Spread Trading Model" triggered a strong bottom warning signal (red dot + white dot), resonating with a bottom signal from the "Momentum Quantification Model".

Therefore, we closed all positions near $75,616.

• Summary: This trade successfully yielded a profit of approximately 2.78%.

BTC_30 Minute Chart: (Momentum Quantification Model + Spread Trading Model)
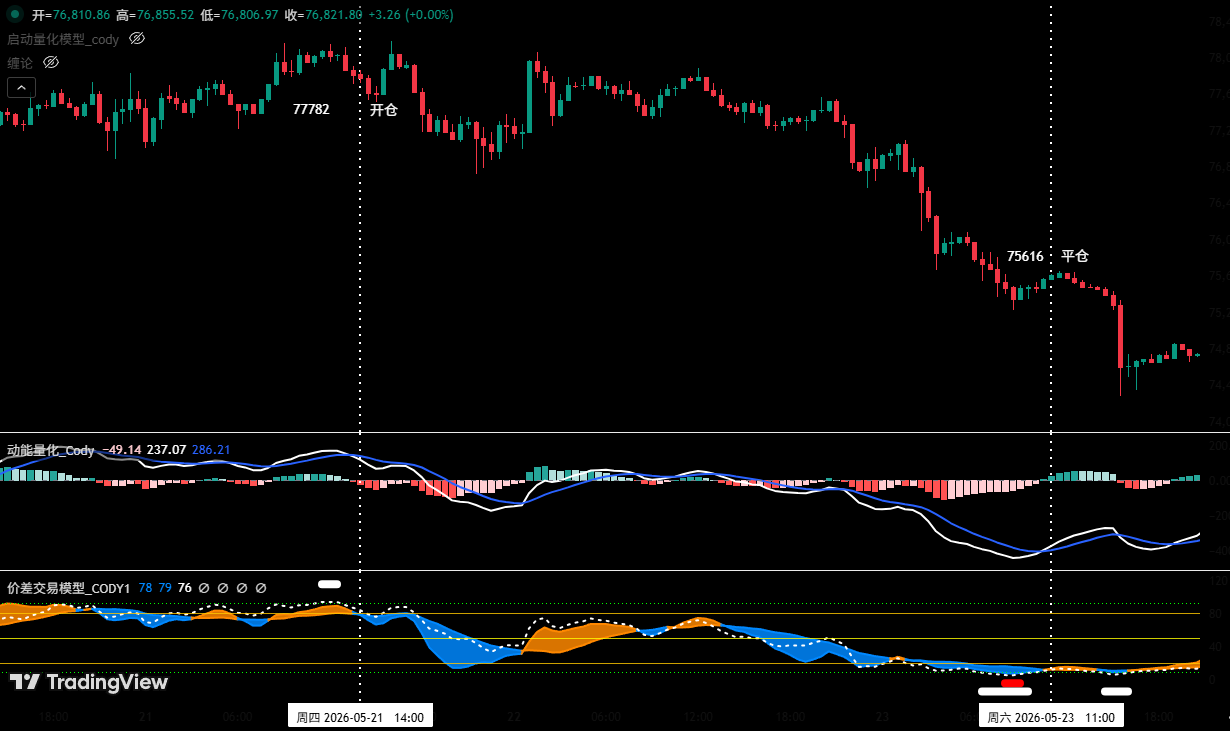
Figure V (Short-Term Trading Illustration)

VI. Special Note:

1. When opening a position: Immediately set the initial stop-loss point.

2. When profit reaches 1%: Move the stop-loss to the entry cost price (break-even point) to ensure capital safety.

3. When profit reaches 2%: Move the stop-loss to the 1% profit level.

4. Continuous Tracking: Thereafter, for every additional 1% profit, move the stop-loss up by 1%, dynamically protecting and locking in profits.

Financial markets are ever-changing; all market analysis and trading strategies require dynamic adjustment. All views, analytical models, and operational strategies mentioned in this article are derived from personal technical analysis, intended solely for personal trading log purposes, and do not constitute any investment advice or operational basis. The market carries risks; investment requires caution. Please do not make decisions based on this.


Cryptos en tendance

Questions liées

QAccording to the article's analysis, what are the two main resistance and support zones for Bitcoin this week?

AThe core resistance zone is 78,500-79,500 USD, and the core support zone is 73,500-75,000 USD.

QWhat was the primary technical reason for the author's successful short trade on Bitcoin the previous week?

AThe trade was executed based on a confluence of signals: the price encountered resistance near 78,500 USD forming a top reversal candlestick pattern, and both the author's 'Price Difference Trading Model' and 'Dynamic Energy Quantification Model' triggered top warning signals, including momentum divergence.

QBased on the analysis, what is the key condition for HYPE to present a potential short-term buying opportunity?

AA short-term buying opportunity for HYPE may arise if the price pulls back to the 47.5 to 50 USD support zone, shows clear signs of stabilization, and is confirmed by bottom signals from the author's trading models.

QWhat is the author's current medium-term (midline) strategy for Bitcoin, as indicated by their 'Position Monitoring Model'?

AAccording to the 'Position Monitoring Model', the medium-term market direction is not yet clear. Therefore, the author is maintaining a strategy of staying out of the market (holding no medium-term positions) and observing.

QIn the article's proposed short-term trading plans for Bitcoin, what are the two main scenarios (Plan A and Plan B)?

APlan A: Sell short on rallies if the price rebounds to the 78,500-79,500 USD resistance zone and encounters selling pressure. Plan B: Sell short on breakouts if the price effectively breaks below the 73,500-75,000 USD support zone.

Lectures associées

Les retraits de Bitcoin se poursuivent : 8 ans de stockage en portefeuille froid Coldcard se sont terminés par un solde nul

Le portefeuille matériel Coldcard a été compromis, entraînant une nouvelle vague de retraits depuis les appareils vulnérables. Selon Galaxy Research, environ 1 367,05 BTC (88,6 millions de dollars) ont été dérobés à partir de 4 585 adresses. Le problème ne réside pas dans le firmware, qui a été corrigé, mais dans les phrases seed générées entre mars 2021 et les mises à jour correctives. Ces phrases, créées en raison d'une erreur de programmation ayant conduit à l'utilisation d'un générateur de nombres aléatoires logiciel (Yasmarang) au lieu du générateur matériel STM32, sont prévisibles et vulnérables à une attaque par force brute hors ligne. Les propriétaires concernés doivent impérativement générer une nouvelle phrase seed sur un firmware corrigé et transférer leurs actifs, sous peine de rester exposés. L'histoire d'un investisseur de 39 ans illustre l'impact dévastateur : après avoir accumulé 2 BTC (130 000 dollars) sur huit ans via un travail physique, en les conservant comme protection contre l'hyperinflation dans son pays, il a tout perdu en quelques minutes. Son cas montre que même les stratégies de conservation à long terme les plus prudentes ("cold storage") ne sont pas infaillibles. D'un point de vue historique, cet incident rappelle les faiblesses passées des générateurs de nombres aléatoires dans la cryptographie. Il remet en question l'idée reçue selon laquelle le stockage hors ligne garantit automatiquement une sécurité absolue. La communauté espère que le fabricant pourra aider à récupérer les fonds volés.

cryptonews.ruIl y a 1 h

Les retraits de Bitcoin se poursuivent : 8 ans de stockage en portefeuille froid Coldcard se sont terminés par un solde nul

cryptonews.ruIl y a 1 h

Pourquoi le Bitcoin maintient 64 000 $ après la pause restrictive de la Fed

Le Bitcoin se stabilise autour de 64 000 $ après la décision de la Fed de maintenir ses taux d'intérêt dans la fourchette 3,50-3,75 %. Bien que perçu comme une pause, le vote a révélé des divisions internes, trois membres plaidant pour une hausse, signalant une attitude globalement restrictive. Cette position limite l'appétit pour les actifs risqués comme les cryptomonnaies. Le marché a réagi avec une volatilité modérée. Les FNB spot sur Bitcoin ont enregistré un afflux net de 32,1 millions de dollars, mettant fin à une série de sorties, tandis que les FNB Ethereum ont subi des sorties. Cela indique une rotation des capitaux vers l'actif principal. Les niveaux clés à surveiller pour le Bitcoin sont le support à 63 000-63 500 $ et la résistance autour de 66 000 $. Malgré la pression macroéconomique, le marché ne montre pas de signes de capitulation. Les fondamentaux du réseau Ethereum restent solides avec une file d'attente importante pour le staking. Le report du vote sur le CLARITY Act au Sénat américain a tempéré les attentes réglementaires immédiates. Pour la fin du mois, les données macro américaines (inflation, dépenses) guideront les senteurs. Le scénario de base prévoit une consolidation du Bitcoin entre 63 000 et 66 000 $. La résilience au-dessus de 63 000 $, le maintien de l'Ethereum au-dessus de 1 860 $ et la poursuite des entrées institutionnelles seront des facteurs déterminants pour une éventuelle reprise au second semestre.

cryptonews.ruIl y a 4 h

Pourquoi le Bitcoin maintient 64 000 $ après la pause restrictive de la Fed

cryptonews.ruIl y a 4 h

Parker Lewis explique pourquoi le bitcoin reste la meilleure monnaie

Parker Lewis, un analyste bitcoin renommé, a critiqué les stratégies marketing des entreprises qui se présentent comme des trésoreries crypto. Il estime que la vente d'actions privilégiées perpétuelles, présentées comme un "crédit numérique", déforme fondamentalement la nature du bitcoin. Il souligne que le bitcoin n'a pas de rendement fiduciaire intégré et que les promesses de dividendes reposent sur un modèle risqué nécessitant un afflux constant de nouveaux investisseurs. Lewis met en garde contre les risques de ces dérivés, notant que le marché des actions privilégiées perpétuelles (1 000 milliards de dollars) est minuscule comparé au marché du crédit mondial (300 000 milliards de dollars), car les institutions évitent ces risques qu'elles transfèrent aux particuliers. Il rejette également l'idée que la volatilité du bitcoin le rende impropre à la plupart des gens. Pour lui, cette volatilité est une conséquence naturelle de l'adoption massive d'un actif à offre fixe et inélastique. Il conseille d'acheter des bitcoins directement plutôt que des actions d'entreprises comme MicroStrategy. Détourner l'attention vers ces dérivés corporatifs fait oublier la vraie menace : la dépréciation rapide des monnaies fiduciaires. Lewis illustre cela avec son "indice du ribeye", montrant une inflation annuelle de 12 à 13% sur le prix d'un steak, bien supérieure aux chiffres officiels. La stratégie la plus sûre, selon lui, reste la possession directe de bitcoin et le contrôle de ses clés privées, pour se protéger des turbulences macroéconomiques, plutôt que de courir après des rendements corporatifs douteux qui amplifient les risques systémiques.

cryptonews.ruIl y a 4 h

Parker Lewis explique pourquoi le bitcoin reste la meilleure monnaie

cryptonews.ruIl y a 4 h

Trading

Spot

Articles tendance

Comment acheter HYPE

Bienvenue sur HTX.com ! Nous vous permettons d'acheter Hyperliquid (HYPE) de manière simple et pratique. Suivez notre guide étape par étape pour commencer votre parcours crypto.Étape 1 : Création de votre compte HTXUtilisez votre adresse e-mail ou votre numéro de téléphone pour ouvrir un compte sur HTX gratuitement. L'inscription se fait en toute simplicité et débloque toutes les fonctionnalités.Créer mon compteÉtape 2 : Choix du mode de paiement (rubrique Acheter des cryptosCarte de crédit/débit : utilisez votre carte Visa ou Mastercard pour acheter instantanément Hyperliquid (HYPE).Solde :utilisez les fonds du solde de votre compte HTX pour trader en toute simplicité.Prestataire tiers :pour accroître la commodité d'utilisation, nous avons ajouté des modes de paiement populaires tels que Google Pay et Apple Pay.P2P :tradez directement avec d'autres utilisateurs sur HTX.OTC (de gré à gré) : nous offrons des services personnalisés et des taux de change compétitifs aux traders.Étape 3 : stockage de vos Hyperliquid (HYPE)Après avoir acheté vos Hyperliquid (HYPE), stockez-les sur votre compte HTX. Vous pouvez également les envoyer ailleurs via un transfert sur la blockchain ou les utiliser pour trader d'autres cryptos.Étape 4 : tradez des Hyperliquid (HYPE)Tradez facilement Hyperliquid (HYPE) sur le marché Spot de HTX. Il vous suffit d'accéder à votre compte, de sélectionner la paire de trading, d'exécuter vos trades et de les suivre en temps réel. Nous offrons une expérience conviviale aux débutants comme aux traders chevronnés.

963 vues totalesPublié le 2024.12.11Mis à jour le 2026.06.02

Comment acheter HYPE

Discussions

Bienvenue dans la Communauté HTX. Ici, vous pouvez vous tenir informé(e) des derniers développements de la plateforme et accéder à des analyses de marché professionnelles. Les opinions des utilisateurs sur le prix de HYPE (HYPE) sont présentées ci-dessous.

活动图片












