How far along is this crypto bear market? Fidelity's Q3 Signal Report provides a set of coordinates: the weighted NUPL has dropped to -0.01, BTC dominance has risen to 68%, and multiple indicators are approaching historical capitulation ranges. Referencing the roughly 300-day bottoming cycles of 2018 and 2022, the current 203-day adjustment may have already completed two-thirds. The report notes that October 2026 is a timeframe worth watching, but this does not constitute a prediction for a bottom.
Author: Fidelity Digital Assets Research Team
Compiled by: Jiahuan, ChainCatcher
I. Market Overview
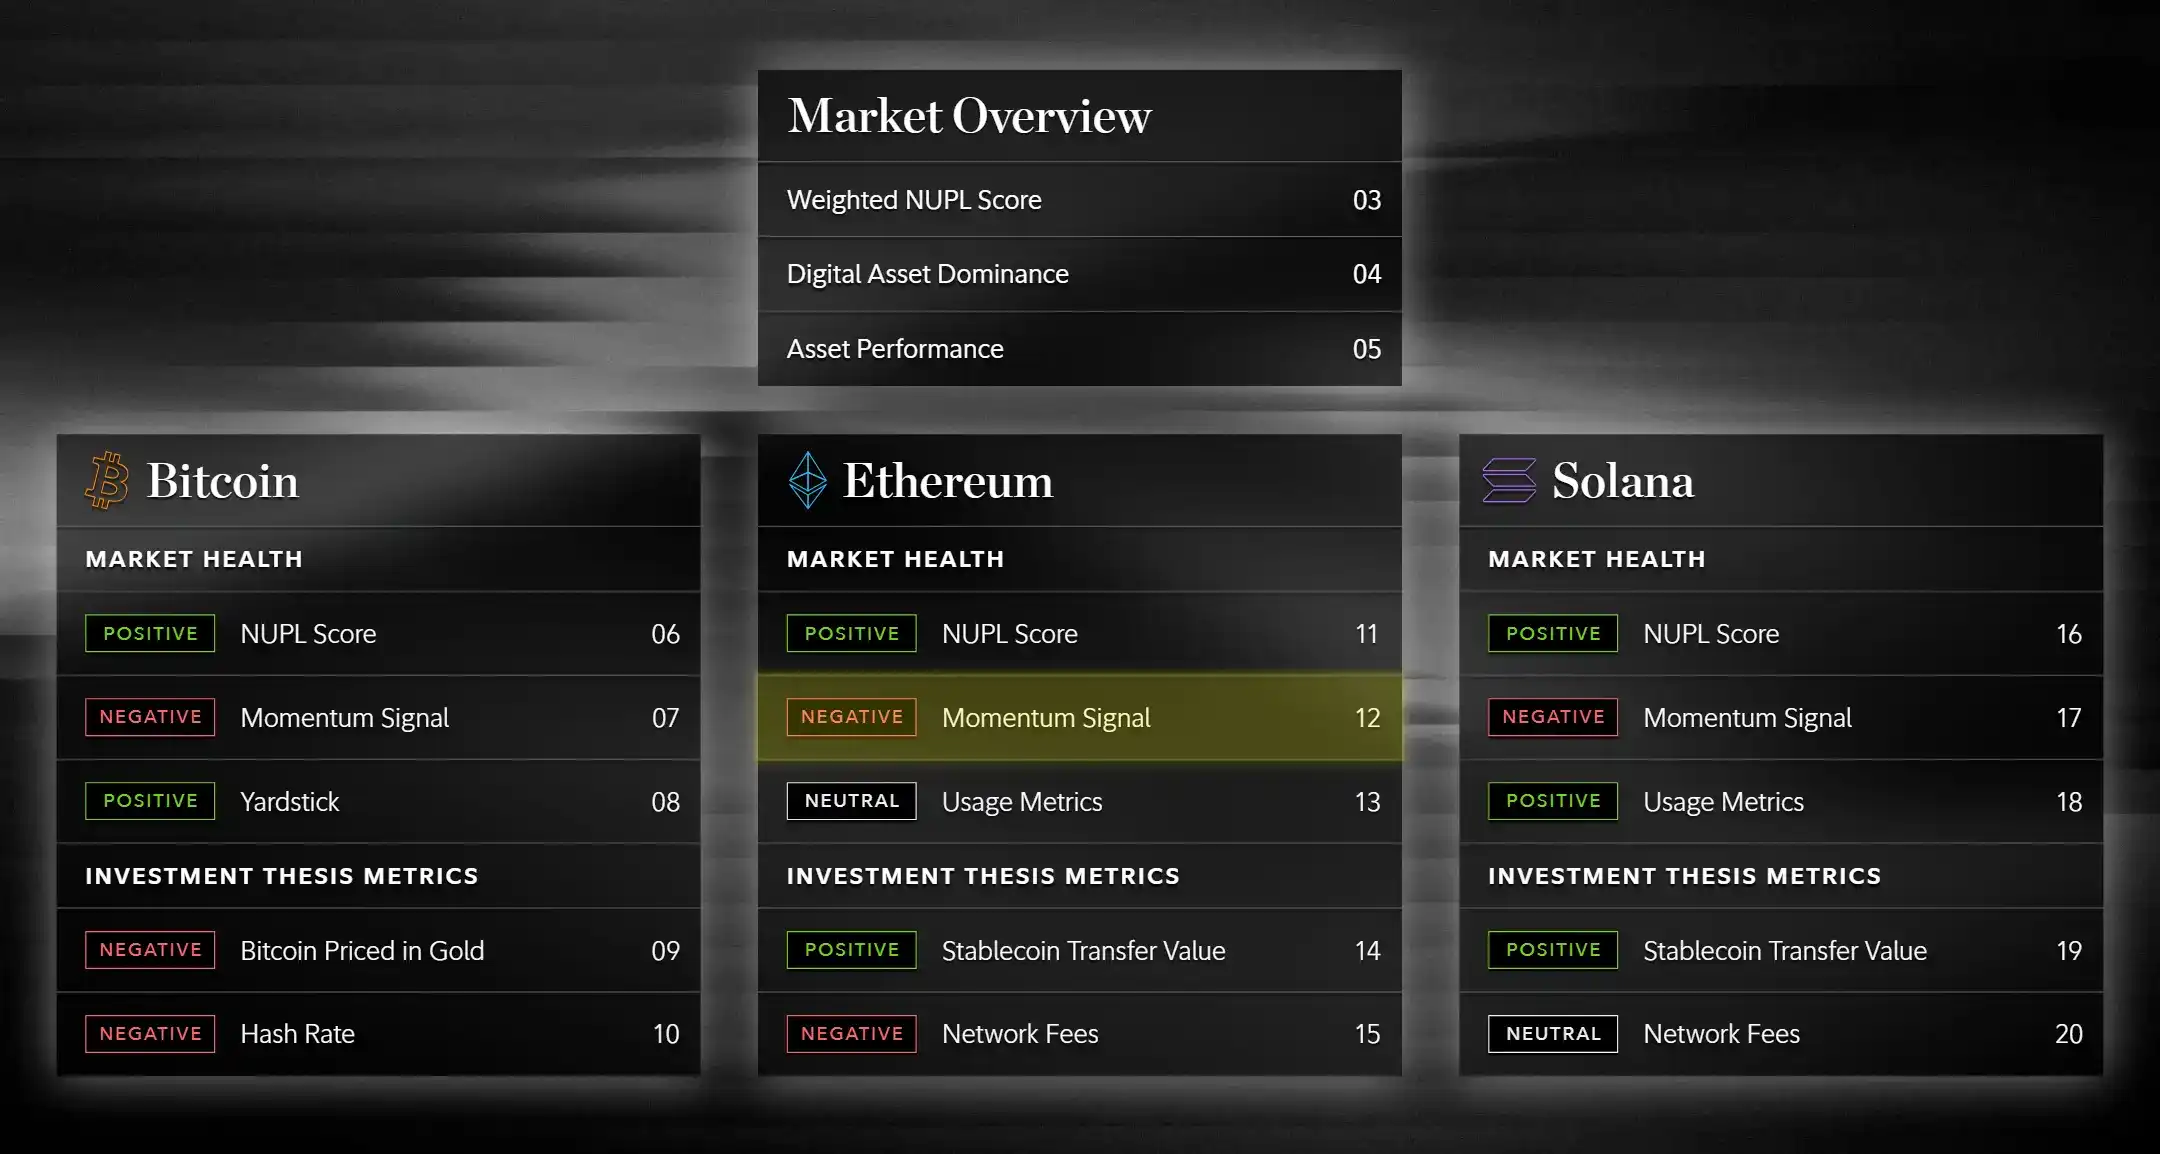
Chart: Overview Panel for the Three Major Asset Signals
Weighted NUPL: BTC Alone Supports the Market
The weighted NUPL measures whether a market-cap weighted digital asset portfolio is in an overall state of unrealized profit or loss. Since BTC's market cap proportion is far higher than ETH and SOL, this indicator is largely determined by BTC at present.
Currently, among the three assets, only BTC still records unrealized profits, while both ETH and SOL are in a state of unrealized loss. After comprehensive calculation, the weighted NUPL is -0.01, meaning the overall market is slightly below the break-even line.
In other words, the only remaining unrealized profits in the market are mainly concentrated in BTC, not from broad improvement across various assets. BTC acts as a stabilizer here, partially offsetting the loss pressure from ETH and SOL, but still insufficient to bring the entire portfolio back into positive territory.
If the three assets had equal weights, the portfolio state would be weaker due to the deeper losses of ETH and SOL. Therefore, although the weighted NUPL has turned negative, the current market structure is still slightly healthier than a scenario where "losses are evenly distributed across all assets."
This further highlights BTC's bellwether status in the digital asset market. The relative weakness of ETH and SOL against BTC reflects investors' clearer preference for the largest, most liquid asset, while remaining cautious towards other historically more volatile digital assets.
For investors, the current market is more like searching for a bottom during a repair process, rather than entering a universal profit-taking phase at the end of a cycle. BTC's relative strength has not spread to other assets, and market participation remains highly concentrated.
In Q2 2026, BTC's NUPL retreated further, and the weighted NUPL for the three assets fell to -0.01. Before more assets re-enter an unrealized profit state, the market is more likely to consolidate or continue under pressure, rather than quickly resume full expansion.
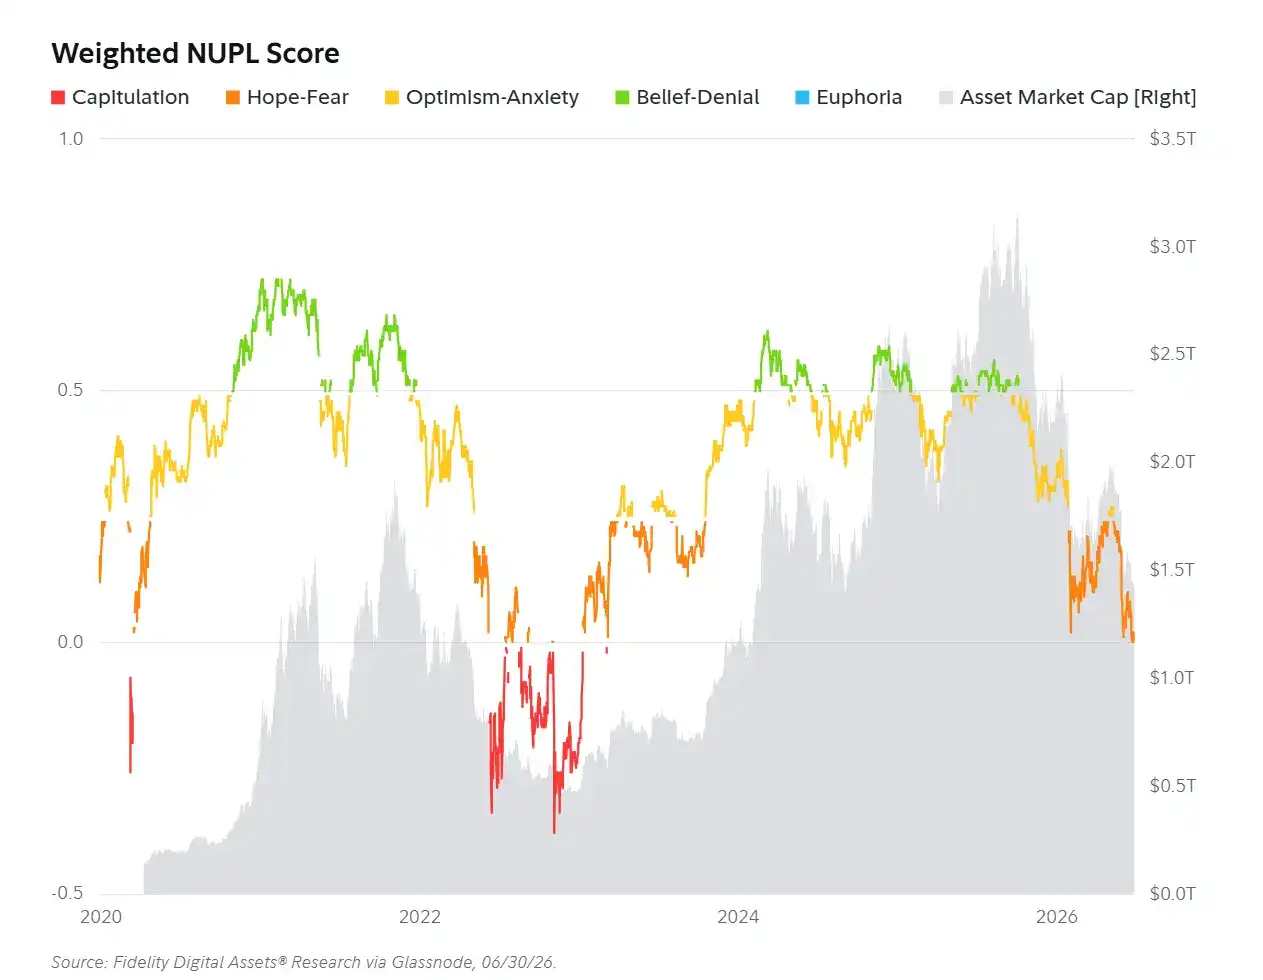
Chart: Weighted NUPL Score
BTC Dominance Rises to 68%; Asset Rotation Has Not Yet Materialized
After a sustained decline in the second half of 2025, BTC dominance has slowly risen again, and the long-term upward trend has not yet been broken.
Historically, a rise in BTC dominance is typically accompanied by other digital assets underperforming BTC. This reflects that in an environment of increased uncertainty and valuation pressure, capital tends to flow towards the most liquid and mature asset.
The rising lows of BTC dominance in different phases, along with the relatively stable upward slope, indicate that this preference is not a short-term phenomenon.
The current dominance rate suggests capital remains concentrated in BTC, with market risk appetite being highly selective. Participation in assets beyond BTC is limited, and the overall market has not yet recovered broad relative strength.
In Q2 2026, BTC dominance increased slightly from 67% to 68%, with signs of capital rotation into other digital assets remaining weak.
If BTC dominance begins to decline or flatten in Q3, it might indicate that risk appetite is recovering and other digital assets are regaining capital attention, potentially serving as an early signal of a change in market structure.
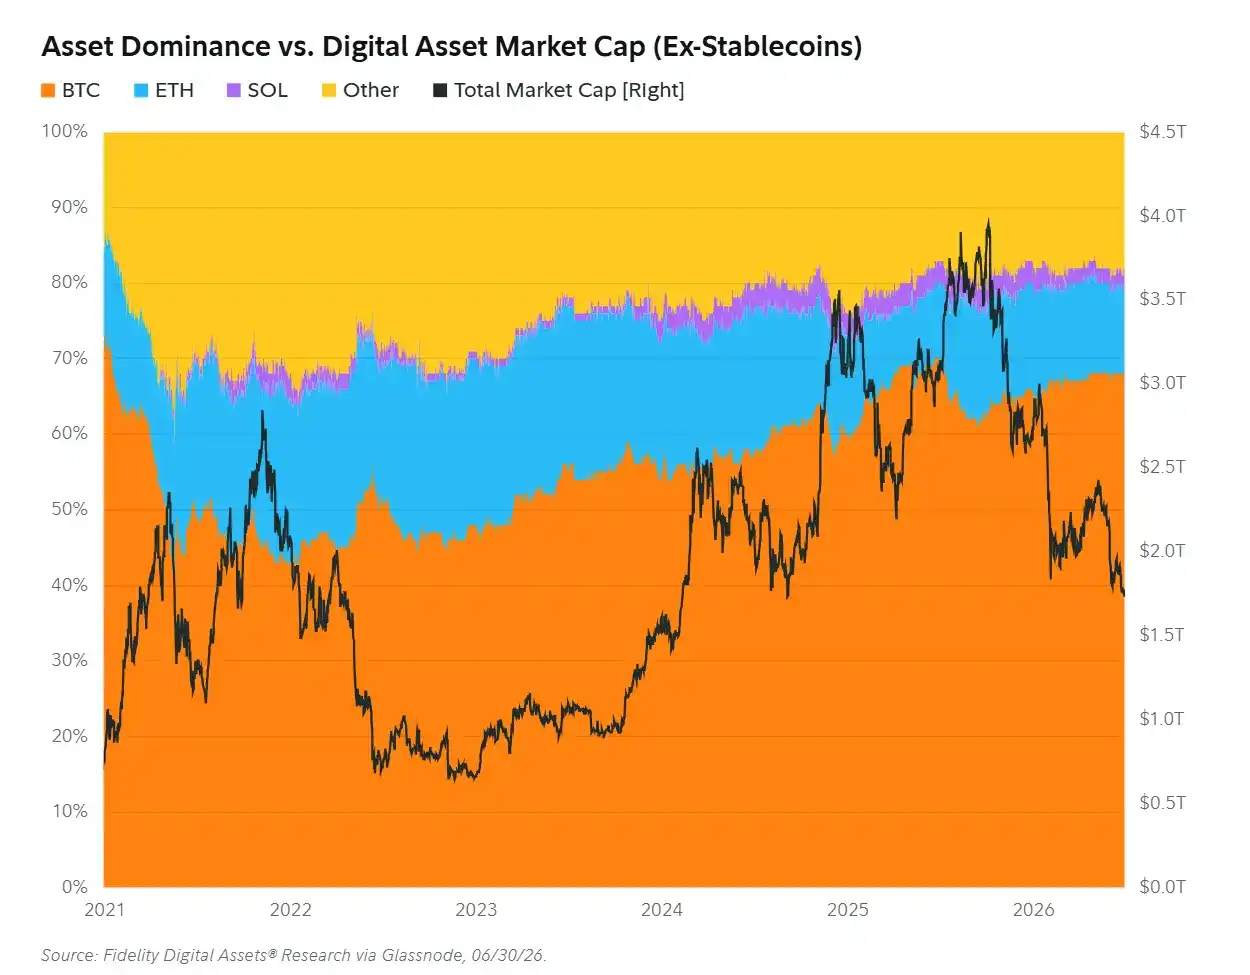
Chart: Asset Dominance vs. Total Digital Asset Market Cap, Excluding Stablecoins
Asset Performance: BTC, ETH, SOL All Decline
Based on rolling one-year returns, BTC fell about 45%, ETH fell 37%, and SOL fell 53%.
Year-to-date, the three assets also performed weakly, with BTC, ETH, and SOL falling 33%, 47%, and 41% respectively.
By the end of Q2, BTC had fallen below the 200-week moving average, market sentiment was extremely depressed, and the entire digital asset market also weakened in sync.
Adverse macro conditions, capital rotation into AI-related investments and stock markets, combined with persistently diminishing market momentum, collectively amplified this decline. Currently, multiple indicators are approaching or touching historical capitulation ranges.
Spot ETP fund flows also remained persistently negative. Year-to-date through 2026, spot ETPs recorded cumulative net outflows of $5.4 billion, with $4.9 billion occurring in Q2.
In June alone, spot ETPs saw net outflows of approximately $4.5 billion, the worst monthly performance since the launch of spot Bitcoin ETPs.
From June 1 to 4, the market also experienced nearly $6 billion in chain liquidations. Forced liquidations further amplified selling pressure and disrupted the original position structure.
Macro and geopolitical environments also acted as a drag. Inflation remained high, energy prices continued under pressure, and the market significantly adjusted monetary policy expectations: at the start of the year, the market believed there might be no rate cuts in 2026; by the end of Q2, expectations had shifted towards the possibility of rate hikes by year-end.
Short-term volatility remains high, and market bottom formation typically requires time.
However, current valuation levels and the increasingly obvious negative correlation between digital assets and traditional risk assets may also provide attractive entry points for long-term investors, provided the underlying networks' adoption trends continue to strengthen.
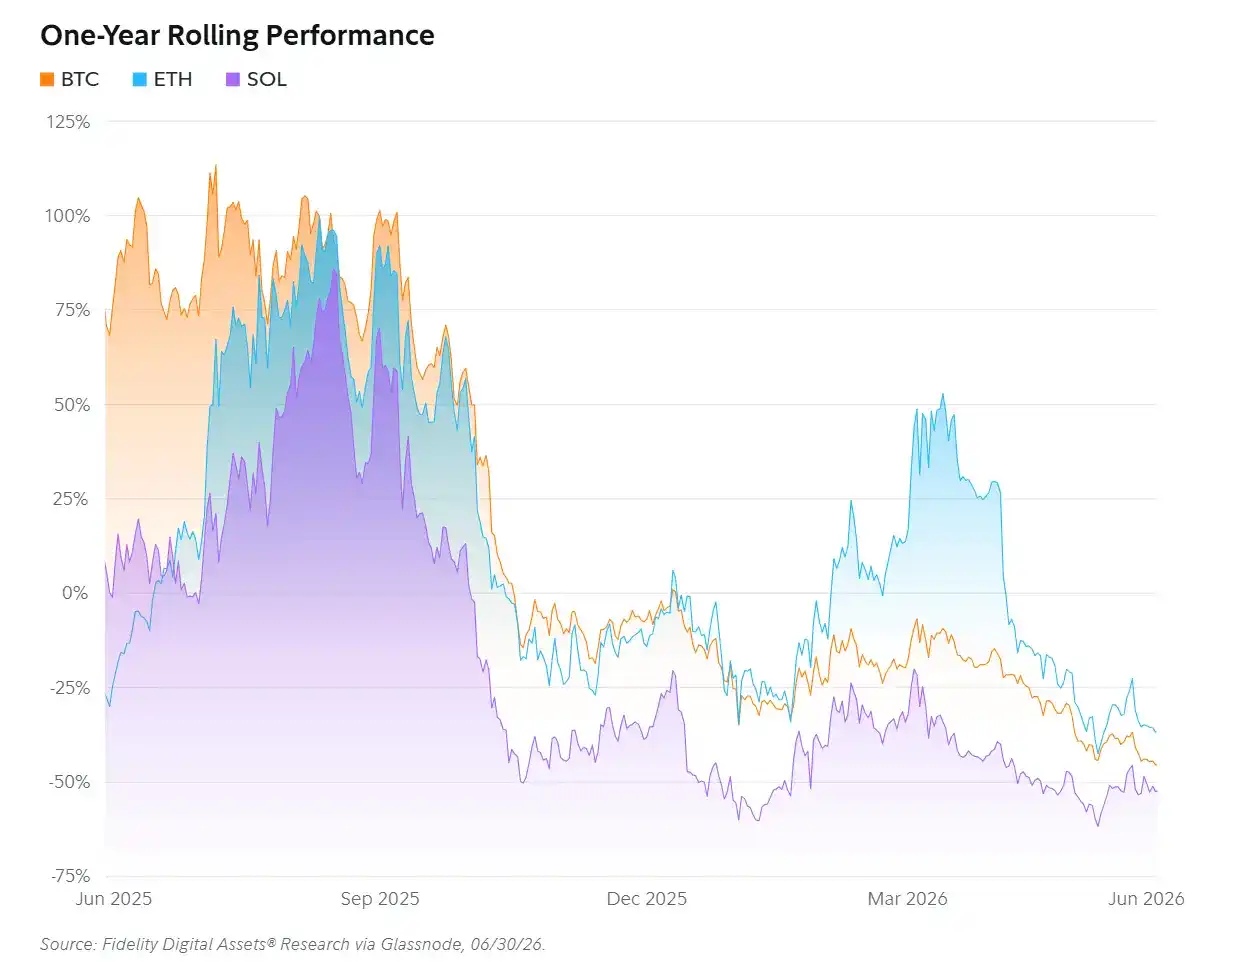
Chart: BTC, ETH, SOL One-Year Rolling Performance
II. Bitcoin
NUPL 0.09: Positive
At the end of Q2, BTC's NUPL was 0.09, in the "Hope - Fear" zone, meaning the market still has a small amount of unrealized profit, but investor sentiment is trending cautious.
Some holders remain profitable, but the market is far from forming a broad consensus that "the bottom is established."
BTC fell 14% in Q2, and NUPL dropped from 0.21 to 0.09, a decline of 0.12. This resembles a mild contraction in holders' unrealized profits rather than large-scale capitulation.
Based on current data, BTC's market price is about 10% higher than the network's aggregate cost basis, with investors collectively holding approximately $108 billion in unrealized profits.
For most of April and May, BTC's NUPL was in the "Optimism - Anxiety" zone, when the market gradually believed a bottom might have formed.
The recent indicator's retreat back to the "Hope - Fear" zone indicates market sentiment has shifted from sustained optimism to caution and uncertainty.
Historically, BTC's NUPL has fallen further into capitulation zones during bear markets, so the current state still warrants a conservative view.
Historically, when BTC's NUPL is within a range of +/- 0.05 around 0.09, the subsequent one-year median return is 53%, and the three-year compound annual growth rate is 69%, with 73 occurrences in the sample.
The correlation coefficients between NUPL and future one-year and three-year returns are -0.26 and -0.80 respectively, indicating lower NUPL is often associated with higher long-term subsequent returns. This is why Fidelity rates lower NUPL as a positive signal.
However, historical relationships may weaken or fail; judgment still needs to incorporate the macro environment and overall market structure.
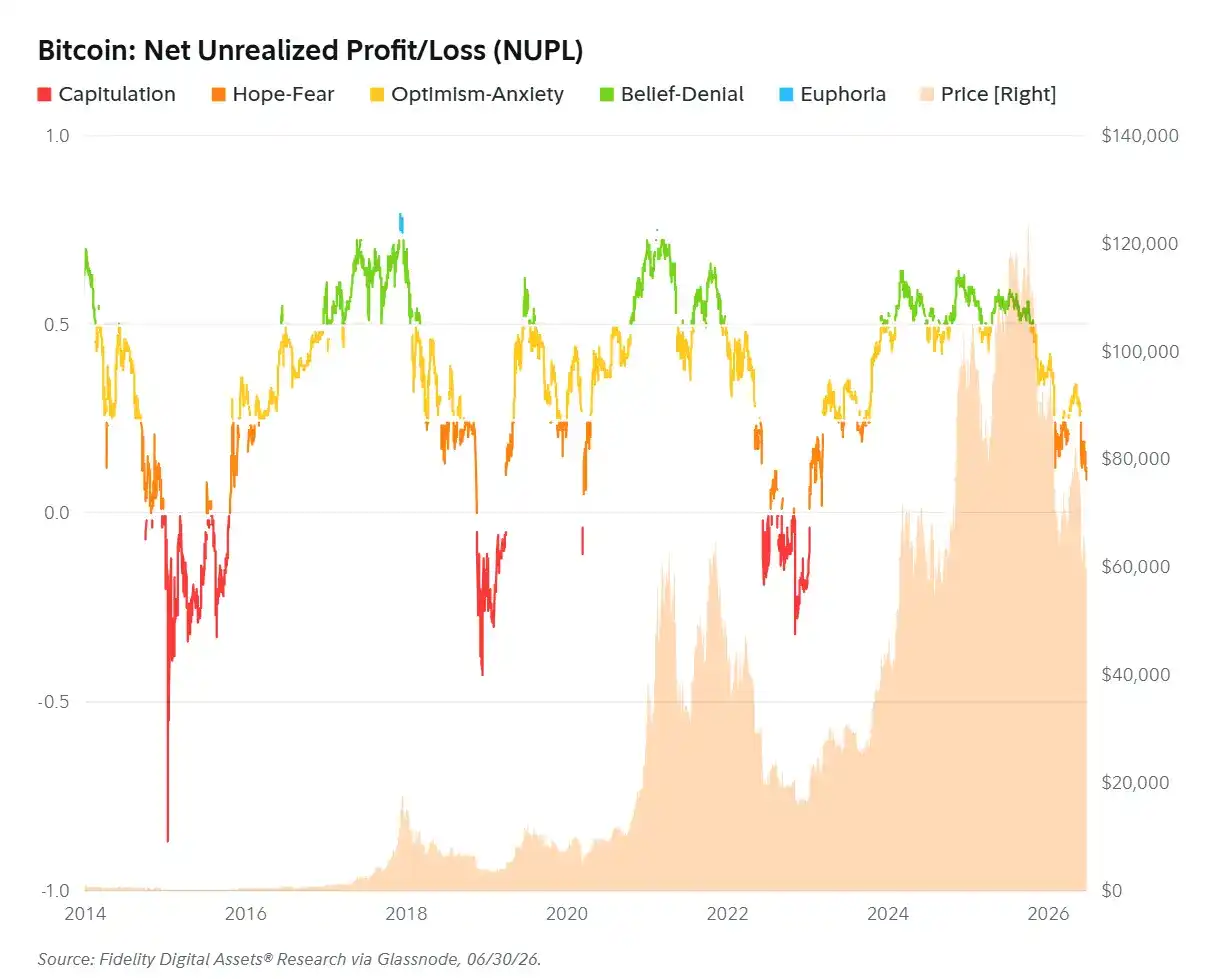
Chart: Bitcoin Net Unrealized Profit/Loss (NUPL)
Momentum Signal: Negative
BTC's current momentum indicators reflect that this decline has formed a bearish impulse, with prices failing to consistently make higher highs over the past quarter.
The signal turned positive on April 21, 2026, when BTC was at $78,317, with both short-term volatility and price momentum rising above their medium-term averages.
But this rebound did not last. On June 1, the signal turned negative again with BTC at $66,540, indicating momentum had faded and prices failed to hold their ground.
In Q2, BTC prices fluctuated between $58,500 and $82,256, with particularly sharp moves in April and May.
The momentum model produced one false positive this quarter: the initial positive fluctuation in early Q2 was judged as potentially continuing but ultimately reversed quickly.
This is an unavoidable cost of trend-following models. The goal of such models is not to precisely capture every top and bottom, but to participate as much as possible after an uptrend forms while controlling downside risk.
Since the signal turned negative on June 1, BTC has fallen another ~10% and remains in a negative momentum zone.
BTC's short-term realized volatility is about 34% annualized, below the medium-term volatility of 40%. For the momentum signal to turn positive again, either short-term volatility needs to recover moderately or medium-term volatility needs to decline further.
It is important to emphasize that this indicator is not used to predict precise tops and bottoms but to identify phases where price direction and volatility changes are synchronized. Historically, such phases often correspond to accelerating trends.
The current reading points towards caution, not that upward momentum has resumed.
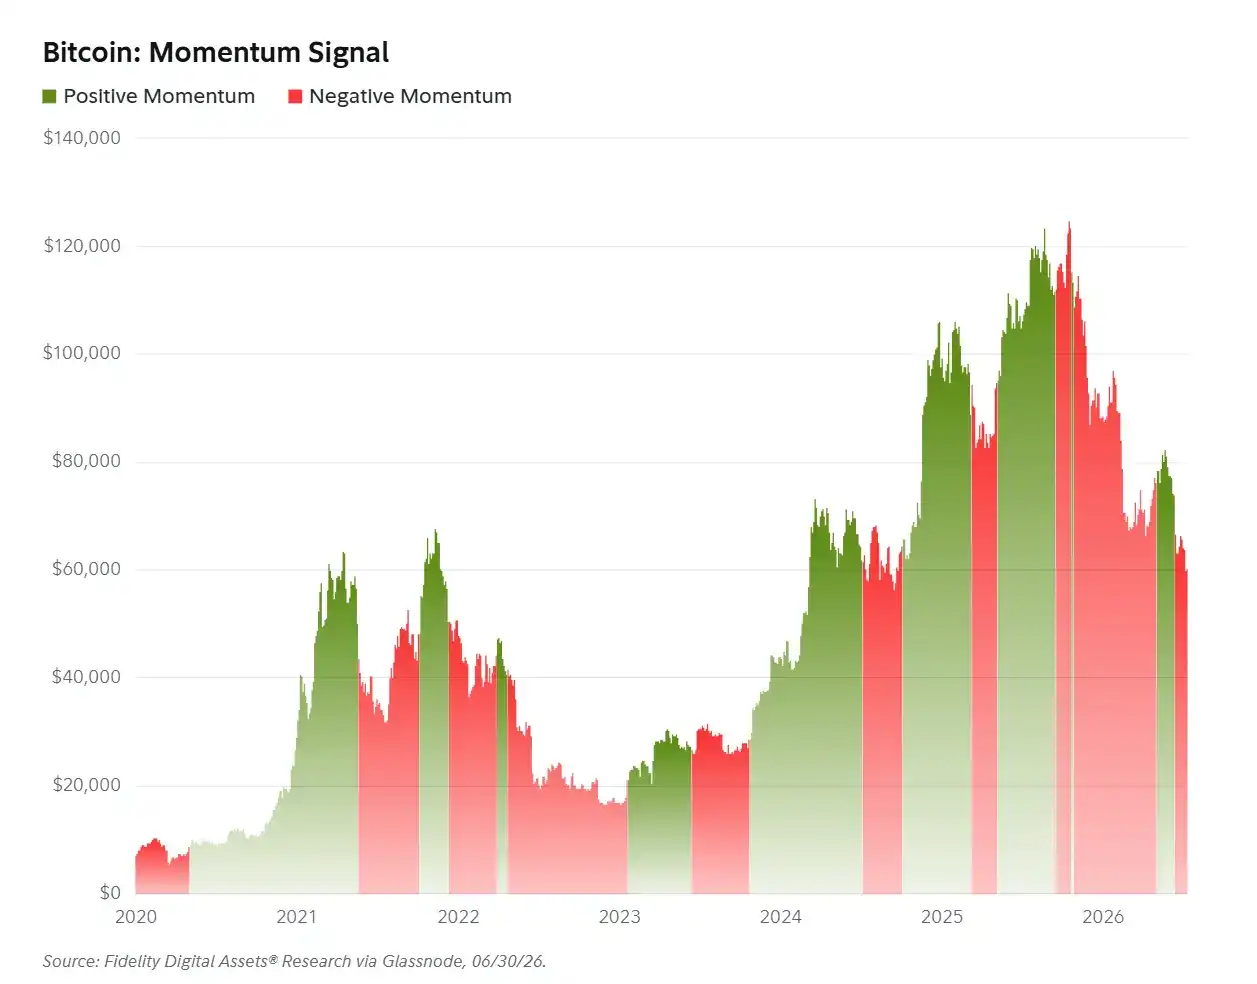
Chart: Bitcoin Momentum Signal
Yardstick: Positive
BTC price has fallen over 50% from its all-time high, but the network's hash rate has only dropped about 22% from its peak.
Miners face significant pressure, but the overall network still demonstrates strong resilience.
As a result, the Bitcoin Yardstick has approached historical lows, meaning BTC may be at a significant discount relative to the hash rate required to maintain and protect the network.
However, there are some differences in this cycle, including lower price volatility and increasing maturity of the mining industry.
BTC price is a direct input for the Yardstick. When price volatility decreases, the relative influence of hash rate in this ratio becomes more pronounced.
Simultaneously, mining companies have improved their management of energy costs and operational efficiency, allowing more flexible adjustment of operational rates, equipment migration, or optimization of power contracts based on profitability.
Therefore, mining capacity can adjust more flexibly with price changes, and dramatic deviations between price and network energy input, as seen in the past, are less likely.
Price decline and hash rate retreat have jointly pushed the Yardstick into the "Undervalued" zone. In the past 92 days, for 76 days, or about 83% of the time, the indicator has been below one standard deviation of its long-term average.
Historically, this zone typically corresponds to market accumulation phases or relative bottoms.
In 2018, the Yardstick remained in a similar zone for 298 days; in 2022, it lasted 299 days before market sentiment gradually recovered.
The current bear market has lasted approximately 203 days so far. For investors focusing on cycle rhythms, October 2026 can be regarded as an observable time window, but this does not mean the market will necessarily bottom at that time.
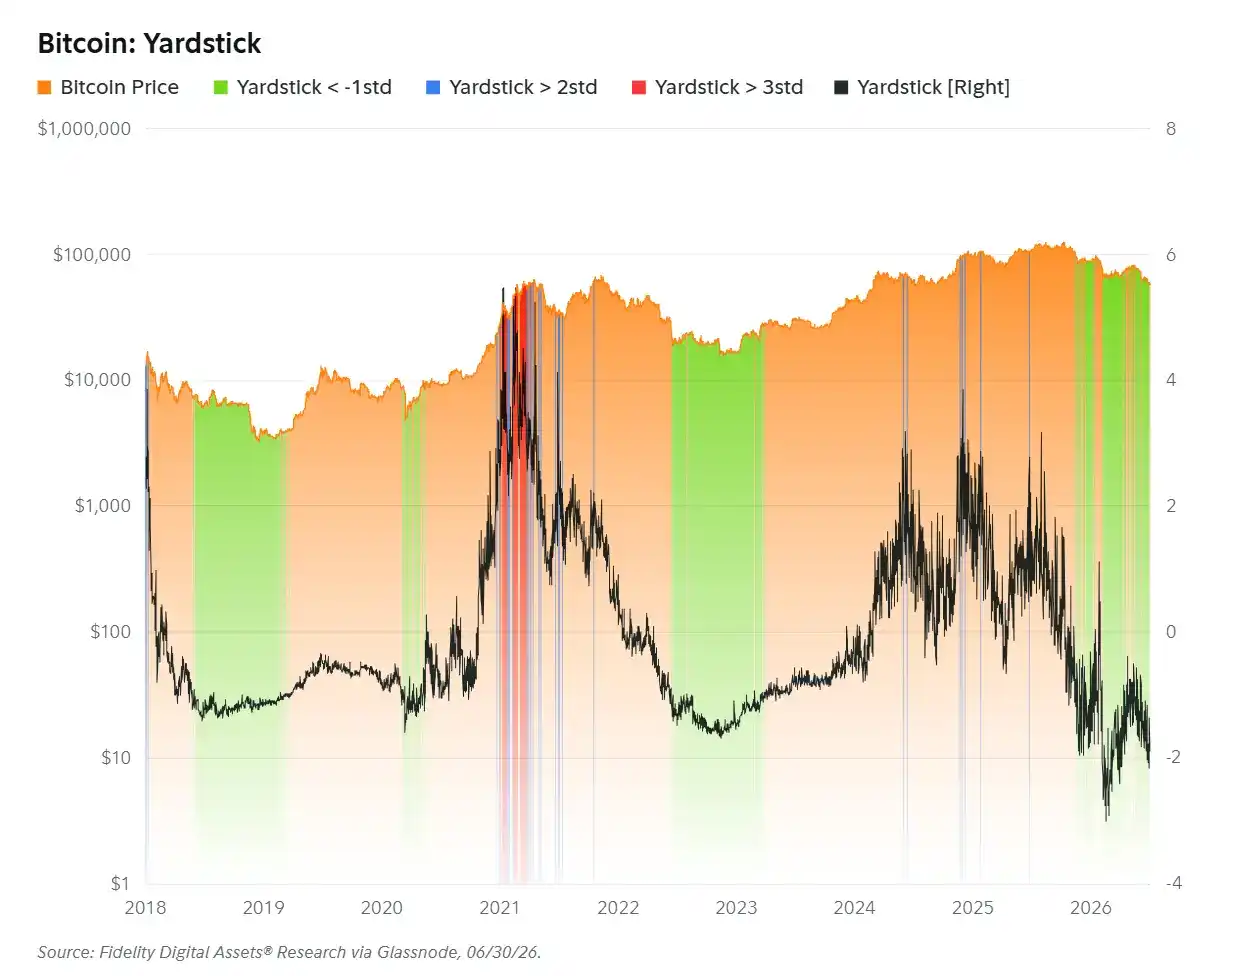
Chart: Bitcoin Yardstick
Performance Relative to Gold: Negative
One of BTC's core investment theses is its potential as a store of value.
Using gold as a pricing benchmark measures BTC's performance relative to another traditional physical safe-haven asset, rather than observing its price change relative to fiat alone.
Recent sharp price volatility does weaken BTC's store-of-value narrative in the short term, but it is insufficient to prove its long-term investment thesis has failed.
In Q2 2026, although BTC fell 14% in USD terms, its price relative to gold remained largely unchanged.
After about a year of persistent underperformance, investor preference between BTC and gold may be rebalancing.
Since February 28, BTC has risen 15% relative to gold. Against the backdrop of persistent geopolitical uncertainty, the relative performance between the two has begun to stabilize.
The strong performance of gold over the past year has been largely driven by sustained central bank purchases. Against this backdrop, a more stable equilibrium may be forming in the relative relationship between BTC and gold.
Meanwhile, on-chain indicators still point to an accumulation phase, with some indicators even showing capitulation characteristics.
For long-term allocators, BTC's sustained underperformance relative to gold may actually make current valuations more attractive.
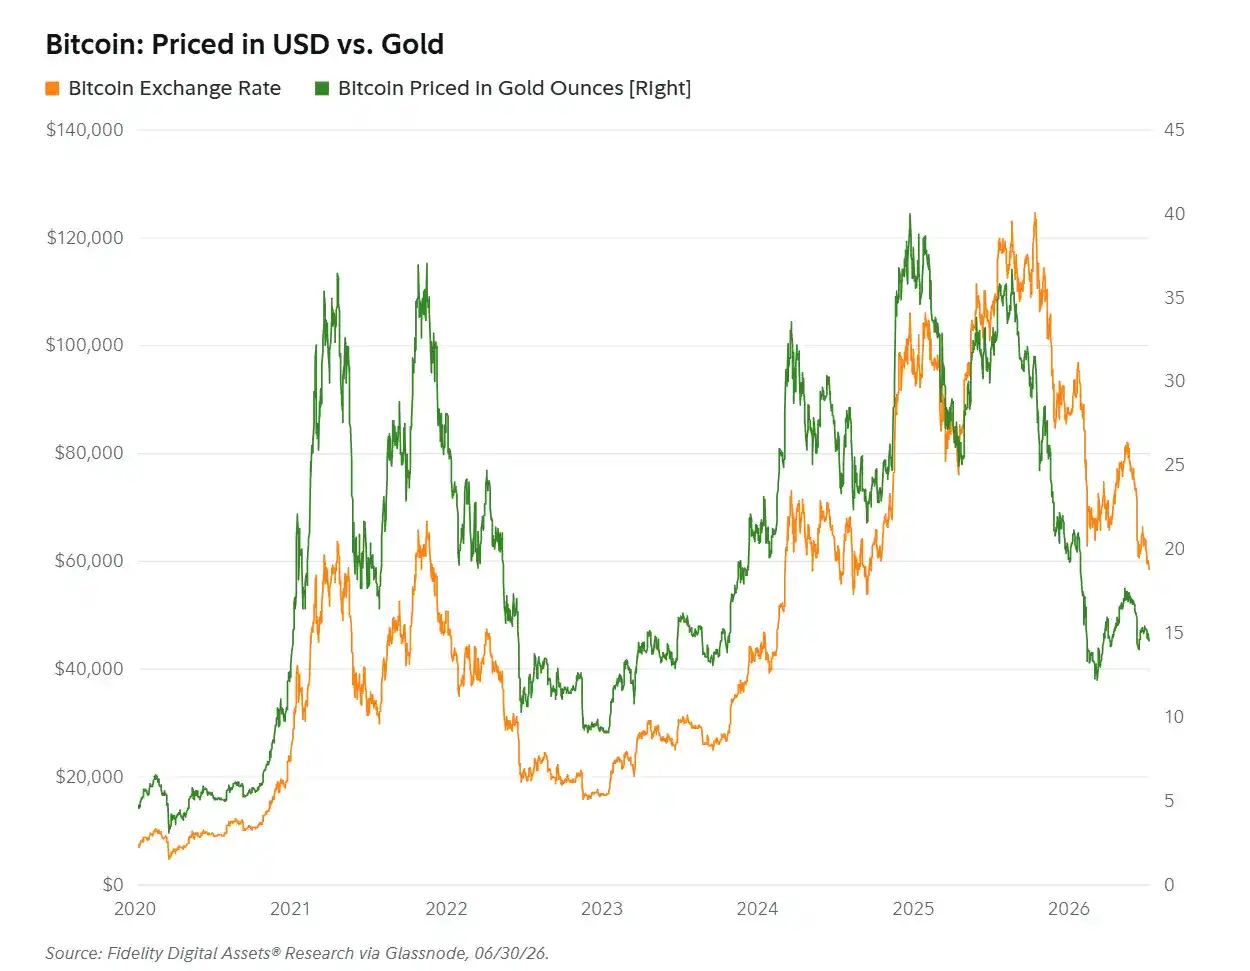
Chart: Bitcoin Performance in USD vs. in Gold Terms
Hash Rate: Negative
BTC's daily average hash rate and 30-day average hash rate remain below the historical milestone of 1000 EH/s, or 1 ZH/s, set in September 2025.
There are two main reasons: first, increasing attractiveness of AI and high-performance computing businesses for power, land, and data center resources; second, the bear market compressing Bitcoin mining profit margins.
Some mining companies may be reallocating power capacity, data center infrastructure, and new capital expenditures towards AI or high-performance computing businesses.
In a low BTC price environment, AI computing contracts often offer more stable, predictable revenue, making it economically rational for miners to redeploy infrastructure.
It's important to note that Bitcoin ASIC miners are highly specialized hardware typically not directly usable for AI computing. Therefore, miners shifting to AI primarily involves repurposing power, land, facilities, and cooling infrastructure, not directly converting existing miners into AI servers.
Idle miners are also unlikely to be parked long-term. More common approaches are selling equipment or relocating it to regions with lower electricity costs, rather than permanently exiting the network.
Since BTC price peaked in October 2025, hash rate has continued to decline. Meanwhile, mining difficulty has remained high for an extended period, failing to retreat in sync with price.
Price decline and compressed margins have led miners at the cost margin to gradually power down.
Historically, deteriorating mining economics during bear markets also lead to periodic hash rate declines. However, competition for infrastructure resources from AI data centers and power contracts may cause this hash rate decline to last longer than historical averages.
In Q2, daily average hash rate increased 8% quarter-over-quarter, but the 30-day average hash rate declined 6% over the same period.
Year-to-date in 2026, BTC price has fallen over 29%, while hash rate has only dropped about 12%, indicating that while miner economics are under pressure, the network overall maintains some resilience.
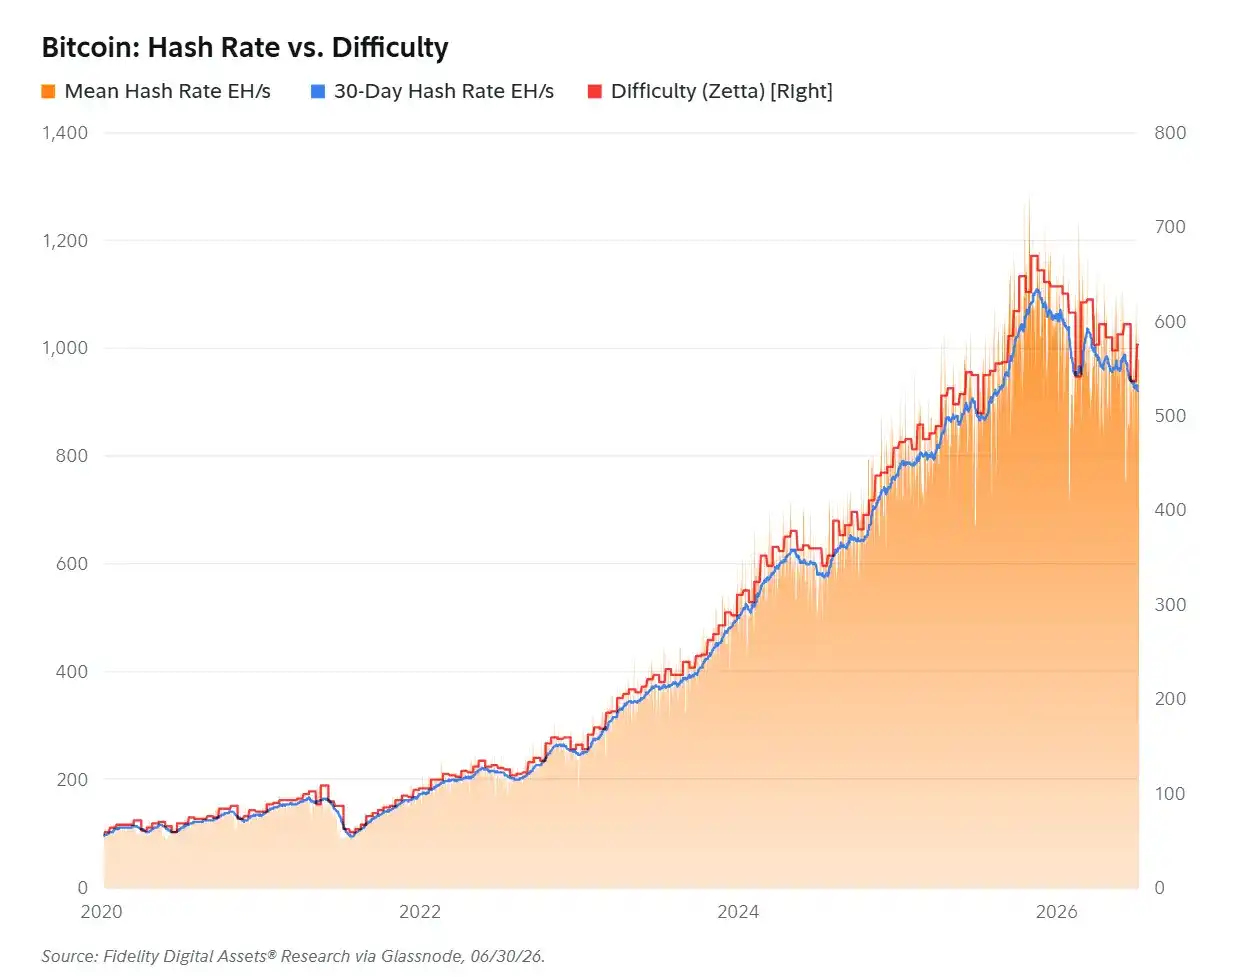
Chart: Bitcoin Hash Rate & Mining Difficulty
III. Ethereum
NUPL -0.43: Positive
In Q2, ETH's NUPL continued to decline within the "Capitulation" zone, with market sentiment deteriorating further.
During the quarter, ETH price fell 25%, and NUPL dropped from -0.12 to -0.43, a decline of 0.31, significantly expanding investors' unrealized losses.
Based on current data, ETH is trading about 30% below the network's aggregate cost basis, with total unrealized losses around $87 billion.
On June 6, ETH's NUPL touched a cyclical low of -0.46, which has not been breached since.
While the indicator could still make new lows, holding this low may be a level worth watching for long-term investors.
Historically, when ETH's NUPL is within a range of +/- 0.05 around -0.43, subsequent returns have typically been substantial.
Since 2018, similar readings correspond to a median future one-year return of 70% and a three-year compound annual growth rate of 133%, with 90 observations for each time horizon.
The correlation coefficients between NUPL and future one-year and three-year returns are -0.13 and -0.81 respectively, indicating a more pronounced negative correlation with long-term subsequent returns.
This is also the basis for Fidelity rating a lower NUPL as a positive signal.
However, historical patterns may weaken or fail; judgment still needs to consider broader market conditions.
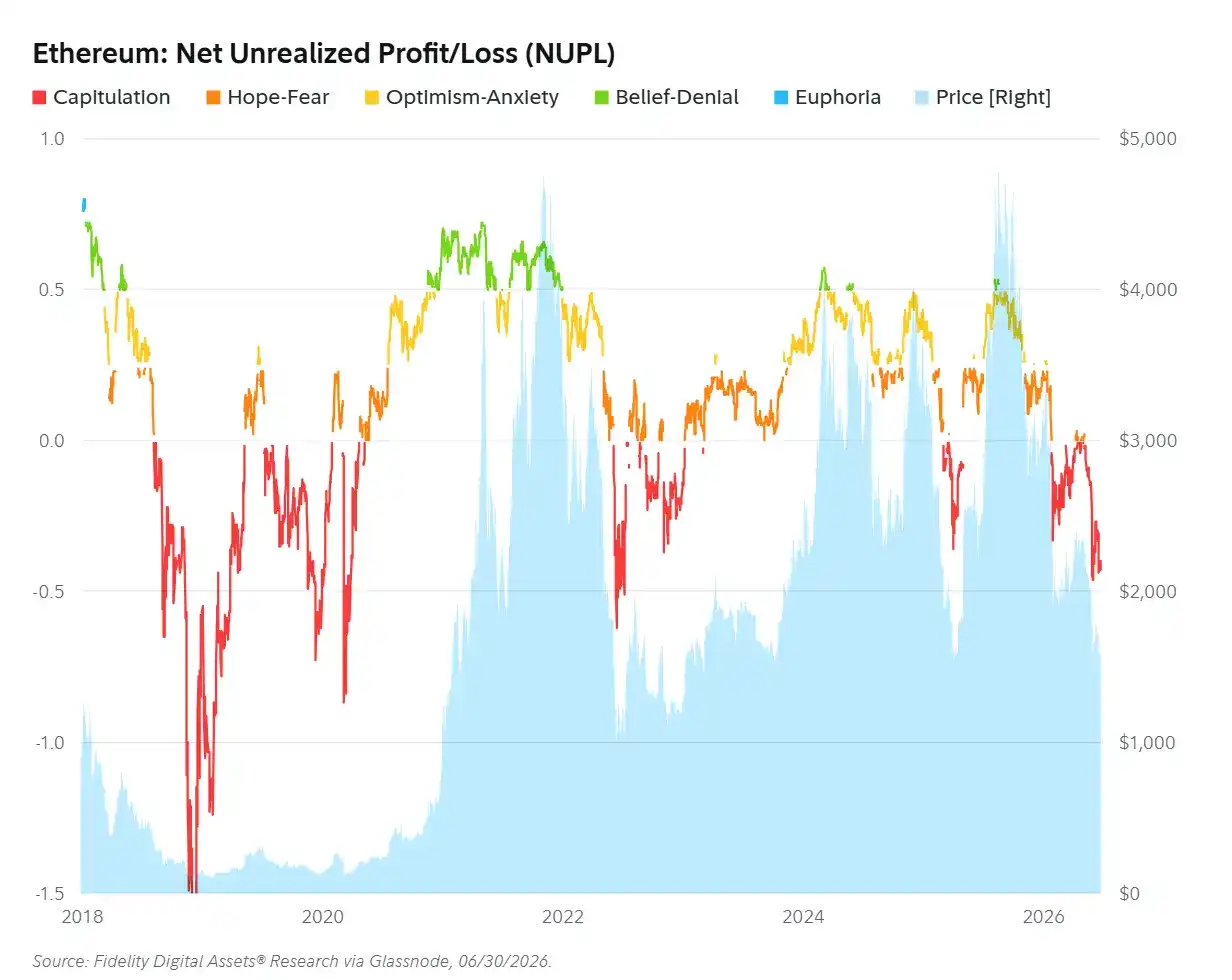
Chart: Ethereum Net Unrealized Profit/Loss (NUPL)
Momentum Signal: Negative
ETH's momentum signal turned positive on April 16, 2026, at a price of $2,350, with both volatility and price momentum above their respective medium-term averages.
But ETH failed to sustain the rally. On May 17, the signal turned negative again as the price retreated to $2,130.
In Q2, ETH fluctuated between $1,564 and $2,422, with particularly volatile action in April and May.
Similar to BTC, ETH's momentum model also produced one false positive this quarter.
Since the signal turned negative on May 17, ETH has fallen another ~25% and remains in a negative momentum zone.
Short-term realized volatility remains around 50% annualized, significantly below the medium-term volatility of 71%.
For the signal to turn positive again, either short-term volatility needs to recover significantly or medium-term volatility needs to decline substantially.
The current indicator reflects synchronized weakness in price and volatility, not that upward momentum has resumed.
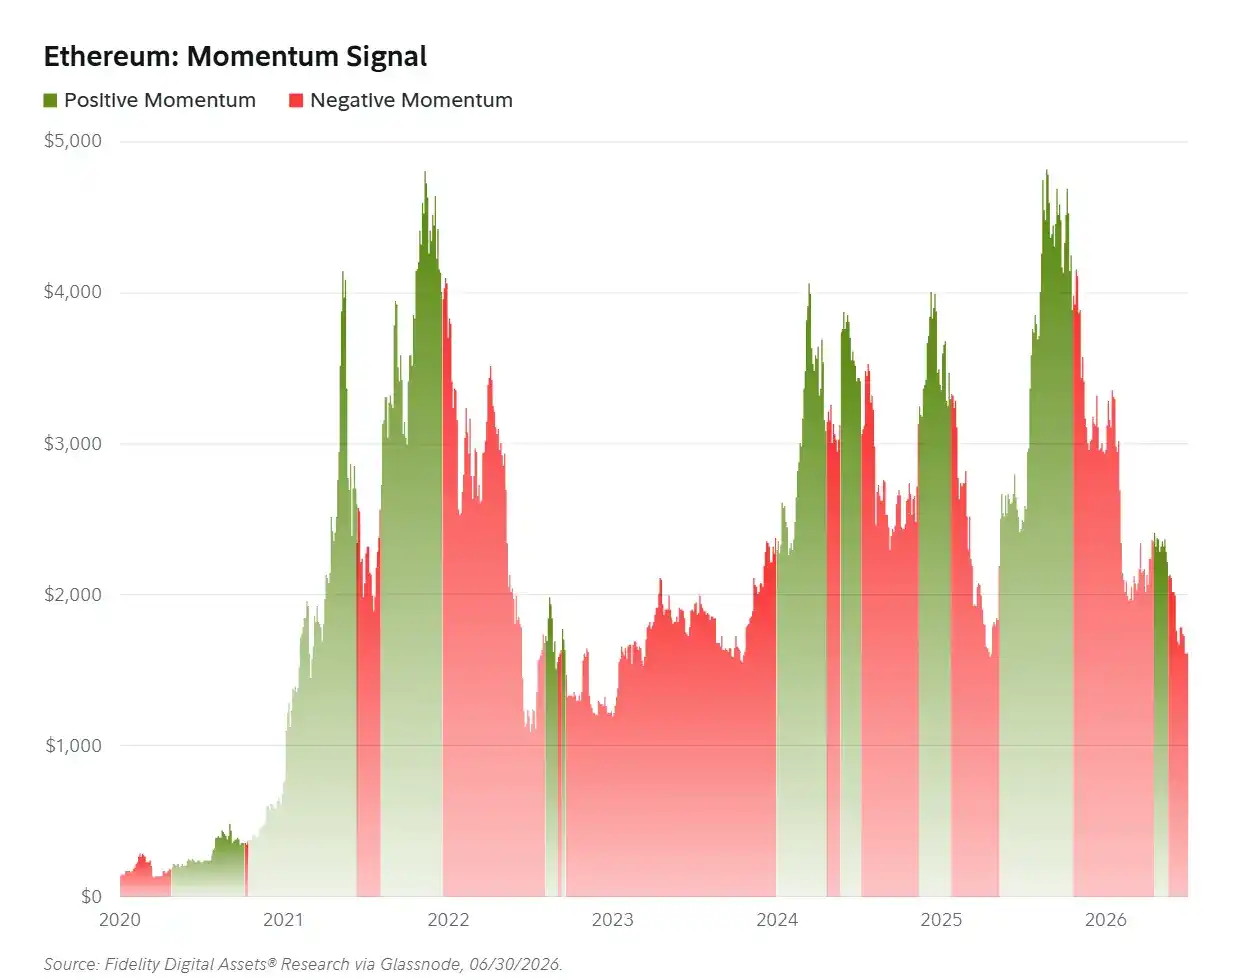
Chart: Ethereum Momentum Signal
Usage Metrics: Neutral
In Q2, fundamental metrics for the Ethereum base layer generally cooled, largely consistent with ETH's continued price decline and falling volatility.
However, total transaction count demonstrated some resilience, declining only 5% quarter-over-quarter, with daily transaction volume consistently above 2 million.
Transaction fees remained far below historical averages but are still sensitive to short-term demand changes.
On April 22, the median Ethereum transaction fee briefly rose to $0.42 before continuously retreating, falling to about $0.02 by quarter-end.
Active addresses and new addresses, after hitting all-time highs last quarter, retreated noticeably, declining 10% and 31% respectively.
Coupled with weak price performance during the quarter, on-chain activity and asset price still maintain a strong correlation.
In Q2, the proportion of addresses with actual economic activity increased slightly, but a considerable portion of addresses still do not materially contribute to Ethereum's revenue or security.
This trend may continue through 2026. The planned Glamsterdam upgrade, focused on increasing base layer capacity, may further increase block space supply when launched.
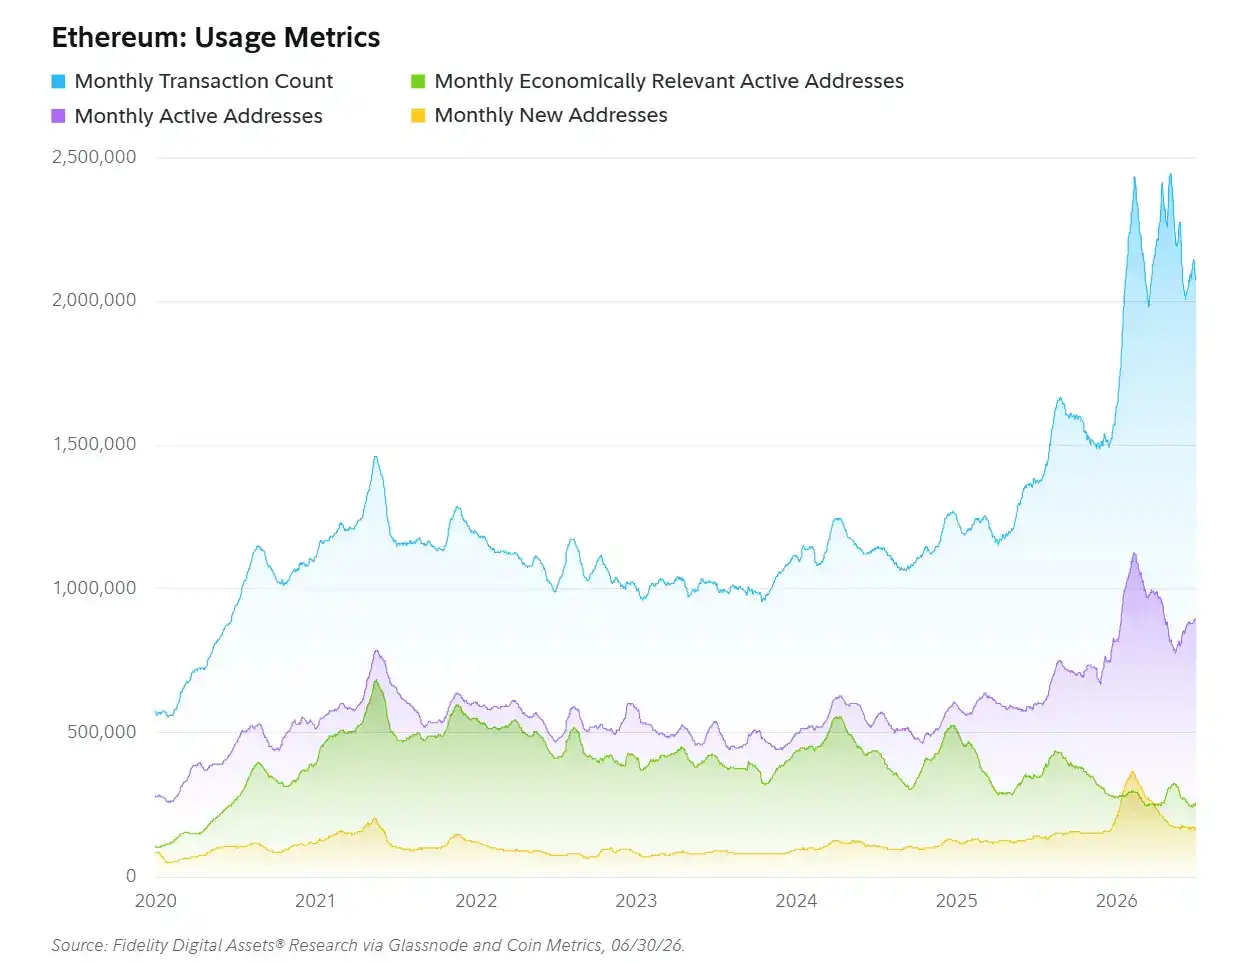
Chart: Ethereum Usage Metrics
Stablecoin Transfer Volume: Positive
Driven by both scaling progress and improving regulatory clarity, stablecoin transfer volume on Ethereum has surpassed historical averages.
Over the past 12 months, total stablecoin transfer volume has continued to reach new highs, exceeding $20 trillion cumulatively.
However, growth rates have shown signs of slowing. Daily average stablecoin transfer volume in June was about 9% lower than the previous three months.
The stablecoin market experienced rapid expansion over the past year, and growth rates may gradually normalize to more stable levels in the coming year.
Notably, stablecoin transfer volume on Ethereum continued to grow against the backdrop of overall digital asset price declines.
This suggests real demand for stablecoins is gradually decoupling from market sentiment and asset prices, being used more for payments, settlements, and accessing on-chain dollars globally, rather than just serving speculative trading.
The average transfer cost for stablecoins has remained below $1 for three consecutive quarters, also validating the practical effects of previous scaling measures.
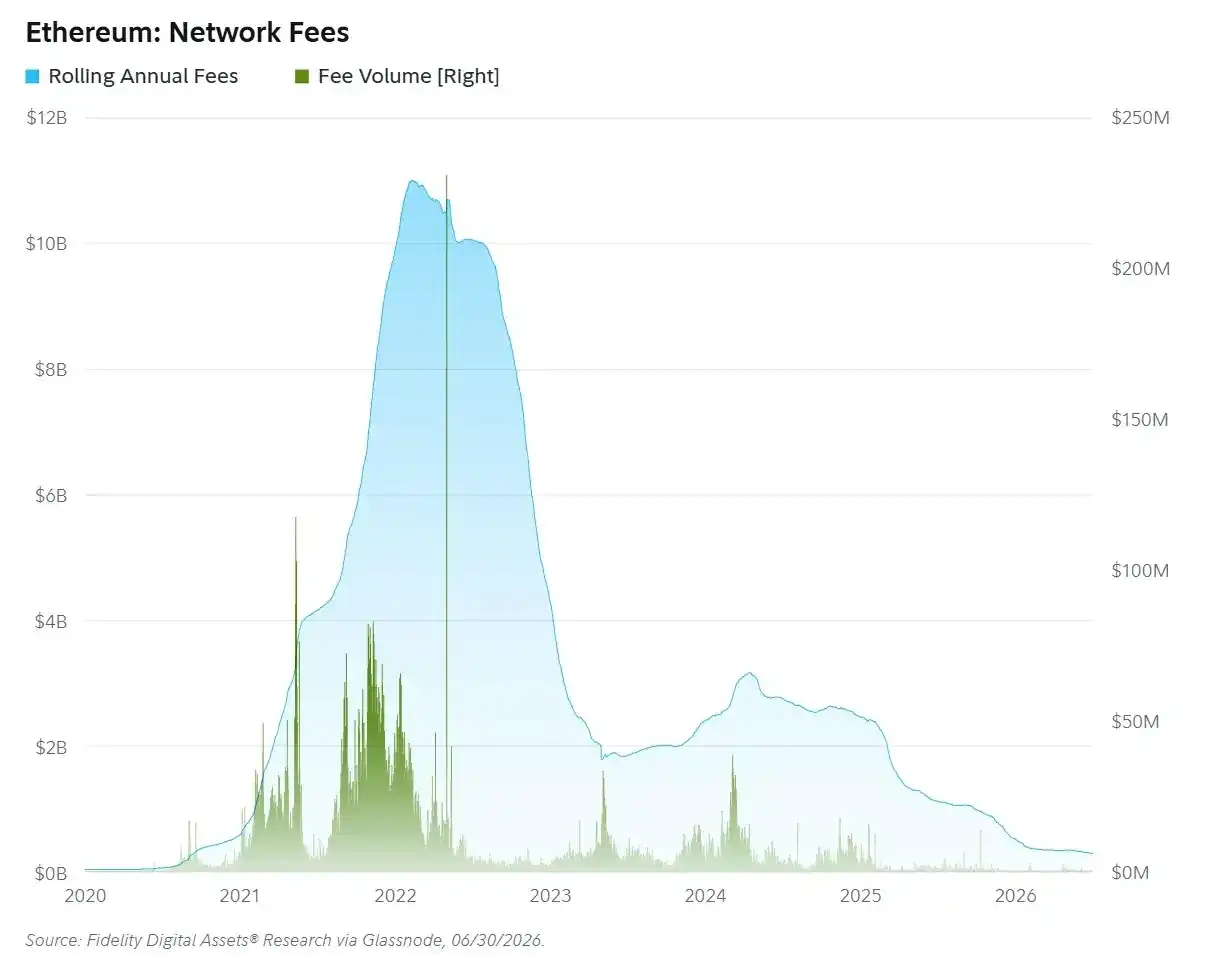
Chart: Ethereum Stablecoin Transfer Volume
Network Fees: Negative
Network fees collected by Ethereum continued to decline over the past year.
In Q2, rolling 12-month network fees dropped from $344 million to $294 million, a 15% decline.
The pace of scaling at the protocol and infrastructure layers continues to outpace block space demand growth. As developers refocus on base layer scaling, this trend may be long-term.
The upcoming Glamsterdam upgrade is expected to further increase block space capacity, so Ethereum network fees may remain under downward pressure in the coming year.
Ethereum's fee levels themselves are highly volatile, making it difficult to determine a reliable long-term equilibrium.
In Q2, Ethereum's daily network fees fluctuated between $145,000 and $2.75 million, averaging about $575,000 per day.
One key signal investors need to monitor in the coming years is how core developers balance network growth with value capture.
As a technology platform still in development, Ethereum has historically emphasized user adoption, ecosystem expansion, and network utility over short-term revenue.
Unless developers and researchers devote more effort to improving value capture mechanisms, network fees and protocol revenue may continue to face pressure.
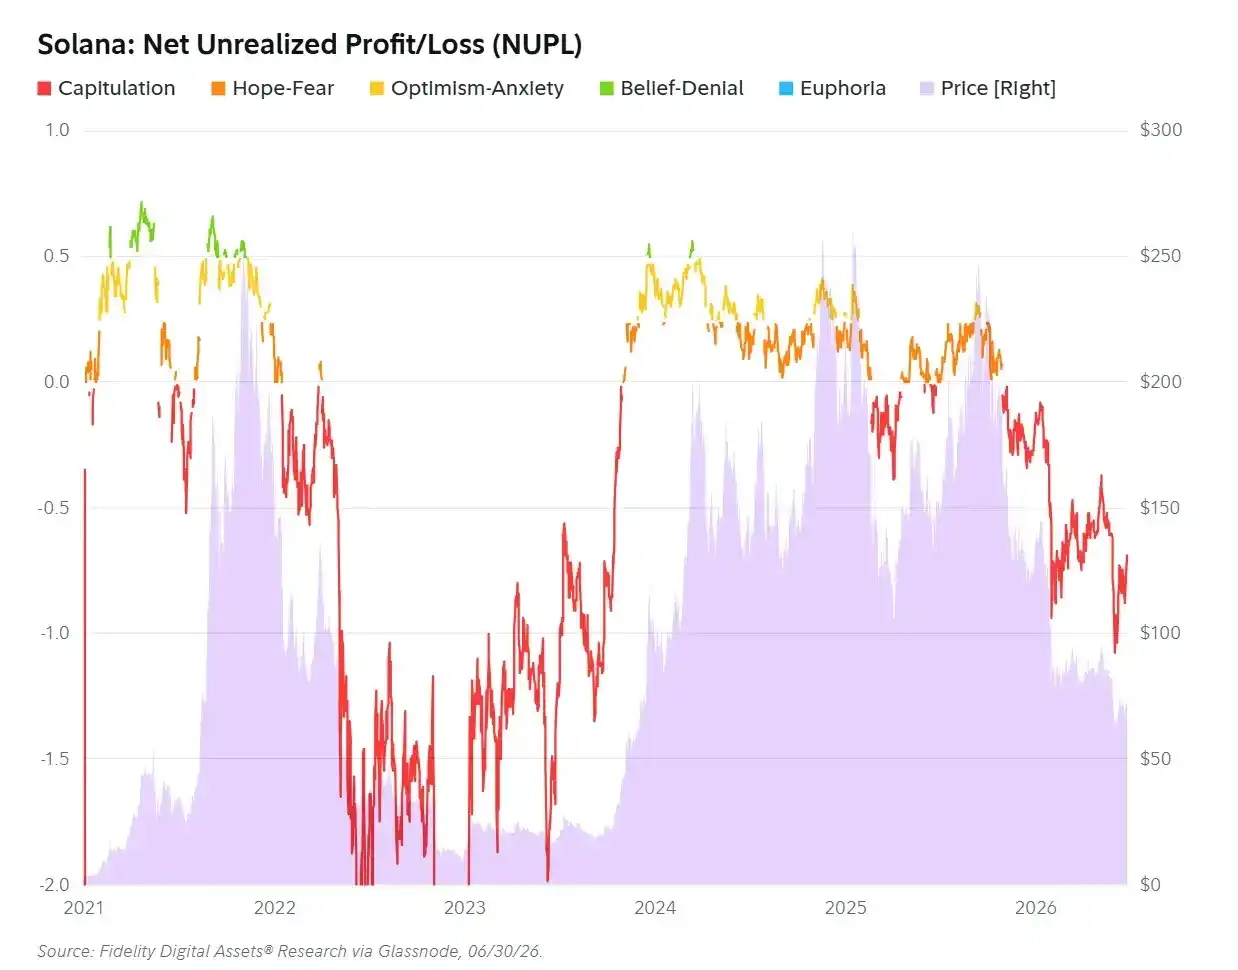
Chart: Ethereum Network Fees
IV. Solana
NUPL -0.72: Positive
In Q2, SOL's NUPL remained within the "Capitulation" zone throughout.
During the quarter, SOL price fell 12%, and NUPL dropped from -0.67 to -0.72, a decline of 0.05, further expanding unrealized losses.
Based on current data, SOL is trading about 41% below the network's aggregate cost basis, with total unrealized losses around $29 billion.
On June 6, SOL's NUPL rebounded sharply from a cyclical low of -1.08, again demonstrating SOL's high volatility characteristic in this bear market.
The recovery from the low may mean a significant portion of early holders have sold their positions, while new investors are taking over at lower prices.
Historically, occurrences of SOL's NUPL falling within a range of +/- 0.05 around -0.72 are very rare, but subsequent market performance has been strong.
Since the Solana network's inception, similar readings have occurred 21 times. The corresponding median future one-year return is 542%.
Due to insufficiently long historical data, reliable three-year returns cannot be calculated at this time.
The correlation between SOL's current NUPL and future one-year returns is -0.56, a relatively strong negative correlation.
But Solana's operating history is short, with a limited sample size; this historical relationship must be viewed cautiously and may not repeat in the future.
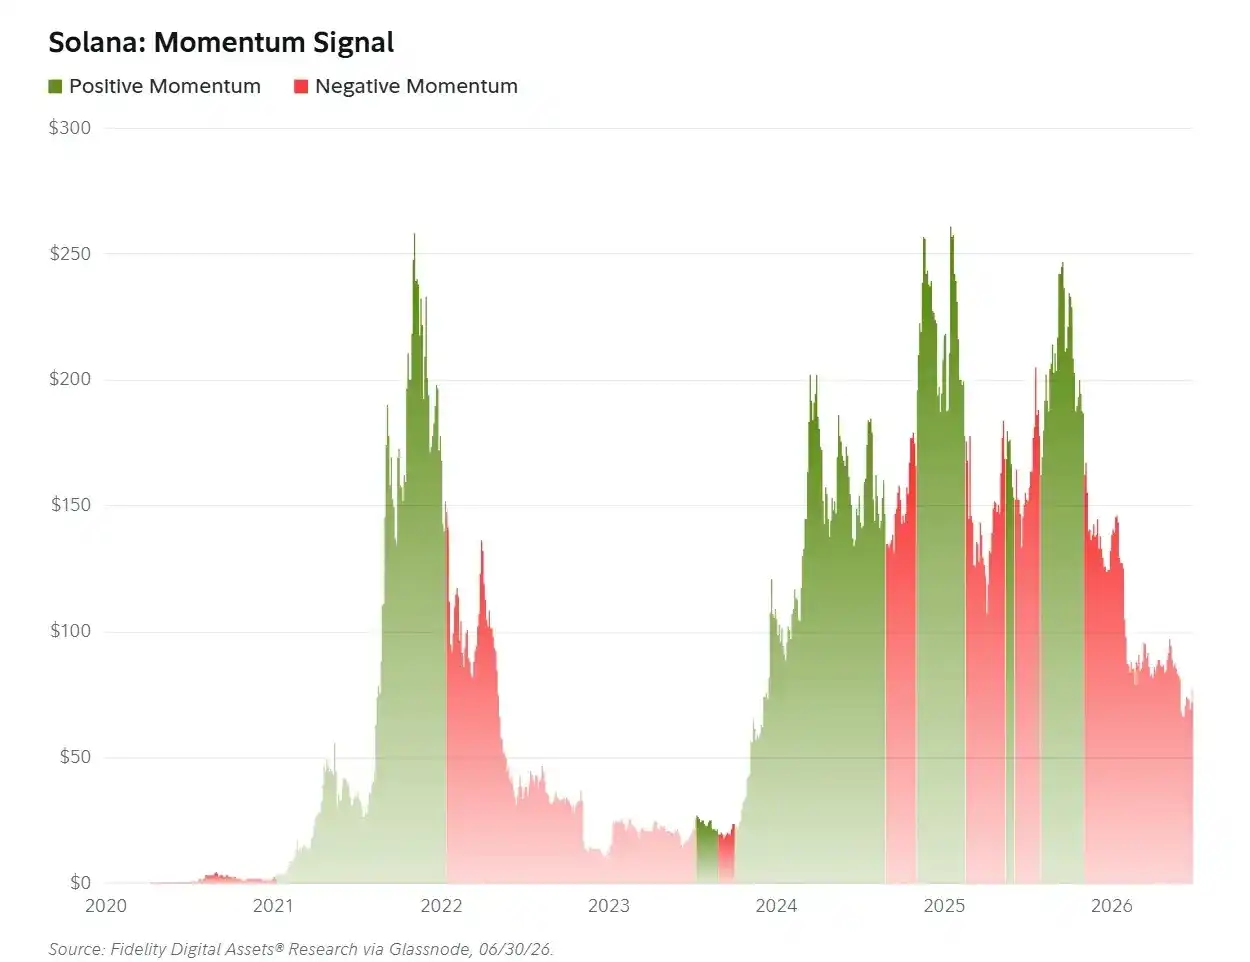
Chart: Solana Net Unrealized Profit/Loss (NUPL)
Momentum Signal: Negative
SOL's momentum signal has been negative since October 28, 2025, with price and volatility trending downward overall, indicating a still cautious market environment.
However, recently SOL's short-term realized volatility has risen above its medium-term volatility, at about 63.5% and 61% annualized respectively.
Historically, this state sometimes precedes or accompanies momentum reversals. If price can strengthen in sync, it would provide more substantial support for forming a cyclical bottom.
Notably, SOL did not experience a false positive in its momentum signal like BTC and ETH did this quarter.
For most of Q2, SOL fluctuated between $63 and $97, starting the quarter around $81.
According to SOL's own model parameters, even when the price briefly rose to $97, momentum was insufficient to turn the signal positive, and prices subsequently made a lower low.
When the signal first turned negative on October 28, 2025, SOL's price was around $194. Since then, the price has fallen about 60%, and the adjustment is not yet fully over.
The current indicator is closer to "attempting to stabilize" rather than upward momentum having resumed.
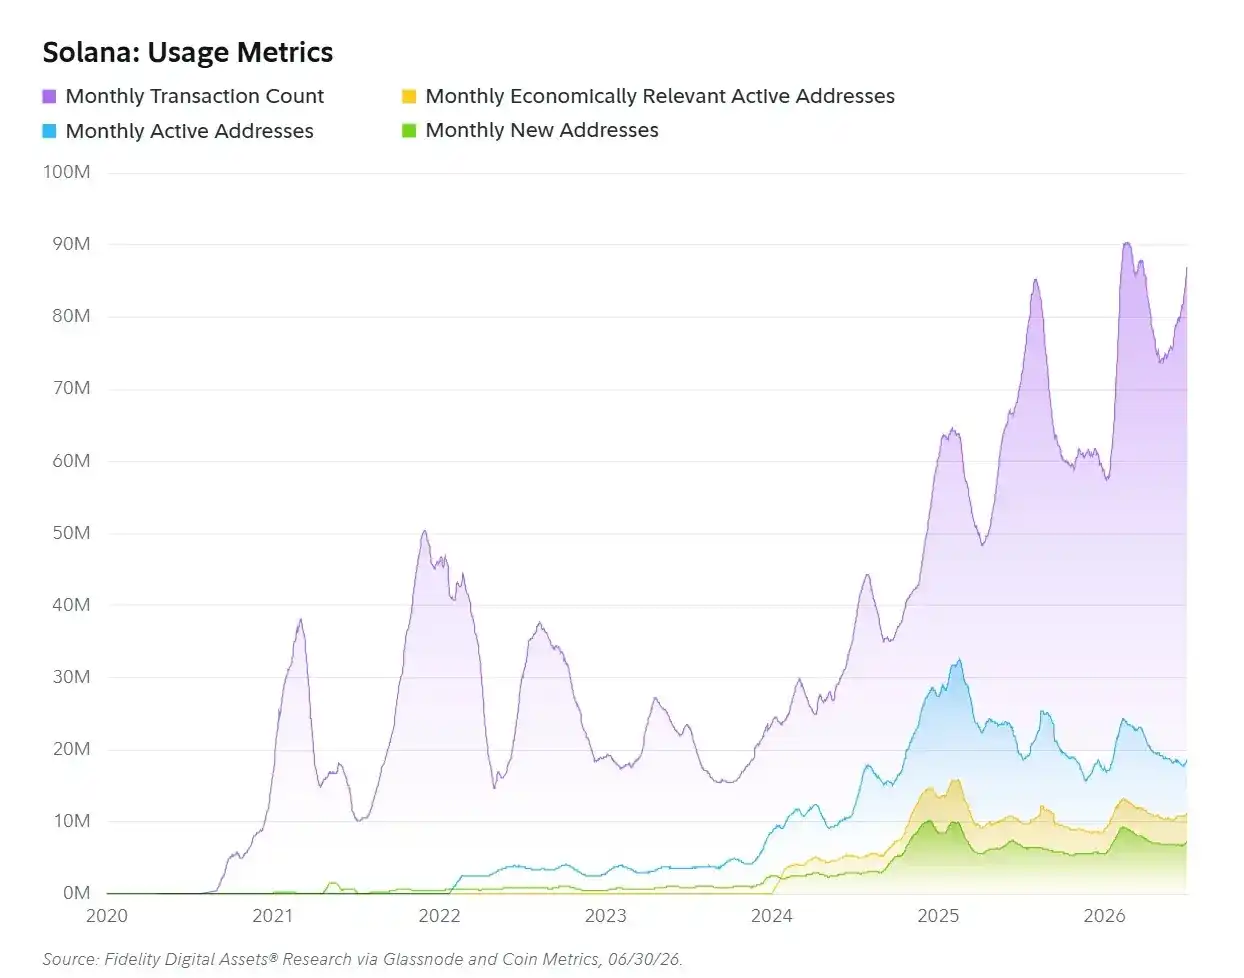
Chart: Solana Momentum Signal
Usage Metrics: Positive
Despite being in a bear market, Solana's fundamentals demonstrate strong resilience. Asset prices continued to weaken, but on-chain activity demand did not contract in sync.
Monthly transaction count continued to rise, increasing 1% quarter-over-quarter in Q2, still on track to set a new historical high.
However, user growth is slower than network activity growth, meaning the average number of transactions initiated per user is increasing.
In Q2, monthly active addresses and new addresses declined 15% and 7% respectively, while addresses with actual economic activity declined only 4%.
In the current market environment, economically meaningful on-chain activity remains relatively stable, contrasting somewhat with Ethereum's trend.
Another advantage for Solana is stable transaction costs.
Throughout the quarter, Solana's median transaction fee remained below 0.1 cents, with minimal fluctuation, providing strong cost predictability for users and investors.
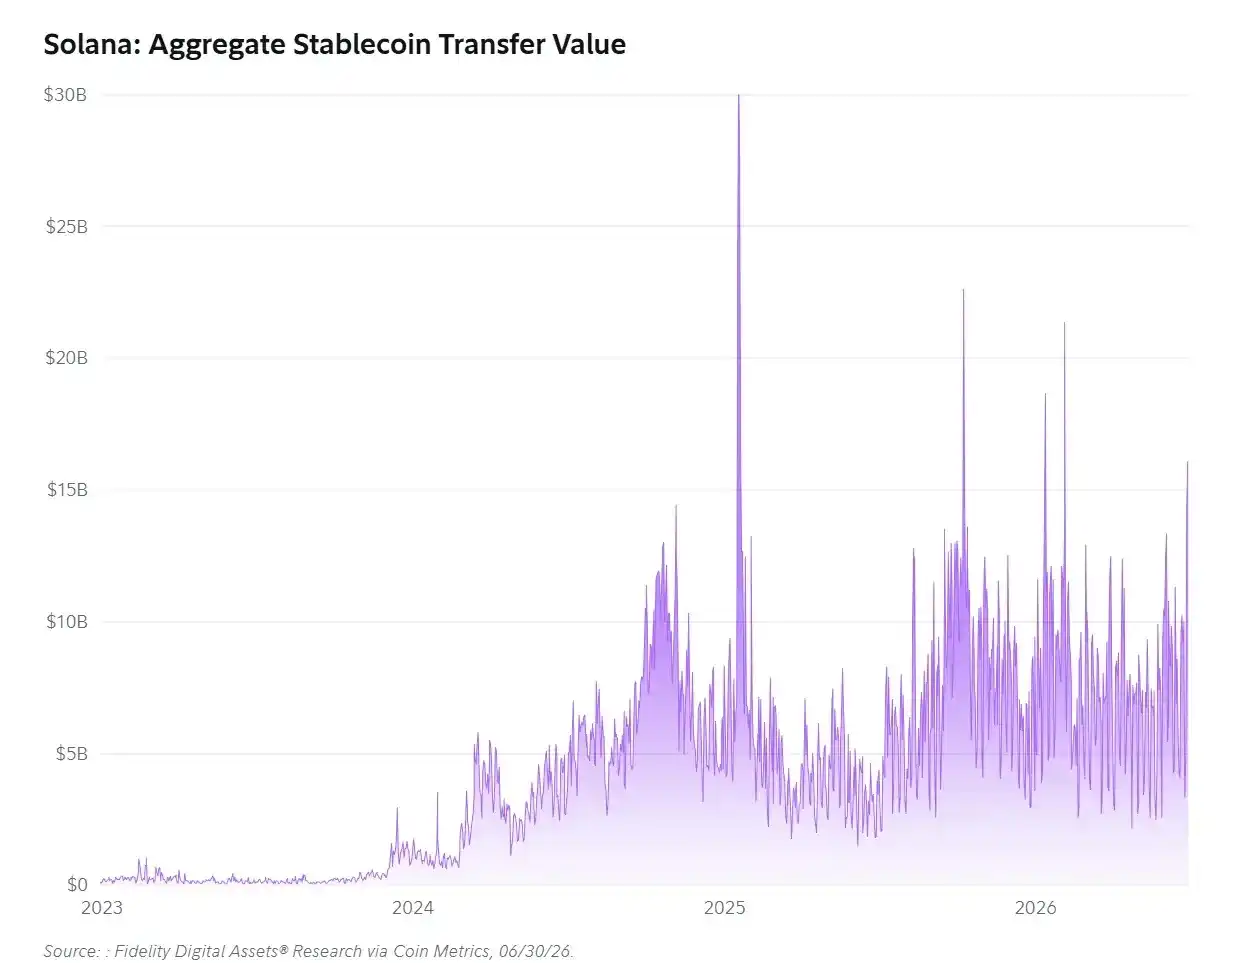
Chart: Solana Usage Metrics
Stablecoin Transfer Volume: Positive
Stablecoin transfer volume on Solana has historically been volatile, but since its significant growth over a year ago, the long-term upward trend remains intact.
Currently, Solana's daily average stablecoin transfer volume is stable above $8.4 billion, a 17% increase quarter-over-quarter.
Compared to Ethereum, the average stablecoin transfer size on Solana is smaller, reflecting differences in user composition and use cases between the two networks.
Over the past 12 months, Solana processed over $2.6 trillion in stablecoin transfers cumulatively.
While SOL prices fell sharply, stablecoin transaction volume and other on-chain activities remained stable.
Similar to Ethereum, a significant portion of stablecoin demand on Solana has strong stickiness, with little relation to short-term market sentiment changes.
If on-chain activity continues to grow, Solana's stablecoin ecosystem is also poised to expand in sync.
In Q2, the overall stablecoin market size shrank about 1.3%, but stablecoin supply on Solana actually grew about 3%, adding approximately $300 million.
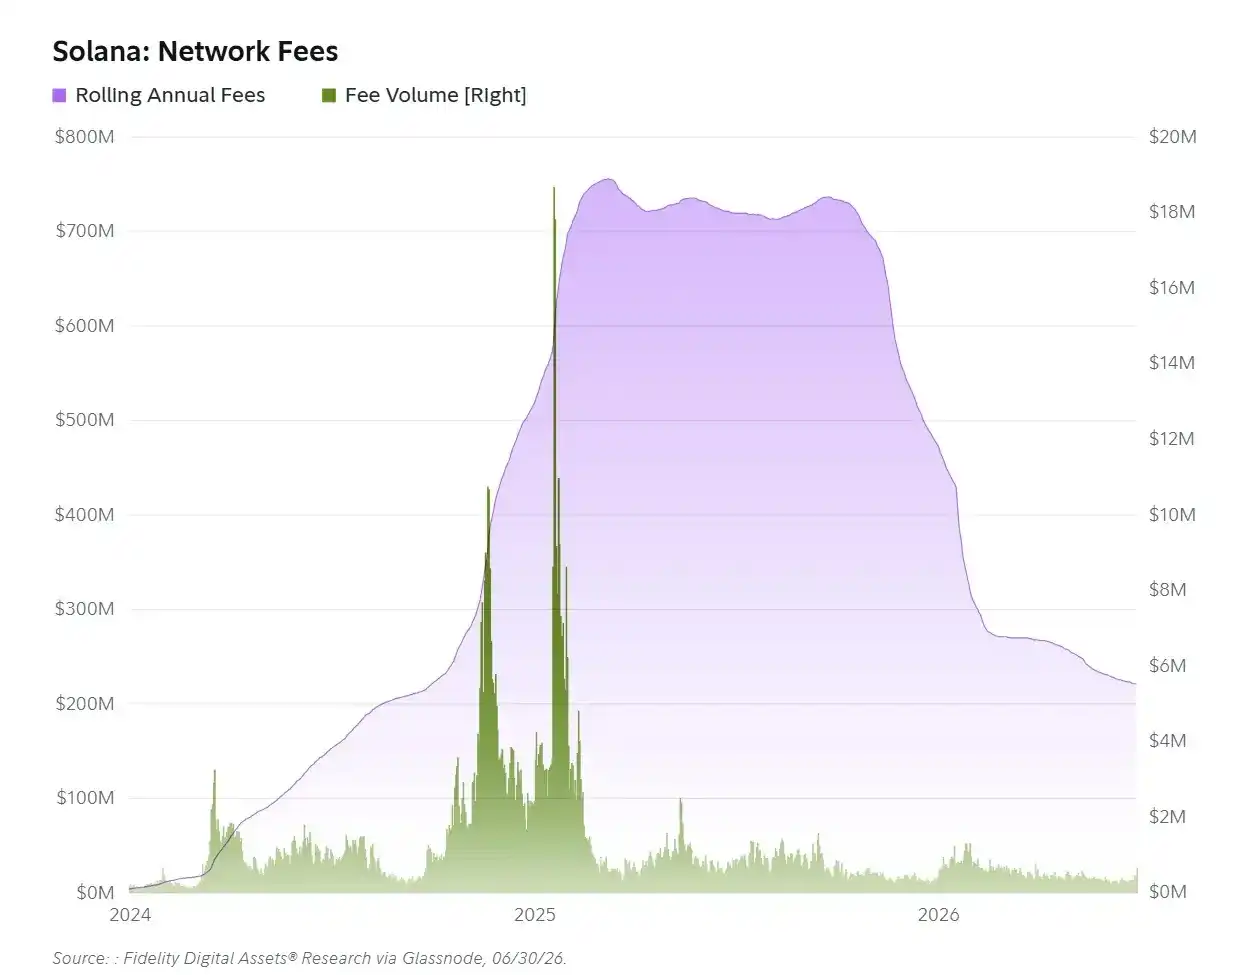
Chart: Solana Stablecoin Transfer Volume
Network Fees: Neutral
Solana's network fees remain in a downtrend but are showing signs of gradually finding an equilibrium level.
In Q2, rolling 12-month network fees declined 18% to $221 million, with daily average fee revenue around $390,000.
If Q2 network fees are annualized, the yearly revenue would be about $141 million, the gap with the rolling 12-month data having narrowed significantly.
Meanwhile, Solana's on-chain activity is still growing, and several Solana Improvement Proposals (SIMDs) are beginning to place greater emphasis on enhancing value capture for SOL holders.
These developments further reinforce Solana's positioning as a technology platform capable of generating protocol revenue, with SOL at the core of its economic system.
According to Fidelity's assessment, Solana's network fee revenue may be nearing a cyclical bottom.
If on-chain activity continues to grow while value-capture-related proposals are gradually implemented, Solana's fee revenue could begin recovering in the coming year.
Appendix: Indicator Methodology Notes
Momentum Signal
The Momentum Signal assesses the current momentum state of a digital asset by comprehensively evaluating price trend and volatility changes.
The model compares short-term price changes against long-term trends on one hand, and judges whether current volatility is expanding or contracting relative to a recent baseline on the other.
These two dimensions are integrated into a momentum classification used to identify phases where price and volatility direction are aligned, diverging, or transitioning.
The lookback windows and other parameters are selected through an optimization process aimed at creating relatively clear, stable distinctions between different market states.
However, this indicator is only used to describe current market conditions and does not constitute price prediction, investment advice, or trading signals.
Yardstick
The Bitcoin Yardstick, also known as the "Hash Rate Yardstick," can be roughly understood as a price-to-earnings ratio for the Bitcoin network.
Traditional P/E ratios divide stock price or company market cap by corporate earnings, while the Yardstick divides BTC's total market cap by the network's total hash rate, measuring BTC's market value relative to the level of security investment in the network.
A lower ratio means BTC is cheaper relative to the hash rate required to protect the network, similar to how a lower P/E is often interpreted as lower stock valuation.
However, hash rate is not equivalent to corporate earnings, so the Yardstick can only serve as a relative valuation framework and cannot be directly equated with stock P/E ratios.
NUPL
On one-year and three-year time scales, the relationship between NUPL and future returns is one of the stronger on-chain indicator relationships in Fidelity's research.
However, Ethereum and Solana have significantly shorter network histories than Bitcoin, with fewer available observation samples, so the reliability of historical relationships is relatively lower.
Theoretically, when a network's realized capitalization exceeds twice its total market cap, NUPL can fall below -1.0.
In the early days of BTC, ETH, and SOL, a significant portion of the supply was moved or allocated when no public market price existed.
For example, some early BTC was transferred before market prices formed; ETH and SOL had early token distributions, pre-sales, pre-mining, seed rounds, and foundation allocations.
These early allocations affect the realized price, sometimes being recorded at costs higher than subsequent public market prices.
When market price falls below realized price, the network's cumulative unrealized losses can exceed the current total market cap, pushing NUPL below -1.0.
As networks mature and on-chain transaction history accumulates, realized capitalization will increasingly reflect actual market transactions rather than early distribution events.
Therefore, the reference value of NUPL typically increases as a network matures.




















