LeCun Continuously Endorses, New Work VISReg Tackles the Core Challenge of 'Representation Collapse' in JEPA World Models

marsbitPublié le 2026-07-28Dernière mise à jour le 2026-07-28

Résumé

"VISReg: A New Self-Supervised Learning Method Tackles Representation Collapse in JEPA World Models" Yann LeCun has highlighted the new self-supervised learning (SSL) work VISReg (Variance-Invariance-Sketching Regularization), which addresses the core challenge of "representation collapse" in JEPA-based world models. SSL often collapses, mapping different inputs to similar vectors, losing discriminative power. While methods like VICReg and SIGReg attempted to regularize the representation distribution, they suffered from issues like vanishing gradients during collapse or coupled scale and shape optimization. VISReg overcomes these by decoupling the regularization into independent "scale" and "shape" objectives. It uses a variance term to prevent amplitude collapse (providing constant gradient even during collapse) and a sliced Wasserstein distance (SWD) based sketching target with stop-gradient to align the distribution shape to an isotropic Gaussian, without interfering with scale. This approach, requiring only ~15 lines of PyTorch core code, offers linear computational complexity and scales efficiently across multiple GPUs. Evaluated across 15 datasets (in-domain, out-of-distribution/OOD, dense prediction), VISReg outperforms 7 mainstream SSL methods (MoCoV3, DINO, iBOT, I-JEPA, MAE, data2vec) without relying on heuristic tricks like EMA or stop-gradient. Key results include: superior average OOD accuracy; matching DINOv2's OOD performance using only ~1/10 of the data (I...

The foundation of JEPA world models is Self-Supervised Learning (SSL), advocated by Yann LeCun since 2017.

SSL can learn general representations from massive amounts of data without manual annotation, but it commonly faces a core challenge—representation collapse: the model tends to map different inputs to the same or very few vectors, seemingly completing training without actually learning discriminative representations.

To suppress collapse, mainstream methods mostly rely on a series of heuristic techniques (EMA, teacher-student networks, stop-gradient, freezing layers, etc.). These techniques make training fragile, difficult to tune, and also weaken the method's interpretability and scalability.

Another approach is to directly constrain the representation distribution through regularization terms.

VICReg, proposed by LeCun's team, decomposes the learning objective into three terms: variance, invariance, and covariance, using covariance to constrain correlations between dimensions; but covariance only captures second-order statistics, unable to distinguish between two representations with "the same mean and variance, but drastically different distribution shapes."

Subsequently proposed SIGReg, based on the Cramér–Wold theorem, aligns the entire embedding distribution to a standard Gaussian using sketching techniques, thereby constraining the complete distribution shape.

However, SIGReg still has two key flaws:

  • Gradient Vanishing upon Collapse: When representations start to collapse, SIGReg's gradient decays accordingly—the more severe the collapse, the weaker the correction signal, making it difficult for the model to recover on its own;
  • Coupling of Scale and Shape: It does not separate the two independent attributes of "magnitude (scale)" and "distribution morphology (shape)". They interfere with each other during optimization, leading to poor adaptability on long-tailed, low-quality, low-rank data.

In other words, when the model most needs gradient signals to escape the collapsed state, SIGReg's gradient tends to vanish.

This is precisely the core problem that VISReg aims to solve.

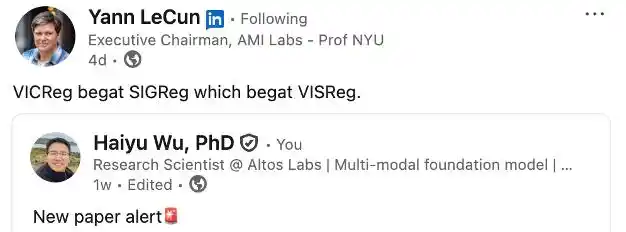
Recently, the new SSL work VISReg (Variance-Invariance-Sketching Regularization) has been continuously endorsed and highly recognized by Turing Award winner Yann LeCun—he commented on the repost, "VICReg begat SIGReg which begat VISReg," succinctly outlining the technical lineage of this regularization route.
To gain such recognition from LeCun, what makes VISReg so strong?

The answer lies in the fact that it precisely targets the core challenge of JEPA world models that LeCun has long bet on—representation collapse.

Paper Link: https://arxiv.org/abs/2606.02572

Code / Pre-trained Weights: https://github.com/HaiyuWu/visreg

Project Page: https://haiyuwu.github.io/visreg/

VISReg decouples the collapse-preventing regularization term into two independent objectives: "scale" and "shape." Without relying on any heuristic training tricks or massive data, it outperforms 7 mainstream SSL methods on a comprehensive evaluation across 15 datasets; using only about 1/10 of the training data, it matches DINOv2 on out-of-distribution (OOD) benchmarks.
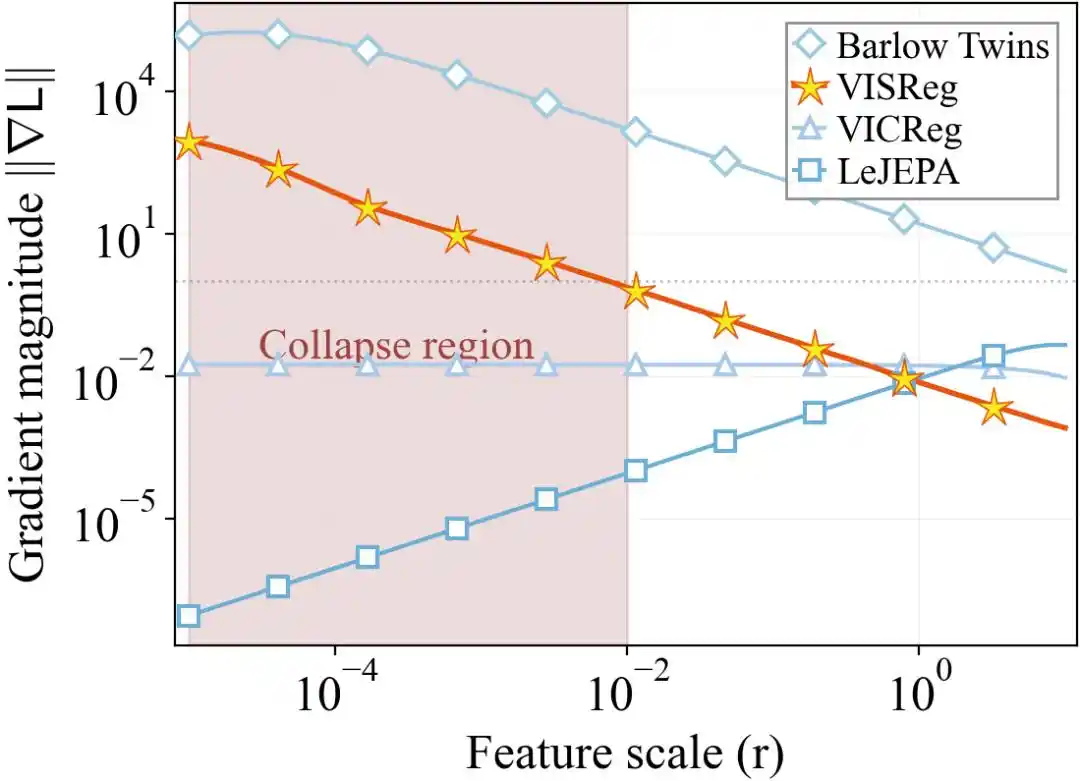
Figure 2: Simulation of gradient magnitude ‖∇L‖ for different regularization methods at various stages of representation collapse. VISReg maintains strong gradients even in collapsed states, while SIGReg's gradient almost vanishes.

Core Method

VISReg combines the strengths of VICReg and SIGReg: it retains VICReg's variance term to control scale, while replacing the covariance term with a sketching objective based on Sliced Wasserstein Distance (SWD) to control shape, and completely decouples the two via stop-gradient. The entire regularization objective consists of three parts.

1. Scale Regularization

The first part constrains the variance of each dimension to prevent amplitude collapse:
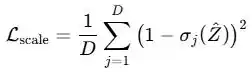
Its key property is: when the model collapses, the gradient of this term approaches a constant, ensuring the model can recover stably—this exactly compensates for SIGReg's gradient vanishing flaw.

2. Shape Regularization

The second part first normalizes to eliminate scale influence, then constrains shape separately. The crucial step is normalization with "stop-gradient" (sg):
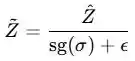
Here, stop-gradient is applied to the standard deviation σ, ensuring that optimizing the shape loss does not conversely alter the scale—this is the mechanism enabling true decoupling and non-interference between the "scale" and "shape" objectives.

After normalization, the geometric shape of the distribution is aligned to an isotropic Gaussian using the Sliced Wasserstein Distance:
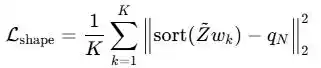
where

is the standard Gaussian quantile, and

is the random projection direction (i.e., "slice / sketching").

The theoretical basis is the Cramér–Wold theorem (Lemma 3.1 in the paper): two distributions are equal if and only if all their one-dimensional projections along directions on the unit sphere are equal. Therefore, by slicing the high-dimensional representation along sufficiently many random one-dimensional directions and aligning each to a Gaussian, we equivalently align the entire distribution in the high-dimensional space—this allows us to characterize the complete distribution shape using cheap one-dimensional sorting operations, rather than just second-order statistics.

3. Combined Objective

The third part is a centering loss that pulls the batch mean μ towards the origin:
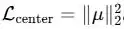
The three regularization terms are combined with weights:

The predictive loss follows the invariance objective of JEPA / LeJEPA—aligning embeddings from each view (global + local, total V views)

to the mean of the global view

:
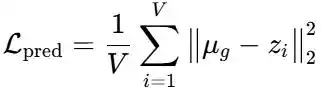
Finally, a single hyperparameter λ balances prediction and regularization, yielding the full objective:

Comparison with VICReg: VICReg also decouples regularization into variance + covariance, but covariance only captures second-order statistics; VISReg uses a sketching objective based on Sliced Wasserstein to fully characterize the distribution shape while retaining the variance term for scale control—preserving VICReg's flexibility while gaining distribution-level rigor.

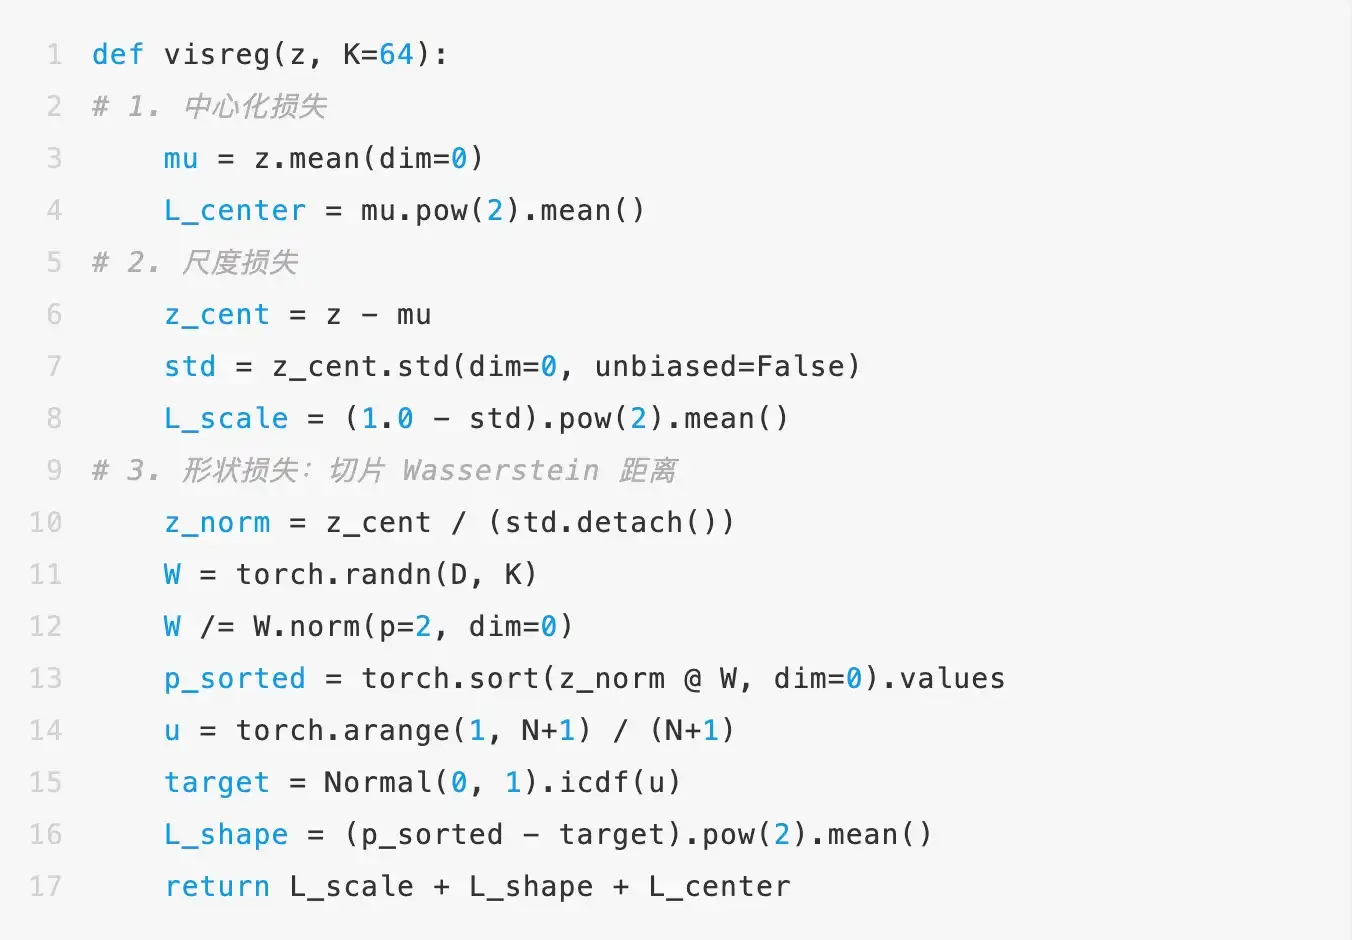
Requires Only About 15 Lines of PyTorch Code

This regularization objective is very lightweight to implement; the core logic takes only about 15 lines:
Computational Complexity and Scalability

In terms of computation and scalability, VISReg also has advantages. The computational complexity of its regularization part is
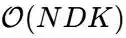
(N is batch size, D is dimension, K is number of slices), which is linear for all scaling factors; in contrast, VICReg's covariance term is
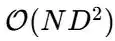
, scaling quadratically with dimension.

Under the same batch size, VISReg's runtime speed and GPU memory usage on a single H100 GPU are superior to SIGReg.

More importantly, the K random slices can be distributed across multiple GPUs: each of M GPUs generates K/M slices, achieving an effect equivalent to a single GPU generating all K slices.

In experiments, when the number of slices per GPU was insufficient, switching to 8 GPUs, each with 128 slices (total 1024), reduced the accuracy gap with "single GPU 1024 slices" from about 2.4% to 0.22%. This means that K can remain constant when scaling up training, adding almost no per-GPU burden.
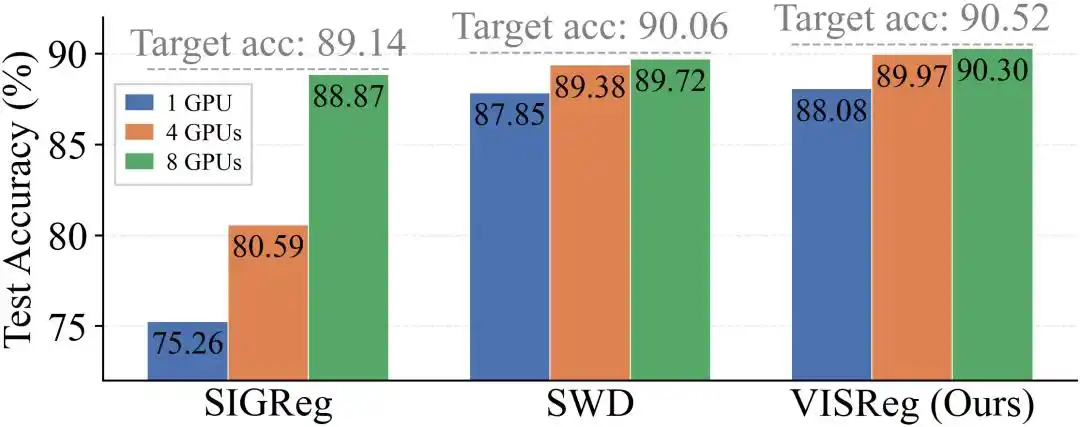
Figure: Change in linear probing accuracy when increasing GPU count with fixed K and D. When K is insufficient (K = 1⁄4D), using 8 times the number of GPUs can raise accuracy to the level of K = 2D—making it possible to keep K constant during large-scale training.

Experimental Results

Back to the question in the title—where exactly is VISReg strong? The research team compared VISReg with 7 mainstream SSL methods—MoCoV3, DINO, iBOT, I-JEPA, MAE, data2vec—on 15 datasets (8 in-domain + 6 out-of-distribution + ADE20K dense prediction), covering domains such as astronomy, medical, remote sensing, texture, flowers, etc. The answer manifests across multiple dimensions from recognition to segmentation and generation.

1. In-Domain Linear Probing

To ensure a fair comparison, experiments are divided into two groups based on whether heuristic techniques are used. In the group not using any heuristic techniques, VISReg leads: ViT-B/16 achieves in-domain linear probing accuracy of 75.7%, higher than MAE (75.1%); ViT-L/14 further improves to 77.0%, higher than LeJEPA (75.6%). Compared to iBOT and DINO which use heuristic techniques, VISReg is only slightly lower on conventional datasets, but surpasses all methods on the texture dataset DTD—indicating its cross-domain generalization ability stems from the method itself, not stacking manual tricks.

2. Out-of-Distribution (OOD) Generalization: Comprehensive Superiority

OOD generalization is a stricter test than in-domain accuracy: methods relying on heuristics are often finely tuned on the ImageNet in-domain but may not transfer well to significantly different new distributions. The team evaluated on 6 OOD datasets covering medical (ChestXRay, RetinaMNIST, OrganAMNIST), astronomy (Galaxy10), remote sensing (AID), texture (DTD), which are completely unrelated to the ImageNet training domain. Results show VISReg achieved the best average OOD accuracy across all methods and all backbone sizes, even surpassing some methods using heuristic techniques with larger backbones.
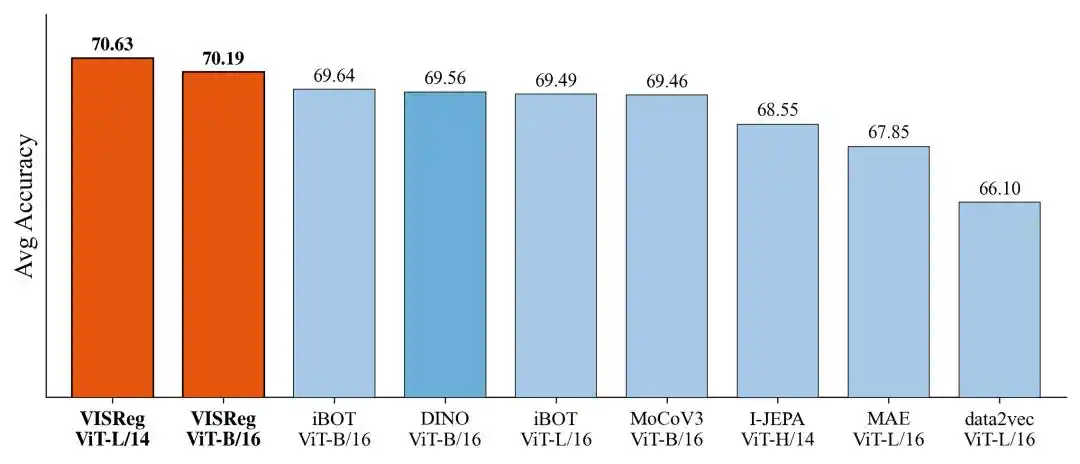
Figure 4: Average OOD linear probing accuracy. VISReg comprehensively outperforms iBOT, DINO, MoCoV3, I-JEPA, MAE, data2vec, etc.

As shown in Figure 4, ViT-B/16 VISReg average OOD accuracy is 70.19%, ViT-L/14 is 70.63%, significantly higher than MAE (67.85%), and better than MoCoV3 (69.46%), DINO (69.56%), I-JEPA (68.55%), etc.

3. Data Efficiency: Matching DINOv2 with 1/10 the Data

After pre-training VISReg (ViT-L/14) on ImageNet-22K (~14 million images), its average accuracy on 6 OOD datasets reaches 72.94%, essentially on par with DINOv2 (72.93%) trained on 10x larger scale LVD-142M (142 million images). In other words, VISReg achieves comparable performance using about 1/10 of the data. (As a control, VISReg with ViT-L/14 pre-trained only on ImageNet-1K has an average accuracy of 70.63%.) This indicates its learned representations have strong generality.
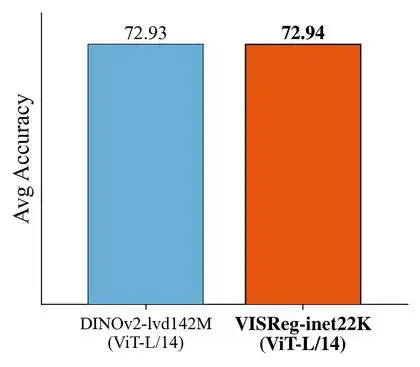
Figure 5: VISReg pre-trained on ImageNet-22K matches DINOv2 trained on 10x more data (LVD-142M) on OOD benchmarks.

4. Transfer Fine-tuning: Comprehensively Surpassing DINO

Although VISReg's linear probing accuracy on some in-domain datasets is slightly lower than DINO, after fine-tuning, it surpasses both DINO and supervised pre-training on all five tested datasets—CIFAR-10, CIFAR-100, Flowers, ImageNet-1K, Galaxy10—indicating its representation distribution is more uniform, less redundant, and more transferable.
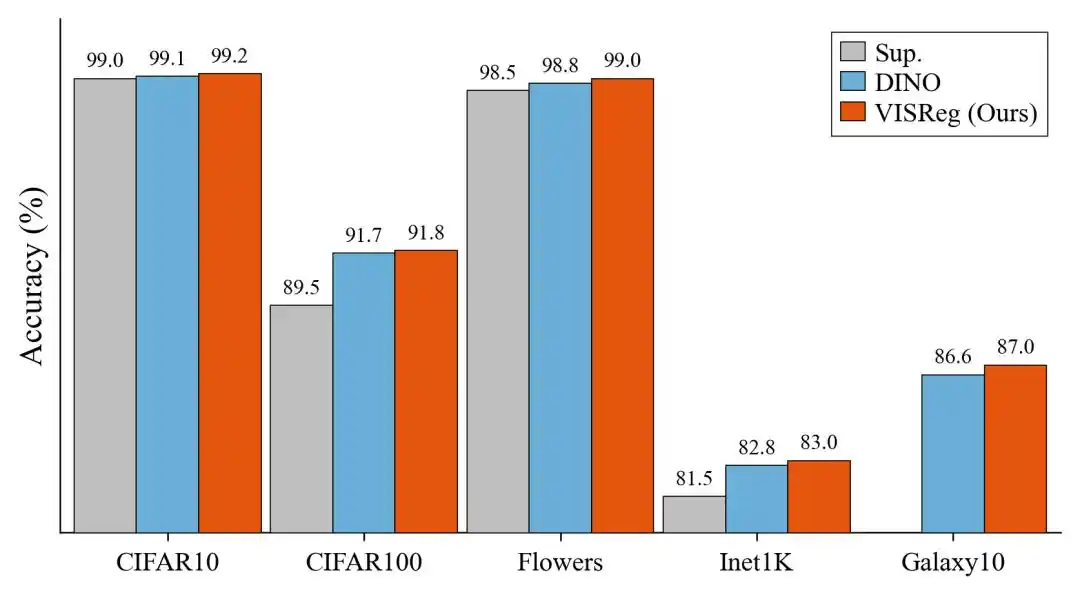
Figure: Transfer learning comparison. After fine-tuning, VISReg outperforms DINO and supervised pre-training on all tested datasets (CIFAR-10, CIFAR-100, Flowers, ImageNet-1K, Galaxy10).

5. Dense Prediction and Generation Guidance

VISReg's advantages are not limited to classification. On ADE20K linear semantic segmentation (ViT-B/16), its mIoU is 30.16, higher than DINO (29.40) and MAE (23.60), second only to MoCoV3 (31.69); this result is competitive without using any heuristic tricks. The paper also acknowledges that there is still a gap with the best methods in dense prediction, a focus for future optimization.
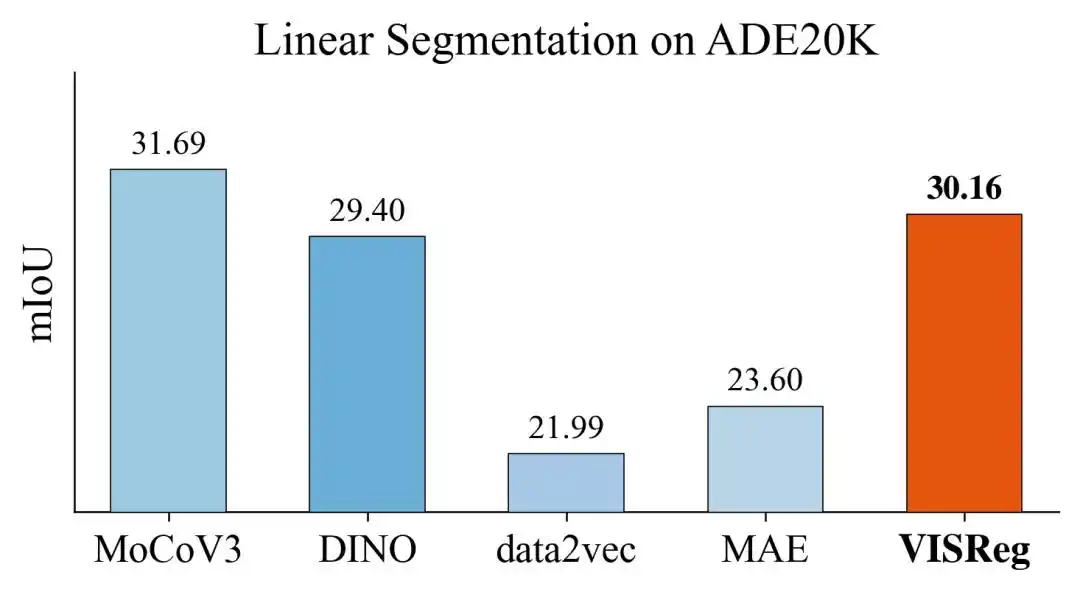
Figure 7: Linear semantic segmentation on ADE20K. Without any heuristic tricks, VISReg achieves competitive mIoU, second only to MoCoV3.

In generation guidance (SiT-B/2, iREPA framework, 100k training steps), generation guided by VISReg features outperforms DINO on three out of four metrics: gFID 40.36 (DINO 41.15), Precision 51.38 (DINO 50.51), Recall 61.26 (DINO 60.70), IS essentially tied (33.48 vs 33.47). This shows VISReg's learned representations are also superior as generation guidance signals.
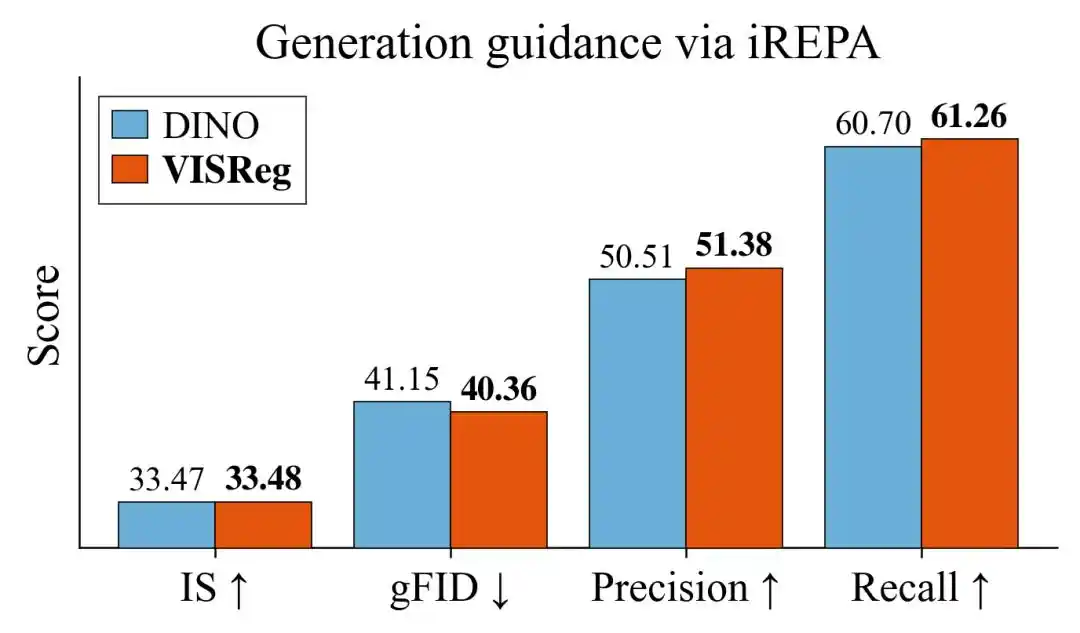
Figure 8: Image generation guided by VISReg vs. DINO features using SiT-B/2. VISReg provides better guidance on most metrics (lower gFID, higher Precision and Recall).

6. Robustness on Low-Quality Data

On low-quality datasets such as long-tail distribution (ImageNet-LT) and low-rank (Galaxy10), VISReg can stably prevent collapse and learn meaningful representations, while DINO fails directly without fine-tuned hyperparameters.
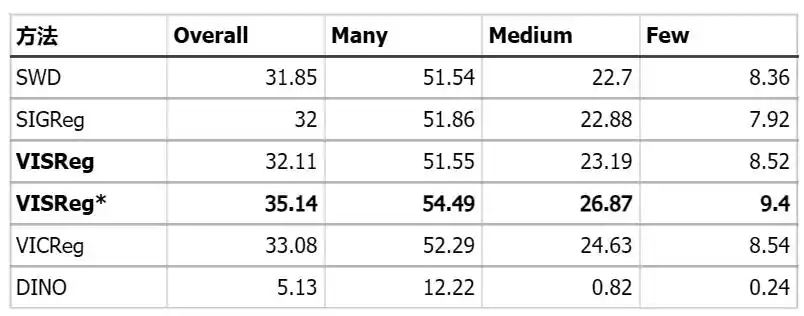
Table 1: Linear probing accuracy on ImageNet-LT

Table 2: In-domain linear probing accuracy on Galaxy10

Conclusion

VISReg demonstrates that by decoupling representation regularization into two independent components, "scale" and "shape," one can obtain an SSL method that is more stable, efficient, and has stronger generalization than existing methods.

Without using any training heuristic tricks, it achieves leading or near-leading results across multiple dimensions including image recognition, segmentation, and generation guidance, and matches DINOv2's OOD performance with about 1/10 of the data. This provides a new regularization-based solution to the long-standing representation collapse problem in JEPA world models.

References:

https://arxiv.org/abs/2606.02572

This article is from the WeChat public account "Xin Zhi Yuan," author: LRST

Cryptos en tendance

Questions liées

QWhat is the core problem that VISReg aims to solve in self-supervised learning?

AVISReg aims to solve the core problem of representation collapse in self-supervised learning, where a model maps different inputs to the same or very few vectors, failing to learn discriminative representations.

QHow does VISReg fundamentally differ from its predecessor SIGReg in handling representation collapse?

AVISReg differs from SIGReg by decoupling the regularization into two independent targets: 'scale' and 'shape'. Crucially, it maintains a strong gradient signal even when the model is collapsing, whereas SIGReg suffers from vanishing gradients in such states, making recovery difficult.

QWhat are the three main components of the VISReg regularization objective?

AThe three main components are: 1) Scale Regularization (variance term to prevent magnitude collapse), 2) Shape Regularization (using Sliced Wasserstein Distance after stop-gradient normalization to align the distribution shape to an isotropic Gaussian), and 3) A centering loss that pulls the batch mean towards the origin.

QWhat key advantage in data efficiency does VISReg demonstrate compared to DINOv2 according to the experimental results?

AAccording to the experimental results, VISReg achieves comparable performance to DINOv2 on out-of-distribution benchmarks using only about 1/10th of the training data. Specifically, VISReg trained on ImageNet-22K (~14M images) matched the average OOD performance of DINOv2 trained on LVD-142M (~142M images).

QIn which evaluation scenarios did VISReg outperform DINO after fine-tuning?

AAfter fine-tuning, VISReg outperformed DINO and supervised pre-training across all five tested datasets: CIFAR-10, CIFAR-100, Flowers, ImageNet-1K, and Galaxy10.

Lectures associées

PA Figure | Une infographie pour comprendre les grands événements de l'écosystème Web3 en août 2026

Août 2026 s'annonce chargé pour l'écosystème Web3, marqué par plusieurs événements clés susceptibles d'influencer les marchés. L'agenda macroéconomique sera déterminant, avec la publication des données américaines sur l'emploi (non-farm payrolls) et l'inflation (CPI) de juillet, ainsi que les comptes-rendus de la Réserve Fédérale et le symposium annuel de Jackson Hole. Sur le front réglementaire, des développements majeurs sont attendus : le Sénat américain doit dévoiler un nouveau projet de loi (*CLARITY Act*), tandis que l'interdiction des transactions cryptos de l'UE envers la Biélorussie entre en vigueur. Les marchés devront également absorber des déblocages massifs de jetons (**ENA, AVAX, CONX, ZRO, KAITO**, etc.), susceptibles de créer de la volatilité. Par ailleurs, l'industrie continuera son consolidation, avec l'arrêt ou la refonte prévus de plusieurs services comme Exchange Art, Ctrl Wallet, Zapper, NFTfi et Summer.fi, incitant les utilisateurs à gérer leurs actifs en conséquence. Du côté des entreprises, les résultats du Q2 de **SpaceX, Circle et Nvidia** seront publiés, et des levées de fonds importantes sont au programme, notamment pour la société chinoise Moonshot AI (pré-IPO). Enfin, des événements sectoriels majeurs comme **Bitcoin Asia 2026** et le **China Digital Expo 2026** se tiendront. En résumé, le mois d'août sera structuré autour des anticipations macroéconomiques, de l'évolution réglementaire, des déblocages de tokens et de la consolidation continue du secteur.

marsbitIl y a 7 mins

PA Figure | Une infographie pour comprendre les grands événements de l'écosystème Web3 en août 2026

marsbitIl y a 7 mins

La voix la plus célèbre de « Cassandre » de Wall Street s'attaque cette fois à NVIDIA

Une récente divulgation de l’investisseur Michael Burry, connu pour avoir prédit la crise des subprimes et immortalisé dans « The Big Short », a relancé les débats sur le marché. Fin juin, il a annoncé avoir pris des positions à découvert sur plusieurs valeurs technologiques, dont Nvidia (à un prix d’entrée de 198,09 $), Tesla, Applied Materials, Caterpillar et l’ETF SOXX (semiconducteurs). Le 1er juillet, il a ajouté Micron à sa liste, avant d’augmenter fin juillet ses positions sur Nvidia, Micron et SOXX. Ses arguments portent principalement sur les pratiques comptables dans le secteur de l’IA : selon lui, la durée d’amortissement des puces (étirée à 6 ans par les géants du cloud comme Microsoft ou Google) ne reflète pas leur obsolescence rapide (2-3 ans), ce qui gonflerait artificiellement les profits. Il évoque également des risques de « financement circulaire hors bilan », où Nvidia pourrait garantir des prêts à des clients pour qu’ils achètent ses propres puces, créant ainsi une demande artificielle. Enfin, il critique les rachats d’actions de Nvidia, accusés de doper artificiellement le bénéfice par action – une affirmation que la société a contestée en soulignant des erreurs de calcul. Les réactions sont partagées. D’un côté, des voix comme Steve Eisman (autre figure de « The Big Short ») restent prudentes mais ne suivent pas la position découverte, notant la croissance soutenue des revenus et des investissements en IA. De l’autre, Jim Chanos, célèbre vendeur à découvert, partage l’inquiétude sur les écarts comptables mais préfère cibler d’autres acteurs financiers plutôt que les fabricants de puces. Historiquement, les appels de Burry ont connu des succès mitigés : corrects sur des crises structurelles (subprimes, COVID), mais souvent prématurés ou erronés sur des arguments de valorisation (Tesla, Nvidia en 2023). Aujourd’hui, les positions à découvert sur Nvidia restent marginales (environ 1,4 % des actions en circulation), même si les pertes cumulées des vendeurs à découvert sur la valeur dépassent 5 milliards de dollars. Pour les investisseurs, l’intérêt réside moins dans le suivi des positions de Burry que dans la méthodologie sous-jacente : scruter les flux de trésorerie, questionner les traitements comptables agressifs et identifier les risques structurels, surtout quand le marché semble euphorique. La question centrale n’est pas de savoir si Burry a raison cette fois, mais plutôt quels enseignements tirer de son analyse pour évaluer la solidité réelle de la bulle présumée de l’IA.

marsbitIl y a 30 mins

La voix la plus célèbre de « Cassandre » de Wall Street s'attaque cette fois à NVIDIA

marsbitIl y a 30 mins

Sélection de la semaine丨Émotions épiques sur le marché boursier, l'entrée en bourse de Changxin Tech redéfinit le paysage du stockage, Saylor vise à rétablir l'ancrage du STRC vers le 8 septembre

PANews présente un résumé hebdomadaire de contenus clés. Les marchés ont connu une volatilité significative, avec des indices boursiers sud-coréens subissant plusieurs interruptions et une chute des actions technologiques liées à l'IA. Dans ce contexte, le bitcoin apparaît comme un actif relativement stable. Le paysage technologique évolue rapidement. Le géant de la mémoire Longxin Technology a fait ses débuts en bourse avec une capitalisation importante, symbolisant une percée pour la DRAM nationale. Parallèlement, la convergence de l'IA, des agents autonomes et des besoins en calcul redéfinit les secteurs, des GPU aux infrastructures énergétiques, les entreprises de minage de bitcoin se repositionnant autour de la gestion de l'électricité. Dans le domaine crypto, l'innovation se poursuit. Les portefeuilles intelligents pour agents IA et les mécanismes de paiement programmables gagnent en importance, attirant l'attention de grandes plateformes. De nouveaux modèles économiques, comme le protocole à jeton FWA qui combine NFT et système de tirage, génèrent un fort engagement. Cependant, un décalage est observé entre la croissance des revenus des principaux protocoles et la performance de leurs jetons. Le secteur des Real World Assets (RWA) voit son volume augmenter mais peine à mobiliser ses actifs. Les perspectives macroéconomiques restent mitigées. La Réserve Fédérale américaine maintient des taux directeurs élevés, signalant une orientation durablement restrictive malgré des divisions internes. Des analystes comme Tom Lee considèrent les récentes corrections comme un assainissement nécessaire, affirmant que la logique de long terme du secteur reste intacte. Des personnalités anticipent un rôle accru du bitcoin dans le futur système monétaire. Les informations marquantes incluent : des mouvements réglementaires affectant les courtiers pour investisseurs chinois, le plan de développement technique d'Ethereum à horizon 2030, une importante migration de staking par Lido, et des performances boursières variées pour les entreprises liées à la crypto et à l'IA. Michael Saylor a également annoncé un objectif de réalignement pour le STRC autour du 8 septembre.

marsbitIl y a 36 mins

Sélection de la semaine丨Émotions épiques sur le marché boursier, l'entrée en bourse de Changxin Tech redéfinit le paysage du stockage, Saylor vise à rétablir l'ancrage du STRC vers le 8 septembre

marsbitIl y a 36 mins

Lorsque le marché commence à s'interroger sur les dépenses en capital liées à l'IA : Analyse complète des résultats du Q2 des cinq géants technologiques

À la fin juillet 2026, les résultats trimestriels d'Alphabet, Intel, Microsoft, Meta et Apple ont tous mis en évidence une croissance robuste des revenus et des bénéfices, largement portée par les investissements et la demande en IA. Cependant, les réactions des investisseurs ont divergé, soulignant un changement d'attention : le marché s'interroge désormais sur le calendrier du retour sur investissement de ces dépenses massives en capital. Alphabet a affiché une croissance record de son chiffre d'affaires et une performance cloud exceptionnelle, mais son augmentation des dépenses d'investissement, entraînant un flux de trésorerie libre négatif pour la première fois, a provoqué une chute de son cours. Intel, malgré ses meilleures ventes depuis quinze ans, a vu son rebond boursier anéanti après l'annonce d'une hausse significative de son budget d'investissement. À l'inverse, Microsoft, en abaissant ses prévisions de dépenses en capital et en promettant des flux de trésorerie positifs, a connu une forte hausse de son action. Meta, dont les dépenses ont explosé et le flux de trésorerie libre s'est effondré, a subi la plus forte vente. Enfin, Apple, malgré des résultats records, a vu son action chuter en raison de prévisions inférieures aux attentes, pointant des contraintes d'approvisionnement. En résumé, la demande en IA reste solide, mais le marché sanctionne désormais les entreprises dont les investissements massifs menacent à court terme la rentabilité et les flux de trésorerie, récompensant celles qui maîtrisent leur trajectoire financière.

Odaily星球日报Il y a 43 mins

Lorsque le marché commence à s'interroger sur les dépenses en capital liées à l'IA : Analyse complète des résultats du Q2 des cinq géants technologiques

Odaily星球日报Il y a 43 mins

a16z : De la société au DAO, DUNA pourrait devenir la prochaine forme d'organisation

L’histoire de l’organisation commerciale est une quête pour permettre à des étrangers de collaborer. Des compagnies familiales médiévales, où le risque était personnel, à l'invention de la société par actions (comme la VOC néerlandaise), qui a permis une collaboration à grande échelle avec une responsabilité limitée, chaque innovation a réduit les coûts de coordination. Aujourd’hui, les organisations autonomes décentralisées (DAO) représentent une nouvelle frontière, utilisant la blockchain pour coordonner des communautés sans gestion centralisée. Cependant, elles se heurtent à un vide juridique : sans reconnaissance légale, leurs membres pourraient encourir une responsabilité personnelle illimitée, et leur statut réglementaire reste incertain. La solution émergente est la DUNA (Association Non Incorporée Non lucrative Décentralisée). Cette nouvelle structure juridique, déjà adoptée dans quelques États américains, confère aux groupes décentralisés une personnalité juridique et une responsabilité limitée, sans exiger de hiérarchie managériale traditionnelle. Elle permet à une communauté gérée par des règles en chaîne de conclure des contrats, de détenir des actifs et d'interagir avec le système juridique. La DUNA ne résout pas tous les défis de gouvernance ou de conformité, mais elle comble une lacune cruciale en offrant une enveloppe légale native pour les réseaux internet décentralisés. Elle marque potentiellement le début d’une nouvelle ère dans la conception organisationnelle, en répondant à nouveau à l'éternel défi de la collaboration à grande échelle.

marsbitIl y a 1 h

a16z : De la société au DAO, DUNA pourrait devenir la prochaine forme d'organisation

marsbitIl y a 1 h

Trading

Spot

Articles tendance

Comment acheter CORE

Bienvenue sur HTX.com ! Nous vous permettons d'acheter CORE (CORE) de manière simple et pratique. Suivez notre guide étape par étape pour commencer votre parcours crypto.Étape 1 : Création de votre compte HTXUtilisez votre adresse e-mail ou votre numéro de téléphone pour ouvrir un compte sur HTX gratuitement. L'inscription se fait en toute simplicité et débloque toutes les fonctionnalités.Créer mon compteÉtape 2 : Choix du mode de paiement (rubrique Acheter des cryptosCarte de crédit/débit : utilisez votre carte Visa ou Mastercard pour acheter instantanément CORE (CORE).Solde :utilisez les fonds du solde de votre compte HTX pour trader en toute simplicité.Prestataire tiers :pour accroître la commodité d'utilisation, nous avons ajouté des modes de paiement populaires tels que Google Pay et Apple Pay.P2P :tradez directement avec d'autres utilisateurs sur HTX.OTC (de gré à gré) : nous offrons des services personnalisés et des taux de change compétitifs aux traders.Étape 3 : stockage de vos CORE (CORE)Après avoir acheté vos CORE (CORE), stockez-les sur votre compte HTX. Vous pouvez également les envoyer ailleurs via un transfert sur la blockchain ou les utiliser pour trader d'autres cryptos.Étape 4 : tradez des CORE (CORE)Tradez facilement CORE (CORE) sur le marché Spot de HTX. Il vous suffit d'accéder à votre compte, de sélectionner la paire de trading, d'exécuter vos trades et de les suivre en temps réel. Nous offrons une expérience conviviale aux débutants comme aux traders chevronnés.

443 vues totalesPublié le 2024.12.13Mis à jour le 2026.06.02

Comment acheter CORE

Discussions

Bienvenue dans la Communauté HTX. Ici, vous pouvez vous tenir informé(e) des derniers développements de la plateforme et accéder à des analyses de marché professionnelles. Les opinions des utilisateurs sur le prix de CORE (CORE) sont présentées ci-dessous.

活动图片