Author: ChandlerZ, Foresight News
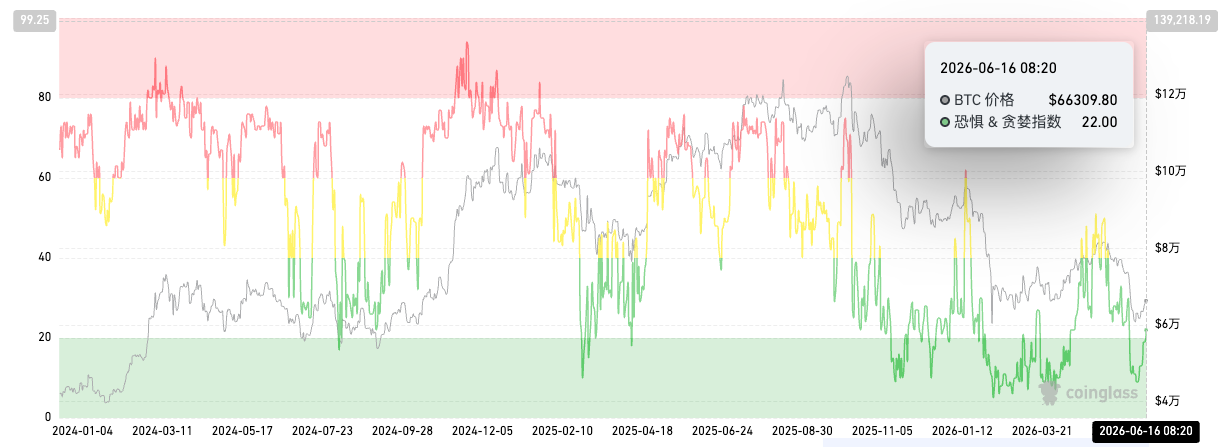
On the evening of June 15, Bitcoin rebounded to a high of $67,255, marking its first return near the $67,000 level since falling below the $60,000 threshold on June 6; Ethereum reached a high of $1,848, currently quoted at $1,791; Sol is currently at $73.95, rebounding over 23% from its previous low of around $60.
The current Fear & Greed Index is 22, indicating the market sentiment remains fearful.
Coinglass data shows that over the past 24 hours, $488 million in open interest was liquidated across the entire network, with $366 million in short positions liquidated. Ethereum accounted for approximately $175 million in liquidations, while Bitcoin saw about $113 million.
The driving force behind this rebound almost entirely stems from the macro landscape. The electronic signing of the U.S.-Iran Memorandum of Understanding has been completed, with the official signing ceremony scheduled for June 19 in Switzerland. Oil prices plummeted by about 5% in a single day, and the Dow Jones Industrial Average hit a new record high. Additionally, SpaceX surged 20% in a day, with its stock price soaring for a second consecutive trading session, fueling continued trading enthusiasm in the U.S. stock market. Gold recorded three consecutive days of gains, breaking through $4,300. Against the backdrop of a broad-based rally in global risk assets, Bitcoin, as a high-beta asset, benefited concurrently.
Simultaneously, a report released by Glassnode indicates that on-chain and derivatives data point to the conclusion that the current situation resembles a technical correction after a deep oversold condition and does not yet constitute a trend reversal.
U.S.-Iran Agreement Lands, Plunging Oil Reshapes Inflation Expectations
On June 14, the United States and Iran, through mediation by Pakistan and Qatar, confirmed a ceasefire agreement, announcing an immediate cessation of all military actions. Key terms of the agreement include the reopening of free passage rights through the Strait of Hormuz and the lifting of the U.S. maritime blockade on Iranian ports. Former President Trump subsequently confirmed he had authorized the end of the blockade. The formal signing ceremony is set for June 19 in Geneva, Switzerland.
This marks the first substantive signal ending the nearly four-month conflict since the U.S.-Israel military action against Iran on February 28. The market reaction was swift and intense, with Brent crude falling below $83 per barrel during Monday's session, touching a two-month low, down over 20% from its 2026 high. WTI declined by approximately 5% in sync.
The Strait of Hormuz handles about 20% of global oil shipments. The blockade had kept global energy prices persistently elevated, exacerbating inflationary pressures. The reopening of the strait means the removal of the most significant bottleneck on the supply side, greatly improving oil supply expectations. For the crypto market, the logical chain supporting Bitcoin's breakthrough above $67,000 is: falling oil prices → cooling inflation expectations → increased room for Fed rate cuts → upward revision of risk asset valuations.
U.S. Stocks Rally Across the Board, SpaceX Continues Leading Gains
The Dow Jones Industrial Average gapped up on Monday, hitting a new all-time high intraday, led by tech stocks. The S&P 500 and Nasdaq Composite Index rose sharply in tandem. The turning point for market sentiment was precisely the landing of the U.S.-Iran agreement, as the subsiding geopolitical risks released pent-up risk appetite.
The most eye-catching stock remains SpaceX (SPCX). SpaceX went public on Nasdaq on June 12 at an IPO price of $135. With underwriters fully exercising the over-allotment option, the total funds raised reached $86.2 billion, setting a new global record for IPO size. It closed Monday at $192.46, up 42% from the IPO price, adding $412 billion in market value in a single day, pushing SpaceX's total valuation above $2.5 trillion and into the top six globally by market cap.
Vanda Research data shows that retail investors bought as many SpaceX shares in the two trading days post-listing as they did across the entire U.S. stock market in the prior week. The value of Musk's SpaceX holdings makes him the world's first trillionaire, with a personal net worth exceeding three times that of the world's second-richest person, Larry Page. However, the Class A shares issued in this IPO constitute only about 4.3% of the total market cap, resulting in an extremely scarce initial free float. Following the Q2 earnings call in late July, approximately 10% to 15% of early insider shareholders will see their lock-up periods expire.
The SpaceX U.S. stock spot token, rSPCX, rose to a high of 229.86 USDT in morning trading and is currently at 217.58 USDT, up 28.82% in 24 hours.
Rebound, Liquidations, and Capital Rotation
Looking at the price action, Bitcoin has been in a sustained downtrend since hitting a cycle high of $91,323 in early 2026. After breaking below the key support level of $82,733 in May, the decline accelerated, briefly dipping below the $60,000 threshold on June 6 to a low around $59,000. Subsequently, the price consolidated repeatedly between $59,000 and $64,000. On the evening of June 15, with the concentrated release of macro-positive news, it rapidly surged, rebounding about 14% from the low within a week. Technically, the $67,000 region is a short-term resistance level within the prior downtrend channel. The price's rapid retreat after touching it indicates that selling pressure above persists.
In terms of capital structure, the crypto market is undergoing a noticeable reconfiguration.
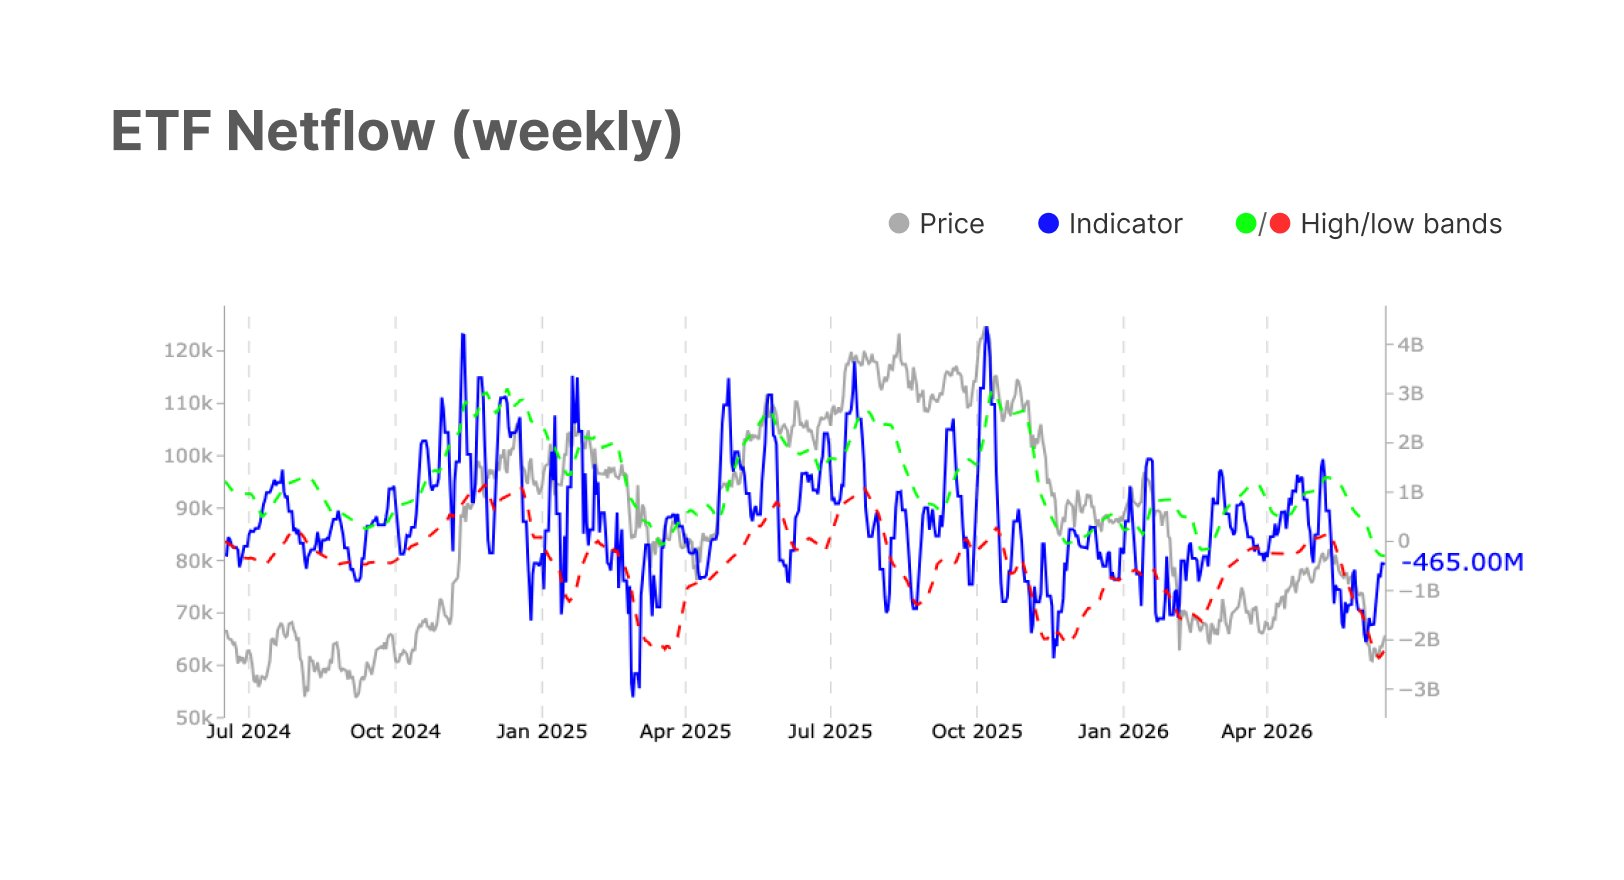
Over the past several weeks, Bitcoin spot ETFs have experienced their most severe outflows since their inception. Early June saw a single-week net outflow of $3.4 billion, the highest weekly figure since the ETFs launched in January 2024. Since mid-May, Bitcoin ETFs have seen cumulative outflows of about $3.75 billion, recording the longest consecutive redemption cycle in history. However, a turning signal emerged on June 12, with Bitcoin ETFs recording a single-day net inflow of $85.9 million.
Glassnode data shows that as of the week ending June 15, weekly ETF net outflows narrowed to $465 million from $1.3 billion the previous week, an improvement of 65.5%. The ETF MVRV has rebounded to 1.06, indicating institutional holdings have overall re-entered a marginally profitable zone. However, weekly trading volume concurrently shrank by 38.1% to $11.1 billion, reflecting that institutional participation enthusiasm has not yet rebounded in sync.
Simultaneously, the current supply ratio of short-term holders to long-term holders has fallen to 13.8%, below the statistical lower bound of 14.6%. This indicates that a significant amount of short-term speculative supply has been washed out, and the holder structure is shifting towards long-term orientation. The Hot Capital Share has decreased to 16.3%, with the proportion of capital that entered within the last three months continuously shrinking. Fear has begun to subside, but the market lacks sufficient new conviction and renewed institutional involvement to propel prices into a trending upward move.
Meanwhile, altcoin ETFs are taking the baton. The XRP ETF approved in March had accumulated net inflows of $1.37 billion by mid-May. The Solana ETF, which began trading on May 26, has been even stronger, amassing $1.118 billion in net inflows in less than three weeks.
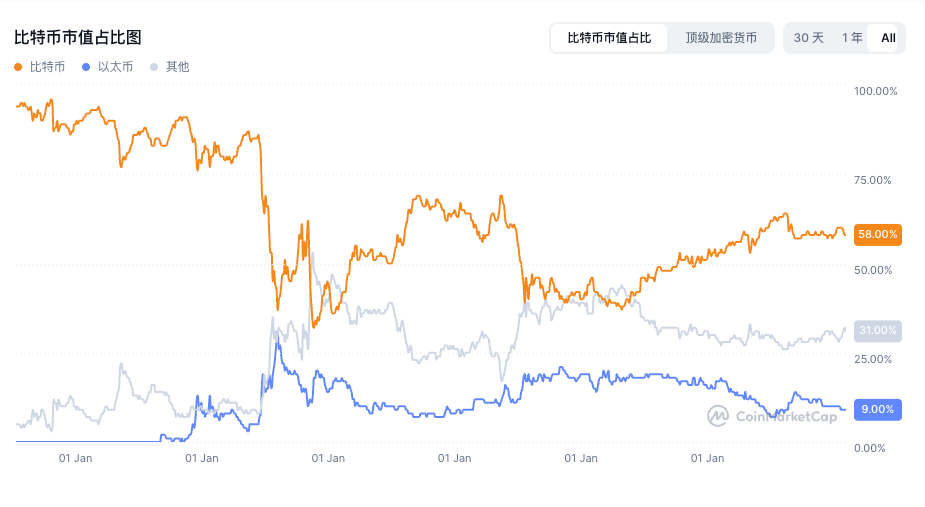
Bitcoin dominance has dropped to 58%, indicating capital is rotating from BTC and ETH towards emerging ETF categories.
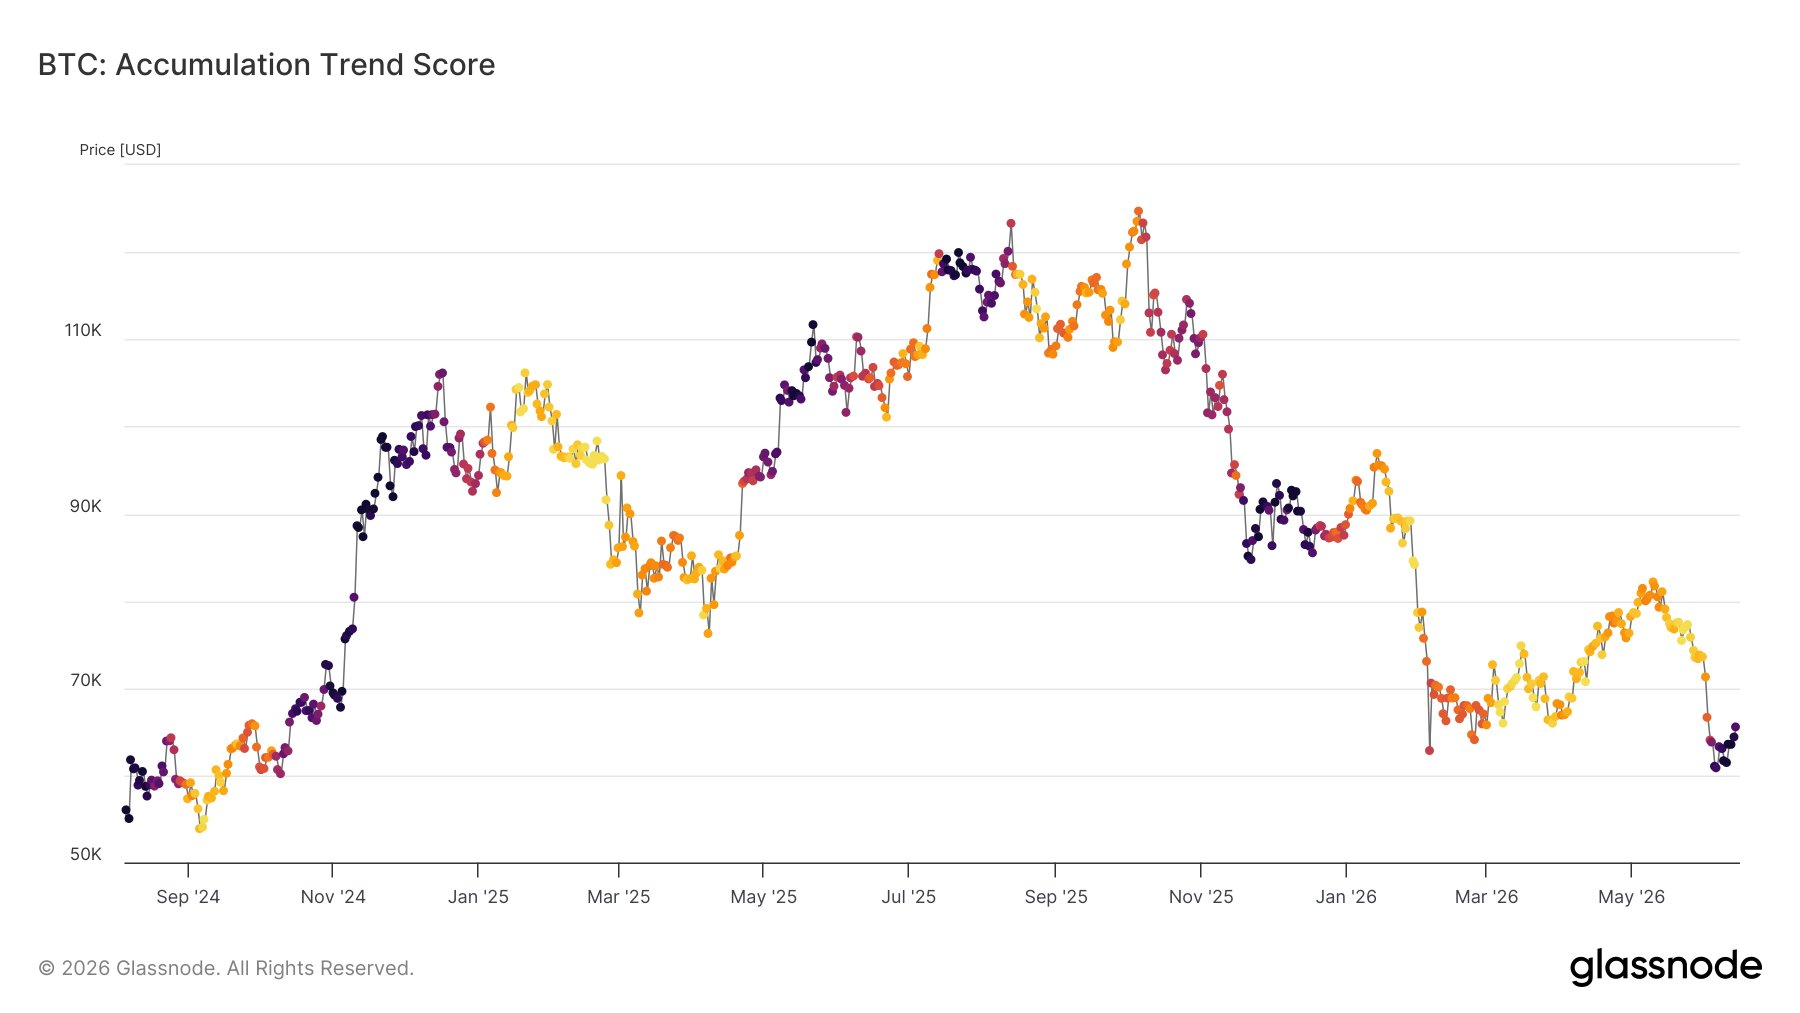
However, the analysis also points out that the Accumulation Trend Score measures the relative size of entities actively accumulating on-chain assets. A value close to 1 indicates widespread accumulation; a value close to 0 indicates distribution. After the price broke above the $60,000 mark in early June, the composite scores for various sectors began shifting towards accumulation. This structure aligns with the common trend of buying the dip, where on-chain demand increases as prices fall, rather than sustained selling.