This column combs the trading status of the spot market and futures market within the day, and analyzes the trading performance of BTC and the overall market. Help investors tap effective trading signals.
Market view
During the continuous rebound of mainstream currencies such as BTC and eth, they have touched the cost price of investors in the past year. At present, the majority of investors trading in the past year have made profits, which has enhanced the driving force of the market to further rise. The current trend is favorable for bulls, and the contract position has reached a recent high, indicating that the willingness to do long has increased.
goods in stock
1. Stock exchange BTC
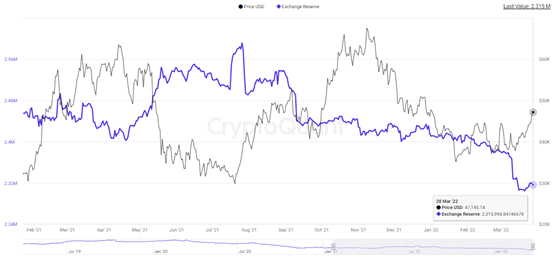
The stock of BTCs in the exchange fell to 2.315 million BTCs on March 28. From the change of BTC stock in the exchange, the outflow increased from February to March, indicating that the selling pressure of BTC continues to reduce. Although there are signs of rebound in BTC stock recently, there is little room for rebound. The BTC stock of the exchange retreated after reaching 231.98, indicating that the BTC selling pressure decreased after a slight increase, and the short-term trend is more BTC.
2. Market value and trading volume of the whole network
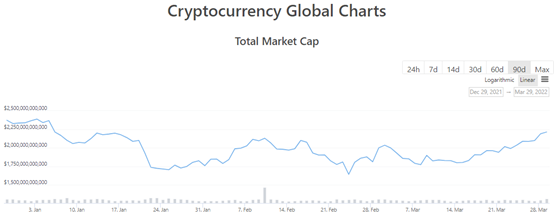
In the past 24 hours, the overall market trading volume was US $125.43 billion, and the overall market value increased by 1.5% to US $224.06 billion. Focus on the trading volume and market value performance of the overall market in the past three months. The market value fluctuation space of the whole network is between us $16423.3 billion and US $2387.7 billion, and the current market value is almost the highest in three months. In the form of continuous changes in market value, it is shown as double bottom reversal, which improves the bullish signal.
contract
Contract transactions in mainstream currencies such as BTC can find spot prices and improve the direction of price operation. At the same time, it can also provide hedging methods for spot investors. Analyzing the long and short position direction, position change and leverage performance of the contract can help us confirm the trading signal.
1. Statistics of warehouse explosion in the whole network
The number of open positions indicates the effect of the release of market resistance during the price operation. The larger the number of open positions, the greater the reverse capital strength. After a short period of time, the excessively high position explosion amount can also prompt the price reversal signal. Because the fund increases the number of positions in the opposite direction in a short time, promoting the reverse operation of the market in a short time.
Network wide contract explosion
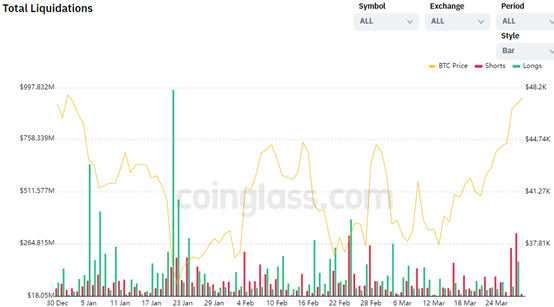
On March 29, the empty single explosion warehouse of the whole network contract reached US $62 million, and the multi single explosion warehouse of the whole network reached US $11 million. In the three trading days since March 27, the scale of empty single position explosion reached US $244 million, US $313 million and US $31 million. In the same period, the scale of multiple single position explosion was US $62 million, US $179 million and US $11 million. The accumulated position explosion of empty orders is US $588 million, which means that the strength of bulls is strong, and the market has shown a unilateral trend in the near future.
2. Statistics of positions and turnover of the whole network
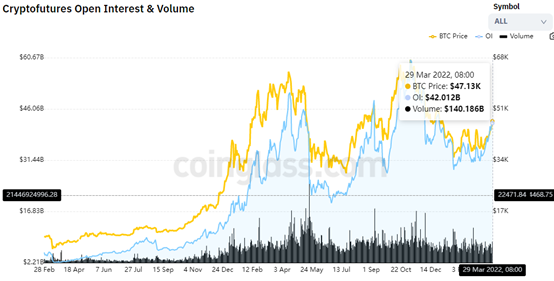
The contract trading volume of the whole network was stable. The position rebounded to US $42 billion on March 29, up 46.5% from the lowest US $28.67 billion on January 23; The turnover was 140 billion US dollars. It is worth noting that the contract position is the highest level in one year, indicating that the overall market heat is growing continuously.
3. Statistics of long and short positions of the exchange
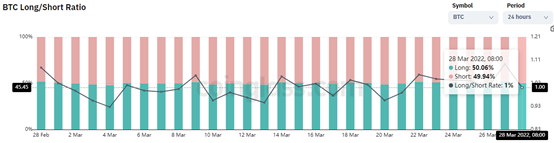
The proportion of long and short positions in the exchange intuitively reflects the strength of long and short positions, and the dynamic proportion of long and short positions better verifies the trading signal. When multiple positions account for a large proportion, it indicates that the buyer has strong strength, and the BTC price is easy to rise but difficult to fall. On the contrary, the short strength is strong, suggesting a short signal.
On March 29, the proportion of multiple empty orders in BTC was 1%, the proportion of multiple orders was 50.06%, and the proportion of empty orders was 49.94%. The multi-party dominance has continuously dominated since March 22, driving the BTC price to continue to rise. At present, there is a slight decline in the proportion of BTC bulls, and attention can be paid to low absorption opportunities in the short term.
4. Contract capital rate
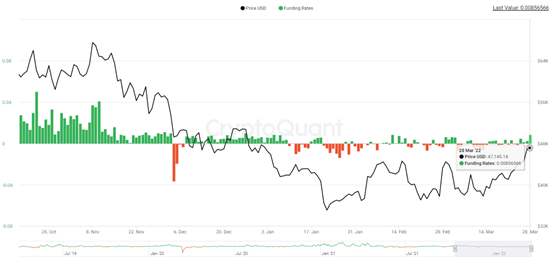
The higher the contract capital rate, the more information the bulls have about the price rise. The latest capital rate value of BTC shows that the fluctuation space of capital rate since 2022 is small, and the financing cost on more trading days is lower than 0, which means that the cost of financing for investors to buy BTC is very low.
Driven by low purchase costs, BTC price shocks stabilized. At the same time, financing costs also showed signs of a slight recovery. The latest financing cost on the 29th of March reached 0.0085. In absolute terms, the value is much lower than the level before November 4, 2021. This shows that the main capital has a low enough cost advantage to buy BTC and push up the price increase.