Bitcoin Price To Crash Another 50% As Analyst Marks $40,000 Bottom Target

bitcoinistPublished on 2026-01-06Last updated on 2026-01-06

Abstract

Bitcoin has declined over 32.5% from its all-time high above $126,000 and is currently trading above $90,000. However, analyst CryptoBullet predicts a further 50% crash in 2026, potentially driving the price down to around $40,000. This forecast is based on Bitcoin’s Realized Price—the average price at which all coins last moved—which has historically been breached during bear markets. Past cycles saw drawdowns of up to 66% below this level. Due to declining volatility, the analyst expects a less severe drop this cycle, estimating a 24–31% decline below the Realized Price, placing the bottom between $40,000 and $43,000. In an extreme scenario mirroring 2022’s 33% drop, Bitcoin could fall to $37,400 or even $35,000 by late 2026.

The Bitcoin price has already crashed by more than 32.5% from last year’s all-time high above $126,000, toward the $85,000 region. Although the cryptocurrency has recovered slightly and is now trading above $90,000, a crypto analyst has forecast another major price crash in 2026. According to the forecast, Bitcoin could decline by 50%, following trends observed in previous cycles, potentially hitting a bottom near $40,000.

Bitcoin Price Set For 50% Crash

Bitcoin could face another price correction as technical indicators continue to signal a strong bear market. Market expert CryptoBullet warns that Bitcoin’s bear market behavior is not over, with a deeper pullback aligning with long-term on-chain trends.

CryptoBullet bases his outlook on Bitcoin’s Realized Price, a metric that reflects the average price at which all circulating coins last moved. He explained that this level acts as a key reference during bear markets and has historically marked zones where price eventually breaks down before forming a bottom.

Looking at past cycles, he noted that Bitcoin has consistently fallen below its Realized Price during bear markets. The drawdowns reached 66% in 2011, 48% in 2015, 35% in 2018, and 33% in 2022, indicating a consistent tendency for prices to fall below this level. Due to this repeated decline, the analyst believes the next bear-market crash will follow the same pattern, triggering a 50% drop to $40,000 for Bitcoin this year.

Source: Chart from CryptoBullet on X

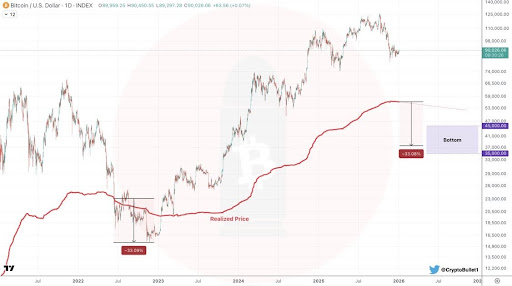
Another major factor supporting CryptoBullet’s analysis is Bitcoin’s declining volatility over time. He noted that the gap between market price and Realized Price has steadily narrowed, shrinking from a 66% deviation in 2011 to roughly 33% in 2022.

Because of this trend, the analyst does not expect the bear market this year to be as severe as the downside observed in past cycles. Instead, he estimates Bitcoin could fall by 24% to 31% below Realized Price, placing its likely bottom in the $40,000 to $43,000 range.

Extreme Bear Market Scenario

With the Realized Price currently near $56,000, CryptoBullet has also cautioned that Bitcoin could decline even further to below $40,000 this year. The analyst noted that if the market repeats the 2022 bear market, a 33% drop below Realized Price would place Bitcoin near $37,400.

He added that by the third quarter or fourth quarter of 2026, Realized Price could fall deeper to $53,000 or $54,000, which could result in a similar 33% crash, pushing Bitcoin closer to $35,000. The analyst has stated that $35,000 represents the most extreme downside he can reasonably see this year based on historical behavior. The accompanying chart also reflects this view by highlighting previous bear-market crashes that occurred after the price slipped well below the Realized Price line.

BTC trading at $93,079 on the 1D chart | Source: BTCUSDT on Tradingview.com

Related Questions

QAccording to the analyst CryptoBullet, what is the main reason for predicting a 50% Bitcoin price crash to $40,000?

AThe prediction is based on Bitcoin's historical behavior of consistently falling below its Realized Price during bear markets, with the gap between market price and Realized Price having narrowed over time.

QWhat is the 'Realized Price' metric and why is it significant in this analysis?

AThe Realized Price is a metric that reflects the average price at which all circulating Bitcoin last moved. It acts as a key reference during bear markets and has historically marked zones where the price eventually breaks down before forming a bottom.

QWhat are the historical drawdown percentages below the Realized Price that the analyst cites for previous bear markets?

AThe historical drawdowns were 66% in 2011, 48% in 2015, 35% in 2018, and 33% in 2022.

QWhat is the most extreme downside price target for Bitcoin mentioned in the article, and under what scenario could it occur?

AThe most extreme downside target is $35,000. This could occur if the 2026 bear market repeats the 33% drop below the Realized Price seen in 2022, especially if the Realized Price itself falls to around $53,000-$54,000 by late 2026.

QHow does the analyst explain the decreasing severity of Bitcoin's bear market crashes over time?

AThe analyst notes that Bitcoin's declining volatility over time has caused the gap between its market price and Realized Price to steadily narrow, shrinking from a 66% deviation in 2011 to roughly 33% in 2022, making severe crashes less likely.

Related Reads

Trading

Spot
Futures

Hot Articles

Discussions

Welcome to the HTX Community. Here, you can stay informed about the latest platform developments and gain access to professional market insights. Users' opinions on the price of BTC (BTC) are presented below.

活动图片