When Will Solana Price Surge To $360? Analyst Shares Possible Timeline

bitcoinistPublicado a 2026-04-01Actualizado a 2026-04-01

Resumen

Crypto analyst Celal Kucuker has presented a technical analysis suggesting Solana (SOL) could eventually surge to $360, a 333% increase from its current price of around $83. His forecast, however, anticipates significant short-term volatility, including a potential sharp crash to new lows near $50.42 to complete a bearish Double Bottom pattern. Kucuker's chart analysis indicates SOL may first rally to approximately $111.32 before plunging to the $50 support level. From that low, a breakout from a long-term descending channel could propel the price toward the $360 target, potentially by late 2026 or 2027. Key resistance levels on the path are identified at $130 and $260. When questioned on the fundamental thesis, the analyst pointed to broader crypto market dynamics, suggesting that momentum from meme coin rallies often catalyzes upward movement across the market, which could drive Solana to new all-time highs.

A crypto analyst has issued a new Solana price forecast, outlining several potential target levels for the current cycle. In the short term, the analyst expects significant volatility and the possibility of a sharp price crash to new lows. Despite this, his ultimate projection suggests that SOL could surge toward $360, representing a roughly 333% increase from its price of about $83 at the time of writing.

When The Solana Price Could Hit $360

A detailed technical analysis shared by market expert Celal Kucuker on X has sparked renewed optimism around Solana’s price outlook. The analyst shared a chart showing the SOL price around $88 at the time. He also outlined a clear roadmap that points to a potential final surge near $360 for the cryptocurrency.

The chart reveals a dominant bearish channel defined by several parallel red descending trendlines that shaped Solana’s price action from late 2025 through early 2026. These lines have repeatedly capped rallies and guided SOL’s downtrend, while also respecting the critical resistance point around $147.15.

Following the cryptocurrency’s rally to $147, it recorded a massive price crash to $66.92, marking the first floor of its Double Bottom pattern, as shown on the chart. Based on the trajectory of black lines within the descending parallel channel, Kucuker expects Solana to rally again to $111.32 in the near term, representing a roughly 66% increase from the previous bottom.
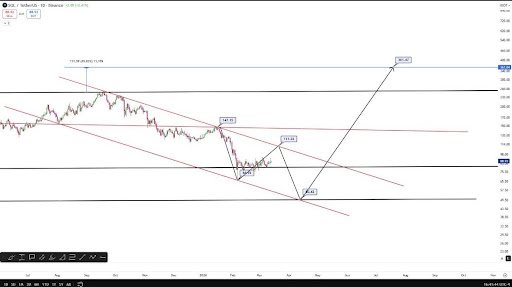
Source: Chart from Celal Kucuker on X

Once this happens, SOL is projected to plunge even deeper toward $50.42, officially completing its bearish Double Bottom pattern. Kucuker has highlighted this area as a solid support zone. From this pivotal low, the analyst drew a black, upward-sloping line that cleanly slices through the entire bearish descending channel.

This line points directly to the $361.47 bullish target. Kucuker’s timing for this projection suggests that Solana could skyrocket to this level by 2027. However, the chart shows somewhere around the third quarter of 2026. Notably, such a move would deliver a staggering 616% gain from the projected $50.42 support level.

Additional targets in the chart analysis further reinforce Kucuker’s bullish outlook. The analyst drew multiple horizontal lines on the chart to mark key resistance zones that may influence price movement. The first red line points to $130 as an immediate resistance level, which comes into play once the price surpasses the initial target of $111.32. Beyond this, the next black line identifies $260 as the next major resistance level that, if broken, could confirm Solana’s projected price rally above $360.

The Thesis Behind The Bull Rally

A crypto community member has challenged Kucuker’s bullish forecast for Solana, questioning why he posted price targets and charts without explaining the underlying thesis. They asked the analyst to explain which macroeconomic factors could push the SOL price above $360 and which could drive it down to the $50 support level.

In response, Kucuker pointed to broader market dynamics, noting that price rallies often start with meme coins, which typically generate momentum across the market. He noted that Solana will likely benefit from this upward movement, potentially propelling it to new all-time highs.

SOL trading at $82 on the 1D chart | Source: SOLUSDT on Tradingview.com

Preguntas relacionadas

QWhat is the analyst's ultimate price target for Solana in this cycle, and what percentage increase does that represent from the current price?

AThe analyst's ultimate price target for Solana is $360, which represents a roughly 333% increase from its price of about $83 at the time of writing.

QAccording to the technical analysis, what is the projected low point that would form the Double Bottom pattern before the surge?

AThe analysis projects that Solana will plunge to a low of $50.42 to officially complete its bearish Double Bottom pattern.

QWhat are the two key resistance levels identified in the chart that Solana must break through on its way to the $360 target?

AThe two key resistance levels identified are $130 as an immediate resistance and $260 as the next major resistance level.

QWhat broader market dynamic did the analyst cite as a potential catalyst for Solana's price rally?

AThe analyst cited that price rallies often start with meme coins, which generate momentum across the market, and Solana will likely benefit from this upward movement.

QBy what timeframe does the analyst suggest Solana could potentially reach the $360 price target?

AThe analyst's timing suggests Solana could reach the $360 target by 2027, with the chart indicating it could happen around the third quarter of 2026.

Lecturas Relacionadas

Peter Schiff afirma que el plan STRC de Strategy perjudica a los accionistas de MSTR

El 31 de julio, las acciones de MicroStrategy Inc. (MSTR) enfrentaron presión vendedora tras su informe de resultados del segundo trimestre. El crítico Peter Schiff atacó el objetivo declarado de la compañía de mantener el precio de sus acciones preferentes STRC cerca de su valor declarado de 100 dólares. Schiff argumentó que esta política crea un conflicto directo con los accionistas comunes de MSTR, desviando el enfoque de la acumulación de Bitcoin hacia posibles riesgos para la rentabilidad y liquidez de los accionistas ordinarios. La estructura de STRC, con dividendos variables ajustados mensualmente para estabilizar su precio alrededor de los 100 dólares, forma parte de la estrategia de MicroStrategy para crear un canal de financiación estable para adquirir más Bitcoin. La compañía ha reforzado su estructura de capital, aumentando sus reservas en efectivo a unos 3.750 millones de dólares para cubrir dividendos preferentes y gastos por intereses, y recomprando acciones STRC. Mientras Schiff ve un posible perjuicio para los accionistas comunes, otros analistas, como Grayscale Research, consideran que las ventas de Bitcoin y la recuperación del precio de STRC reflejan una mayor confianza del mercado en la solidez financiera de la compañía. El futuro desafío para MicroStrategy será equilibrar las compras de Bitcoin, las obligaciones de dividendos preferentes, las recompras de acciones y la presión del mercado sobre sus acciones ordinarias.

cryptonews.ruHace 36 min(s)

Peter Schiff afirma que el plan STRC de Strategy perjudica a los accionistas de MSTR

cryptonews.ruHace 36 min(s)

Trading

Spot
活动图片