Venice Token [VVV] surges 14% – Why THIS is the next KEY hurdle

ambcryptoPublicado a 2026-03-26Actualizado a 2026-03-26

Resumen

Venice Token (VVV) surged 14.37% to $6.40, supported by a 26.54% increase in trading volume, indicating strong spot market demand. The price broke out of a pennant pattern, shifting the market structure from consolidation to expansion, with immediate resistance at $6.68 and a potential target near $8.50. Key support now lies at $5.14. However, the MACD shows weakening bullish momentum with a negative histogram, suggesting a divergence between price action and underlying strength. Additionally, persistent sell pressure in Spot CVD indicates aggressive selling, though buyers appear to be absorbing it. Open Interest rose 18.74%, reflecting leveraged positioning that could fuel volatility. The rally's sustainability depends on holding above $5.14; a break below could quickly reverse gains.

Venice Token [VVV] has surged 14.37% to $6.40 as trading volume climbs 26.54% to $23.12M, signaling strong demand expansion across the spot market.

This expansion shows that price is not drifting upward but rather advancing through strong spot demand.

As participation increases, the rally reflects conviction instead of low-liquidity spikes. The VVV price increase toward $6.40 highlights alignment between demand and price action.

However, volume expansion at this stage also suggests that traders are reacting to the breakout rather than anticipating it.

As a result, this phase often defines whether continuation can hold or begin to fade under pressure.

VVV breaks free as structure shifts upward

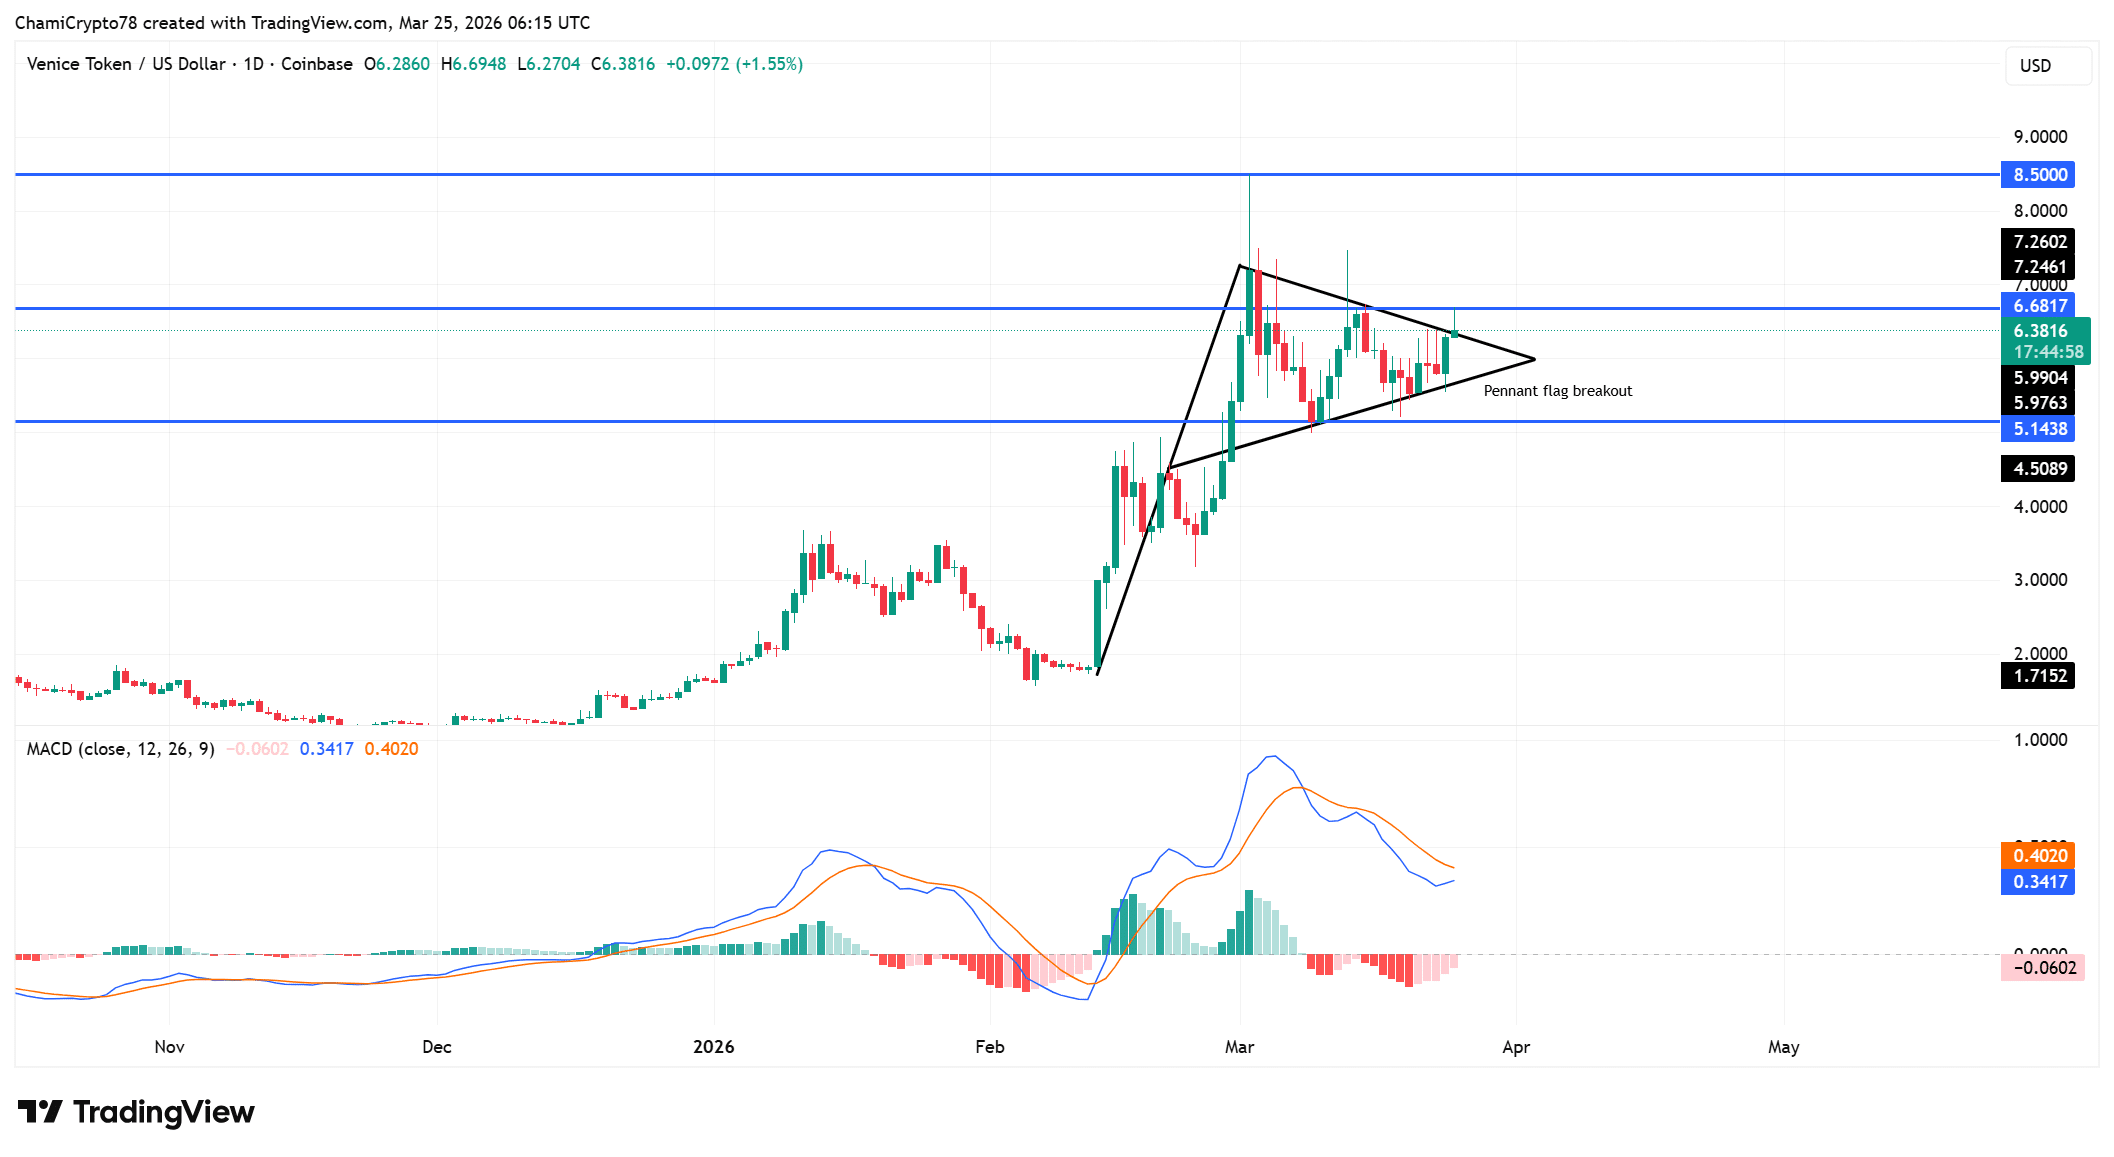
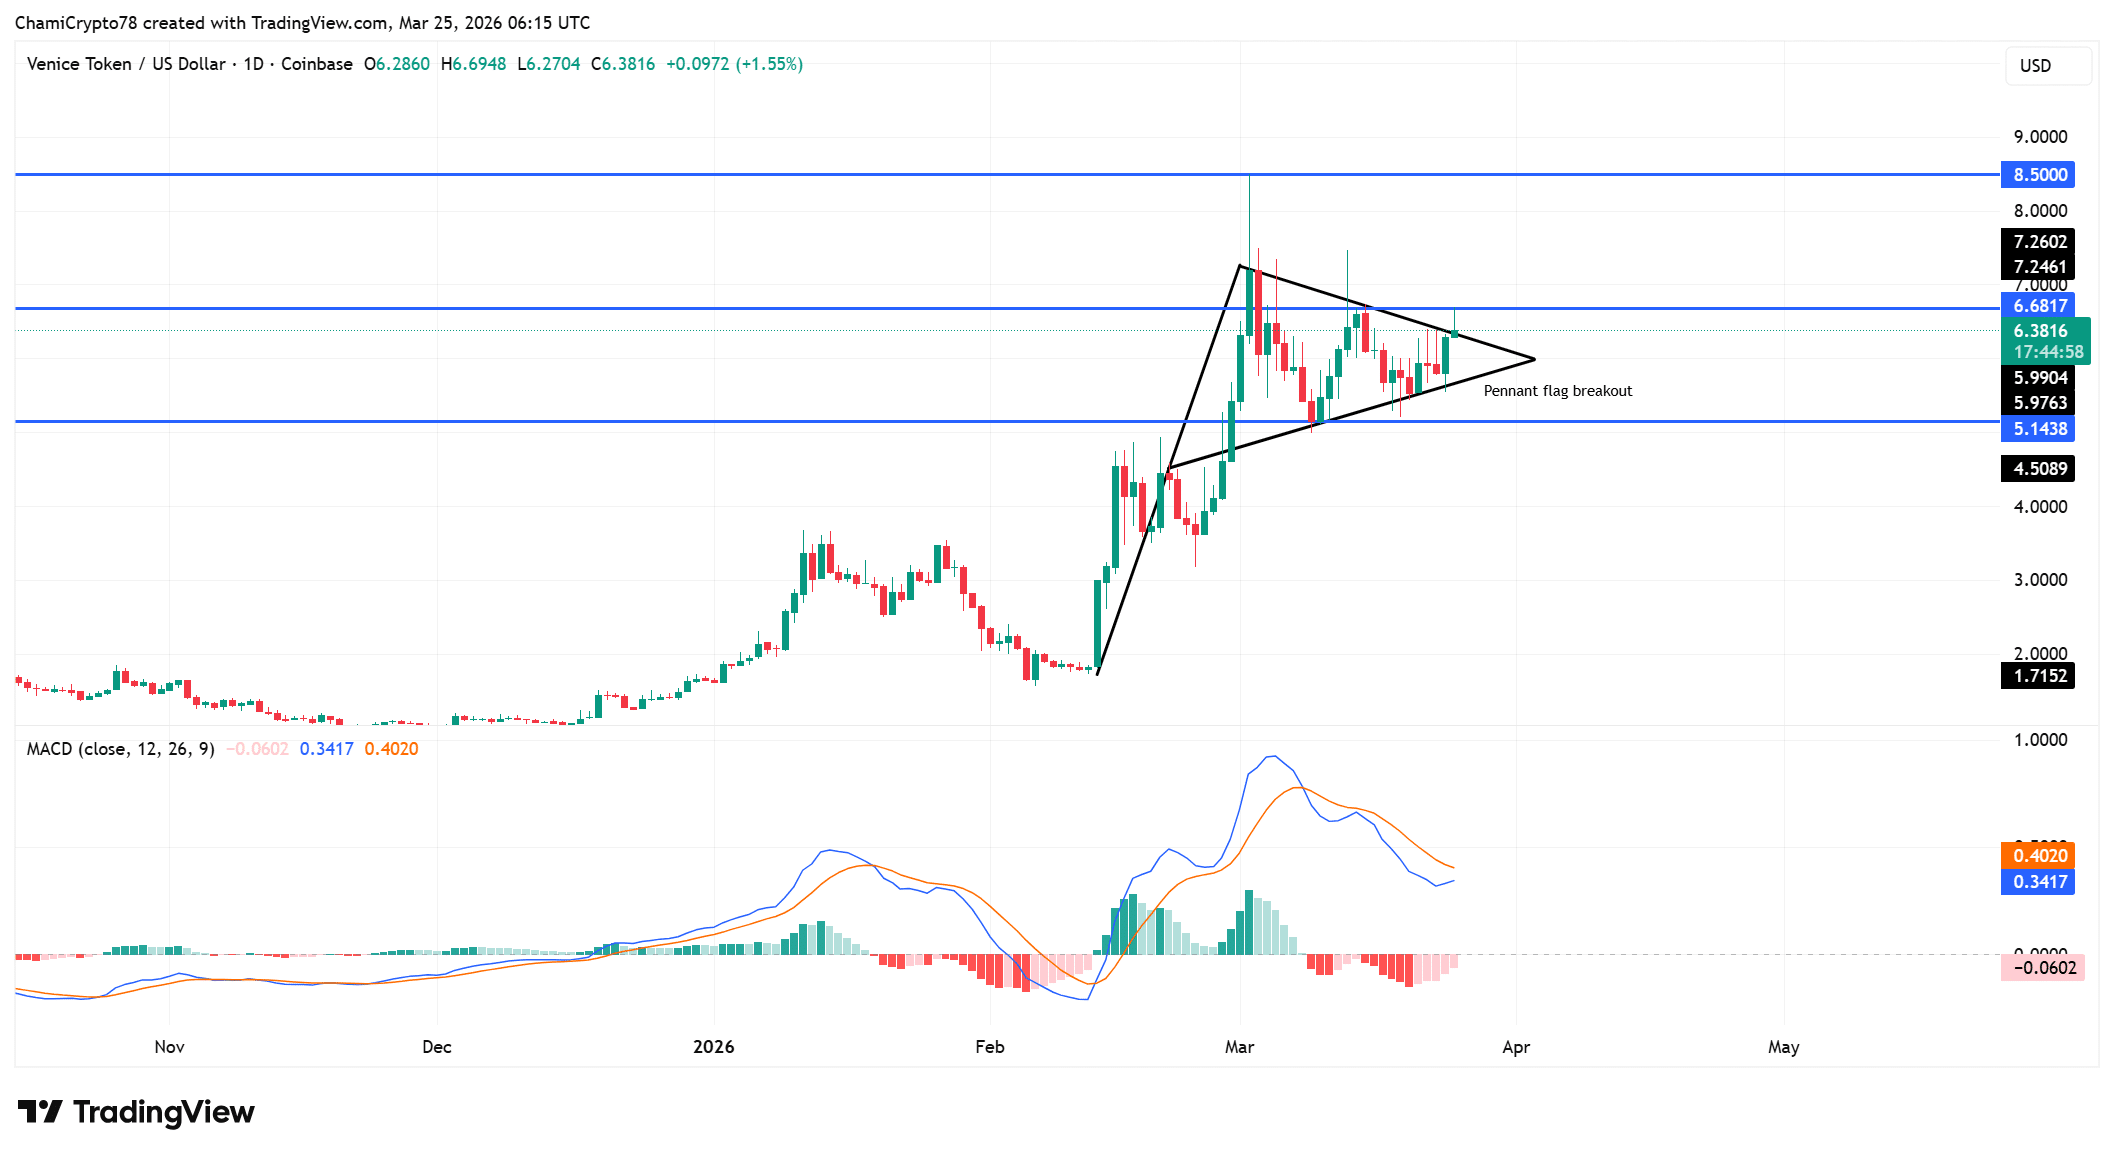
Price has broken out of the pennant flag, ending the prior compression phase and shifting structure toward expansion.

The breakout places immediate resistance at $6.68, while a broader target forms near $8.50 if continuation holds.

Besides, the former consolidation region around $5.14 now acts as a key support base. This transition reflects a shift from indecision into directional control.

However, price now approaches resistance zones where sellers may respond. As a result, holding above the breakout zone remains critical.

If price maintains this structure, the breakout could extend, but failure to hold support would quickly weaken the setup.

The MACD structure shows that bullish strength has not fully aligned with price action.

The indicator has not crossed above the signal line, which limits confirmation of sustained upside pressure.

Additionally, the histogram has turned negative, reflecting weakening strength after the breakout.

This divergence highlights a gap between structural expansion and internal strength. However, price continues holding above key levels, suggesting that buyers still defend the move.

As a result, the current setup reflects early-stage expansion rather than fully confirmed continuation.
Source: TradingView

CVD divergence exposes underlying sell pressure

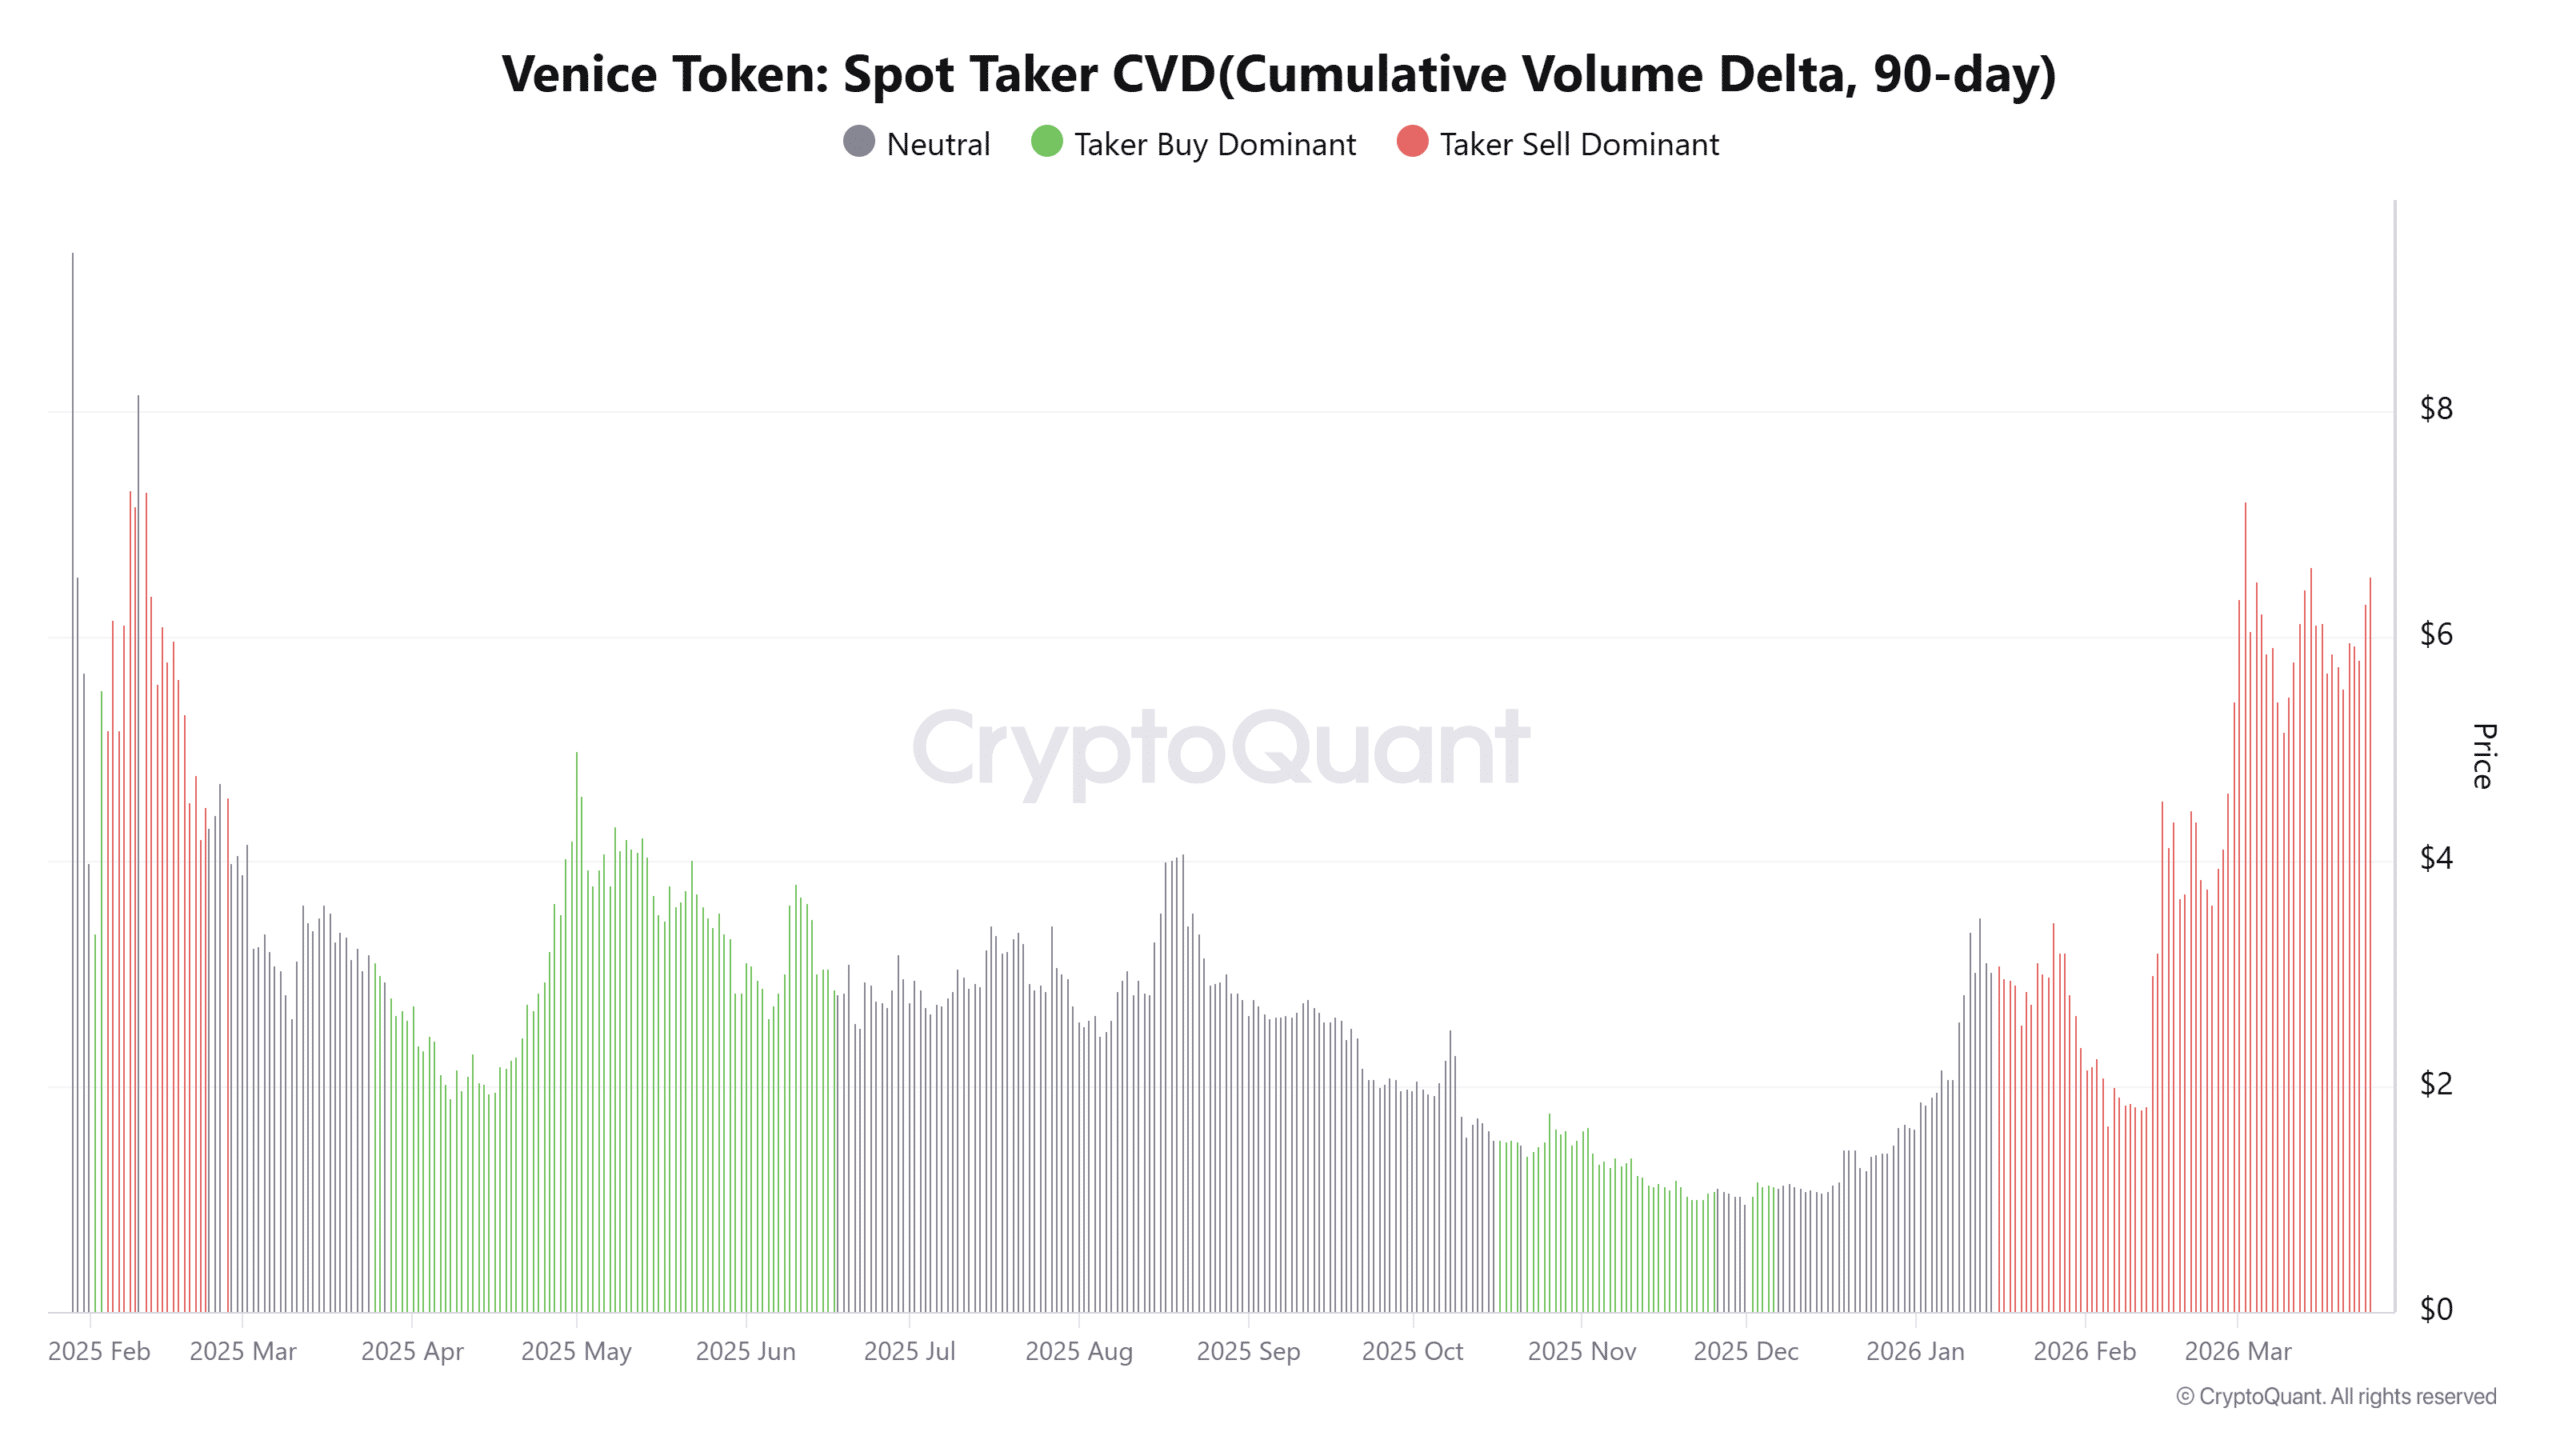
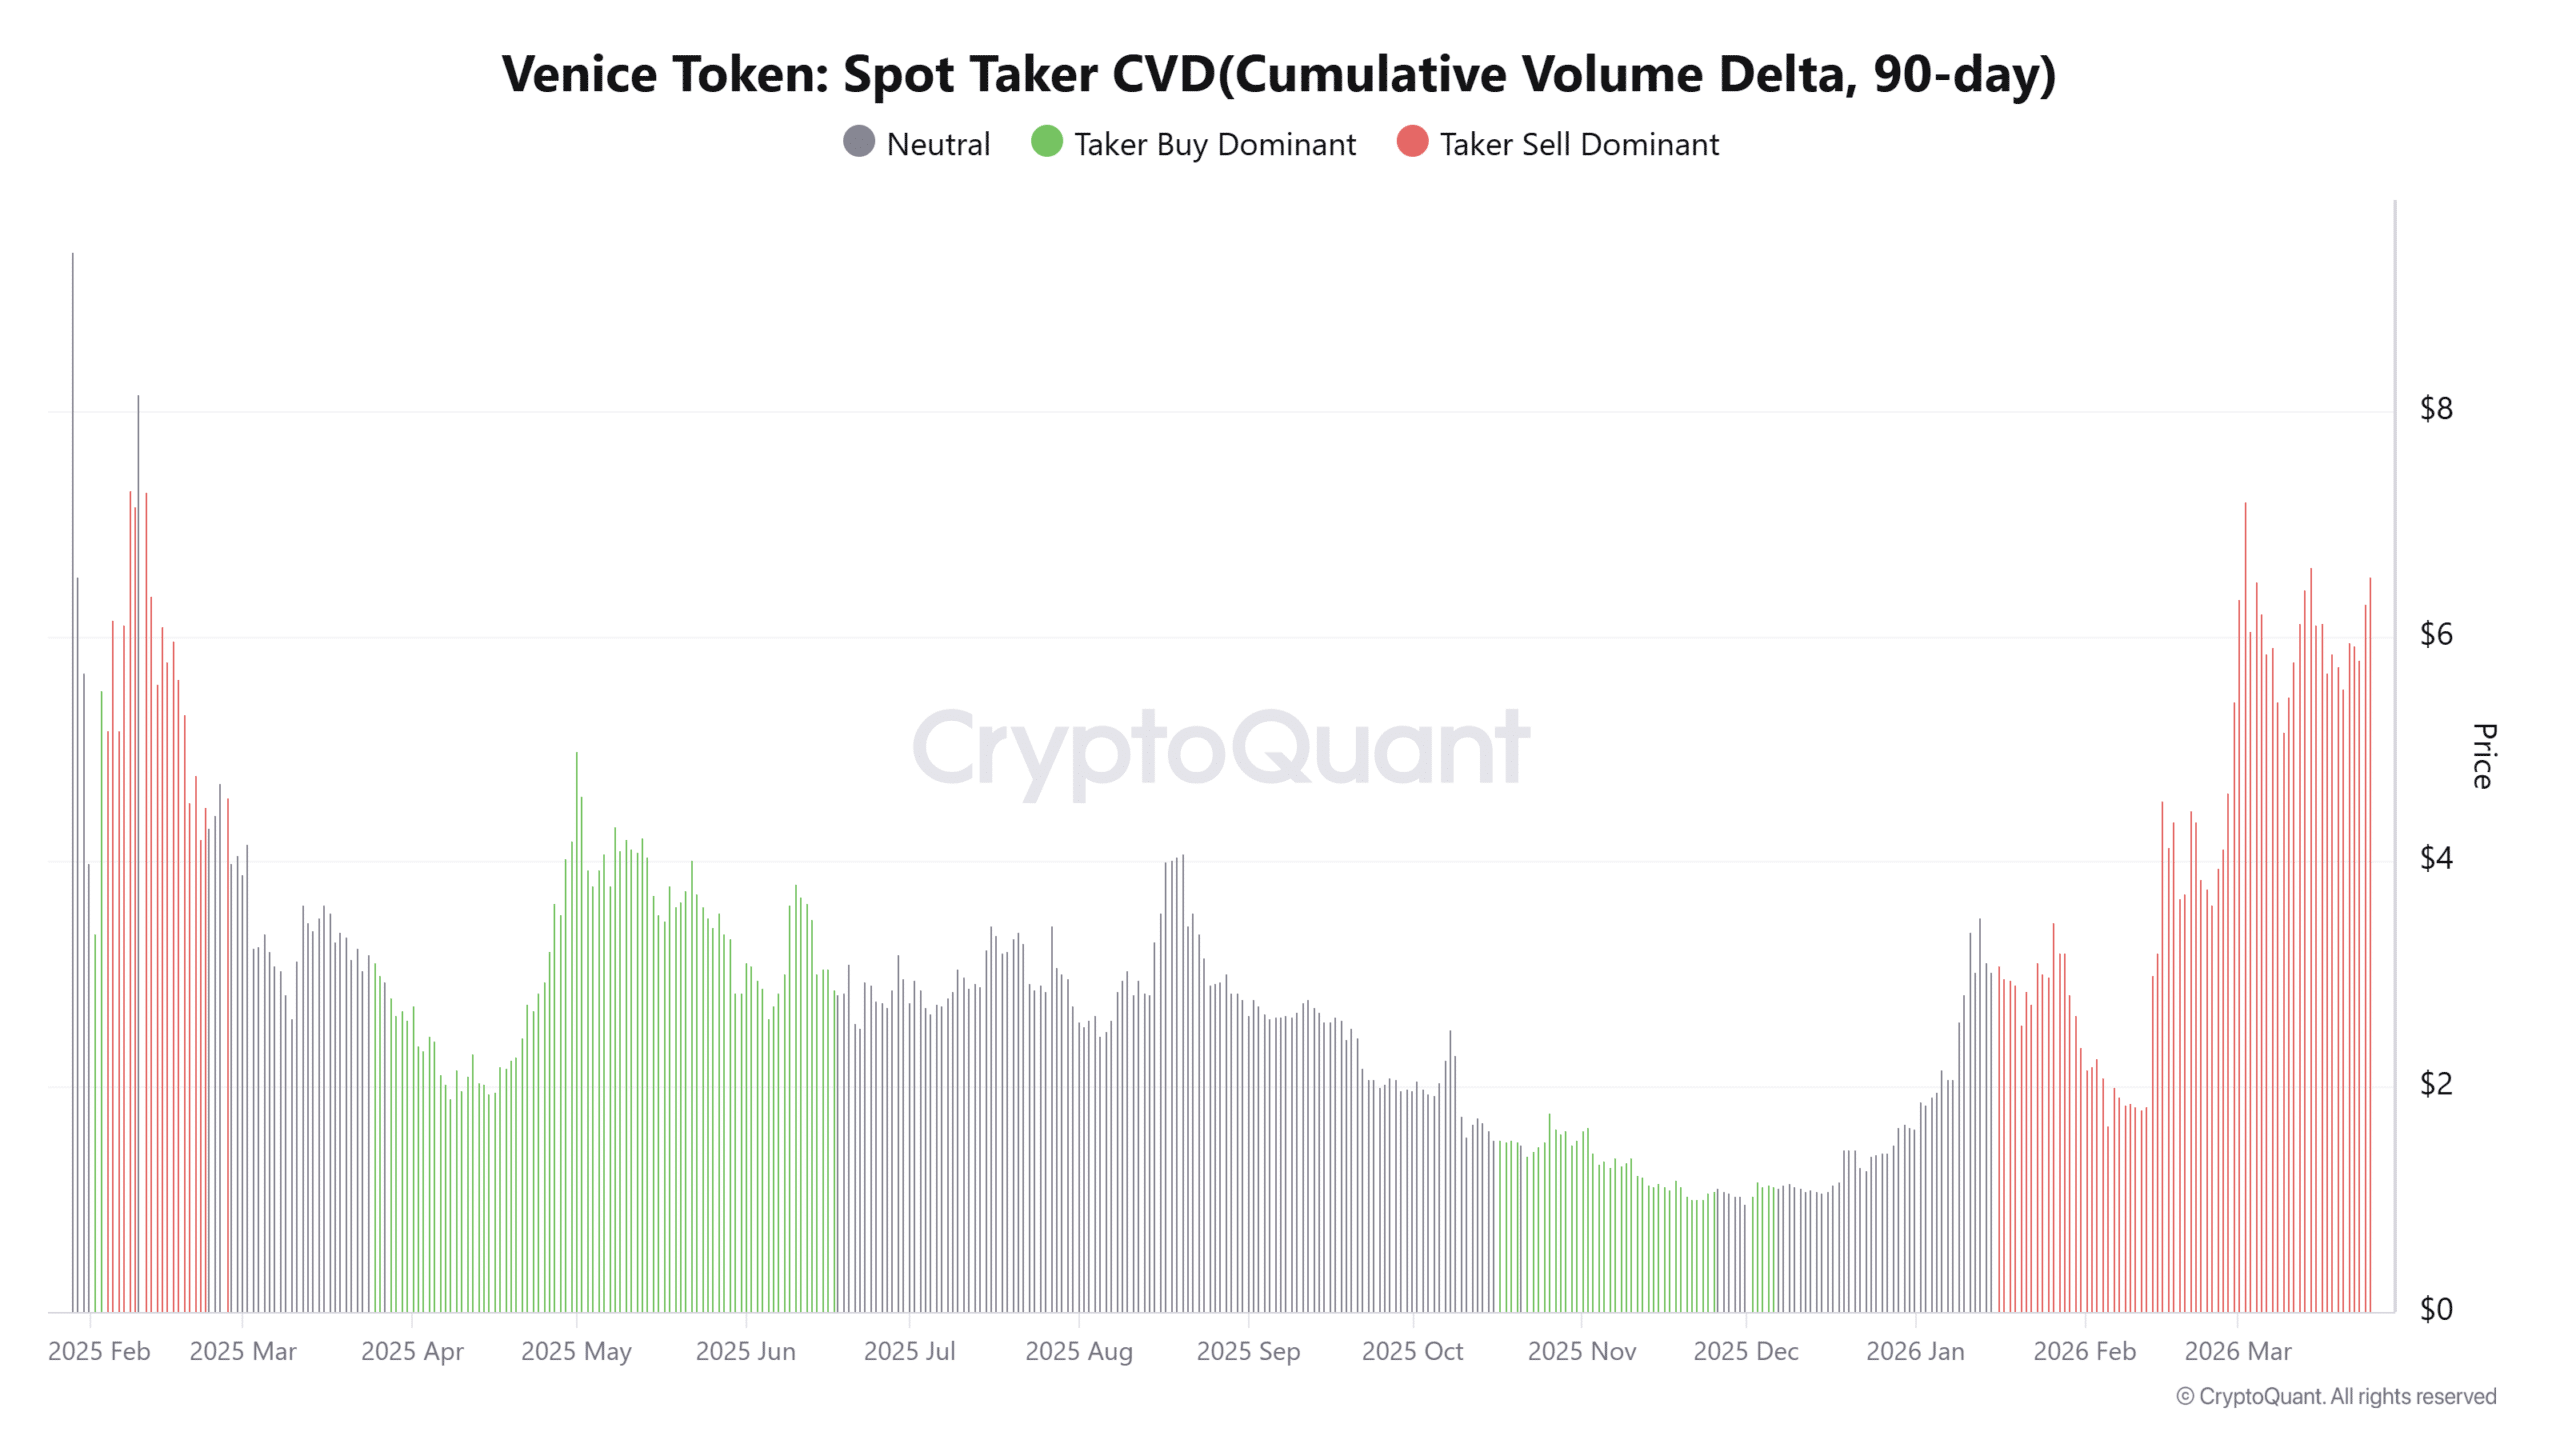
Spot Taker CVD remains sell-dominant over the past 90 days, revealing persistent aggressive selling beneath the rally.

This structure indicates that market participants continue executing sell orders even as price rises.

However, price has not declined, which suggests that larger buyers may be absorbing this supply.

This divergence highlights a key imbalance between visible selling and hidden demand. As a result, the rally depends on continued absorption to sustain upward movement.

If selling pressure intensifies without matching demand, the structure could weaken. However, as long as price holds, this absorption continues supporting the current trend.
Source: CryptoQuant

Open interest rise shows leveraged buildup into VVV breakout

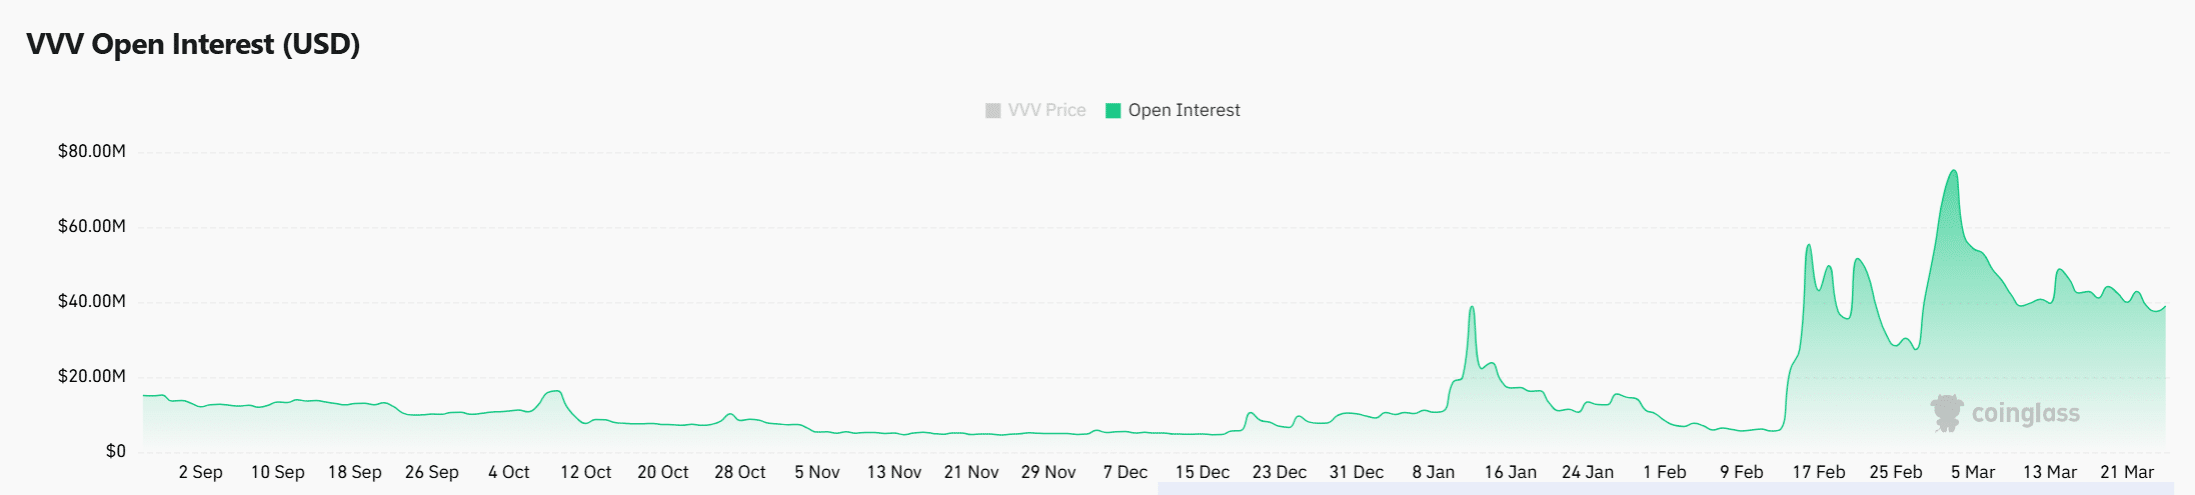
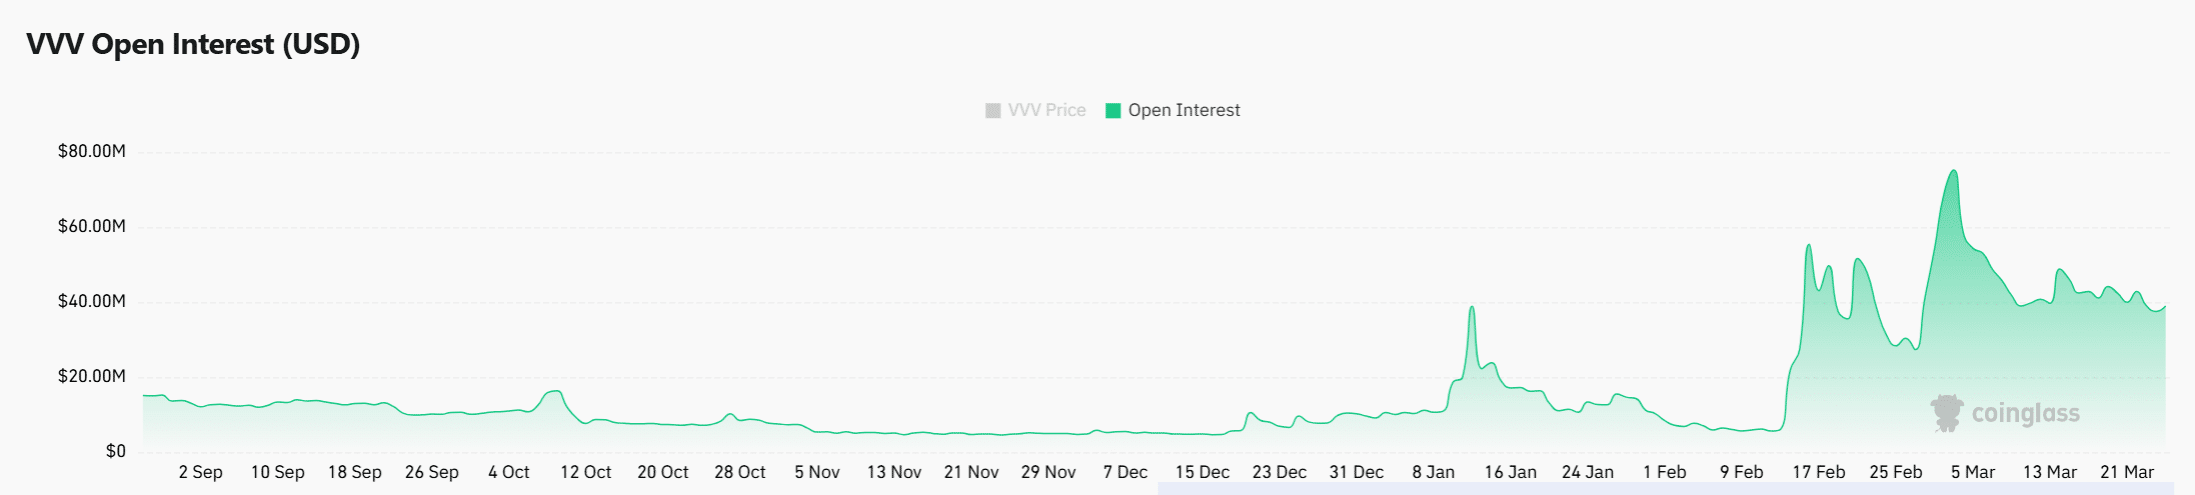
Open interest has increased by 18.74% to $43.21M, reflecting growing participation in derivatives markets.

This rise shows that traders are positioning aggressively as price breaks out of consolidation. However, leveraged positioning introduces volatility, especially near resistance zones.

As positions build, the market becomes sensitive to rapid price movements in either direction. This setup often leads to sharp expansions once liquidity gets triggered.

At the same time, rising open interest without strong confirmation from other indicators increases risk.

If price continues higher, these positions could fuel continuation, but any reversal would quickly unwind these leveraged trades.
Source: CoinGlass


VVV has broken out with strong volume support, which strengthens its bullish structure. However, weakening MACD signals and persistent sell pressure create underlying tension.

The rally can sustain if buyers continue absorbing supply and hold above $5.14. If that support fails, the breakout would likely weaken quickly under pressure.


Final Summary

  • VVV surged 14% to $6.40, backed by a 26% jump in Spot Volume. Breakout above the pennant shifted the structure from consolidation to expansion.
  • Open Interest rose 18%, signaling aggressive leveraged positioning. Rising leverage increases the risk of sharp moves, especially near resistance


Preguntas relacionadas

QWhat is the current price of Venice Token (VVV) and by what percentage has it surged?

AThe current price of Venice Token (VVV) is $6.40, and it has surged by 14.37%.

QWhat key resistance level does the article identify for VVV after its breakout?

AThe article identifies $6.68 as the immediate resistance level for VVV after its breakout.

QAccording to the MACD indicator, what divergence suggests a lack of full confirmation for the upward price movement?

AThe MACD has not crossed above the signal line, and the histogram has turned negative, indicating a divergence between the price expansion and the underlying bullish strength.

QWhat does the persistent sell-dominant Spot Taker CVD indicate about the market activity?

AThe persistent sell-dominant Spot Taker CVD indicates that there is aggressive selling pressure happening beneath the rally, which is being absorbed by larger buyers to sustain the price increase.

QWhy does the rise in Open Interest introduce increased risk for VVV price movement?

AThe 18.74% rise in Open Interest to $43.21M shows that traders are using significant leverage. This introduces volatility and the risk of sharp price movements in either direction, as these leveraged positions could quickly unwind if the price reverses.

Lecturas Relacionadas

El patrón de 'cabeza y hombros' invertido en el gráfico de Bitcoin augura una subida a $67,200

A pesar de la lenta caída a principios de agosto, se está formando un patrón de inversión en los gráficos de precios, incluido el de Bitcoin. Actualmente, el BTC cotiza alrededor de $63,200, formando el hombro derecho de la figura clásica invertida "Cabeza y Hombros". El analista TechCharts, Axel Kibard, señala esto como el único motivo real para el optimismo alcista a corto plazo este mes. La cuestión principal es si los compradores tendrán la fuerza para un impulso decisivo hacia el nivel clave de $67,000. Mientras tanto, en el par ETH/BTC, ya se ha superado al alza un fondo de inversión similar. El principal altcoin se consolida en una tendencia alcista, demostrando que los grandes capitales prefieren actualmente invertir en ETH. Esta rotación de liquidez está agotando a Bitcoin. En cuanto a Ethereum, frente al dólar, está probando con cautela el nivel de $1,875. Si este soporte se mantiene, se abriría un camino directo hacia $2,163. La fuerza relativa de ETH es una buena señal para el mercado en general, pero la situación sigue siendo tensa para los tenedores de Bitcoin. O bien el BTC sigue el ejemplo de Ethereum y confirma el patrón de inversión superando los $67,200, o el patrón no se materializará. Según Kibard, si no se produce un ataque al "cuello" del patrón en los próximos días, los vendedores recuperarán el control y llevarán al Bitcoin hacia niveles de soporte sostenidos en $60,000 y $58,000.

cryptonews.ruHace 2 hora(s)

El patrón de 'cabeza y hombros' invertido en el gráfico de Bitcoin augura una subida a $67,200

cryptonews.ruHace 2 hora(s)

Las acciones de empresas de inteligencia artificial se negocian como 'memecoins', mientras que Bitcoin apenas cambia de precio: revisión de la semana

El artículo comienza con una advertencia de seguridad sobre una vulnerabilidad en las carteras frías Coldcard que podría comprometer las claves privadas, instando a los usuarios a tomar medidas inmediatas. En los mercados financieros tradicionales, la atención se centró en una fuerte venta masiva en el sector de la IA y los mercados asiáticos, especialmente en Corea del Sur, donde el índice KOSPI cayó un 35% en un mes. El fondo "Situational Awareness" de Leopold Aschenbrenner sufrió grandes pérdidas, lo que provocó liquidaciones forzosas y se especula con una posible manipulación por parte de Citadel. Los analistas debaten el futuro del sector de la IA y los semiconductores tras la corrección. En el ámbito macroeconómico, la reunión de la Fed generó preocupación, mientras que Japón intervino para frenar la caída del yen, con resultados limitados hasta ahora. En criptomonedas, el panorama fue negativo: varias plataformas como BitMart anunciaron su cierre, y empresas como Coinbase (COIN) reportaron resultados decepcionantes y despidos. MicroStrategy (MSTR) continuó acumulando reservas en dólares y recompró acciones propias, en una estrategia criticada por algunos. Se destacan debates sobre el futuro de DeFi (como Trade.xyz en Hyperliquid) y posibles actividades de información privilegiada. Finalmente, se menciona un renovado interés de inversores como Jason Calacanis en proyectos de cripto e IA como Bittensor ($TAO), aunque se advierte sobre la precaución necesaria con este tipo de recomendaciones. El artículo cierra reiterando la advertencia sobre la vulnerabilidad de Coldcard y la importancia de la autodeposición y la responsabilidad personal en cripto.

cryptonews.ruHace 2 hora(s)

Las acciones de empresas de inteligencia artificial se negocian como 'memecoins', mientras que Bitcoin apenas cambia de precio: revisión de la semana

cryptonews.ruHace 2 hora(s)

Trading

Spot
活动图片




