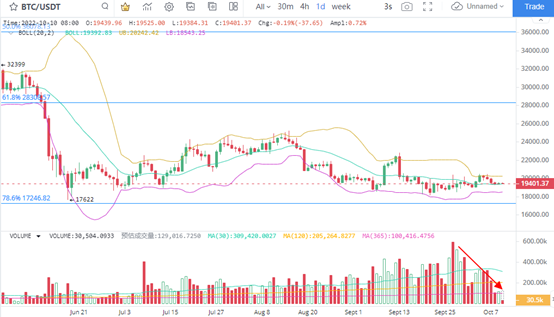
1. BTC shrinkage adjustment or in place
In the daily K line chart of BTC, the trading volume has shrunk for two consecutive trading days during the period when the price sideways moves near the middle track of the Bollinger Line. At the same time, the daily trading volume of BTC has shrunk since September 27, and is now at a very low level. The current trading volume is almost the lowest level since July, so the long short competition has been at the node of the change. At present, the withdrawal of BTC volume is beneficial to short sellers, and the price trend is also inclined to fall.
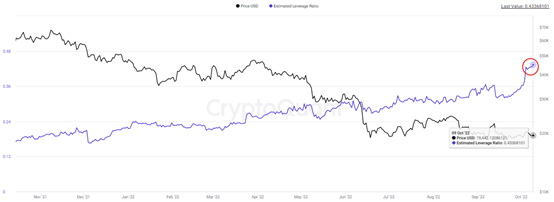
2. BTC estimated that leverage ratio rose significantly
After more BTCs left the exchange recently, the estimated leverage ratio of BTC has been pushed up. The estimated leverage ratio displayed on October 9 has reached a recent high of 0.43, the highest level in two years. This shows that the leverage ratio of investors is rising rapidly, which is beneficial to the change of BTC. In the calculation of estimated leverage ratio, the market value of contract position and spot currency is used to compare, so it is better to judge the leverage ratio of investors. At present, the estimated leverage ratio of investors has risen to a higher position, so it is necessary to pay attention to the possible strong volatility of BTC.
3. ETH volatility drops below 2%
In terms of daily K line, the fluctuation intensity of ETH on October 8 and 9, 2022 is only 1.65% and 1.83%. Obviously, the volatility of ETH has been very low, and the daily trading volume of K-line has also dropped to the lowest level since April 23. It can be seen that the trend of ETH is quite low, indicating that such volume price performance or duration will not be too long, and there will be direction selection signals.
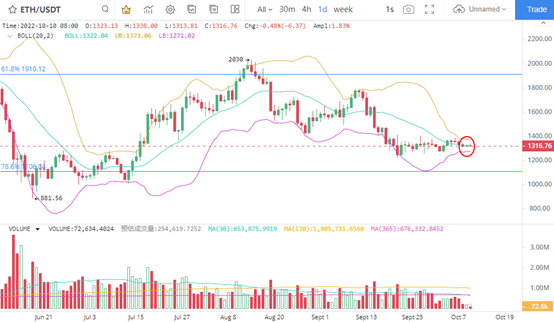
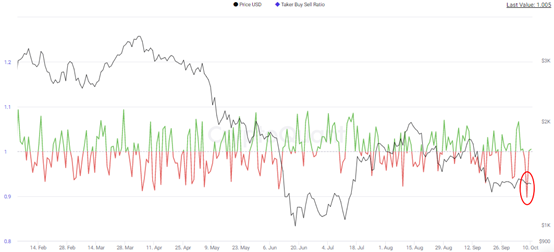
4. A new low of ETH multiple air ratio
In terms of contract positions, ETH's long short ratio fell to its lowest level recently, reaching 0.897 on October 8. Looking back on the long empty performance in the past year, the long empty ratio on November 4, 2021 is 0.895, and the current lowest value is very close to this. At that time, after the long short ratio low point of ETH continued, the price reached a historical peak of $4810 on November 8, 2021, and then the price began to fall continuously. The current situation is similar to this, which means that the risk of ETH rollback is also increasing.
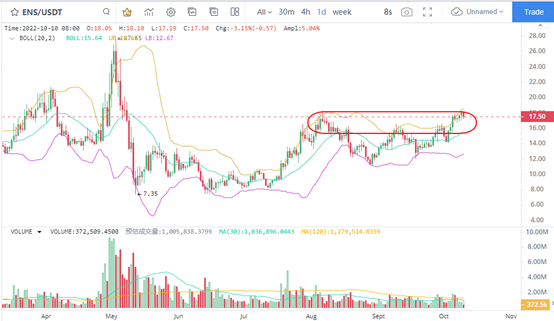
5. ENS has strong short-term performance
With the overall market in the adjustment stage, ENS has a strong price performance. At present, the Japanese K Line has been at a breakthrough point. The trading volume of ENS was stable near USD 17.5, preparing for further price rise.
In terms of data, the number of new domain names registered by ENS in September exceeded 430000, a record high.
According to data from Dune Analytics, the number of newly registered domain names of Ethereum domain name service ENS in September exceeded 430000, reaching 437365, setting a record for the highest number of registered domain names in a month. In addition, the total number of domain names registered by ENS has reached 2642046, which is a good factor for ENS price rise and can continue to be concerned.