Bitcoin price crashed amidst wider sell off, this could be the next stop

newsbtcPublicado a 2022-09-15Actualizado a 2022-09-15

Resumen

Bitcoin price plunged close to 8% over the past day owing to the high Consumer Price Index report. The prices of most altcoins fell on their respective charts after the...

Bitcoin price plunged close to 8% over the past day owing to the high Consumer Price Index report.
""

The prices of most altcoins fell on their respective charts after the CPI showed a 0.1% increase in August, which has now taken the unadjusted value to 8.3%.
""

The annual increase was expected to be 8.1%. Over the last 24 hours, Bitcoin registered a 4% loss.
""

Given that the market is undergoing an extended sell-off, a further fall in BTC’s value could be expected. The technical outlook for the coin was bearish as buyers left the market at the time of writing.
""

Bitcoin price has been struggling at $18,900 for the past month, but it has managed to break through this price level in the last week.
""

Bitcoin has soared past the $22,000 level. The recent blow from the CPI report has pushed the coin downwards.
""

Indicators have chosen to side with the bears given how sellers are dominating the market at press time. The global cryptocurrency market cap today is at $1.04 trillion, with a 2.5% negative change in the last 24 hours.
""

Bitcoin Price Analysis: One Day Chart
Bitcoin Price

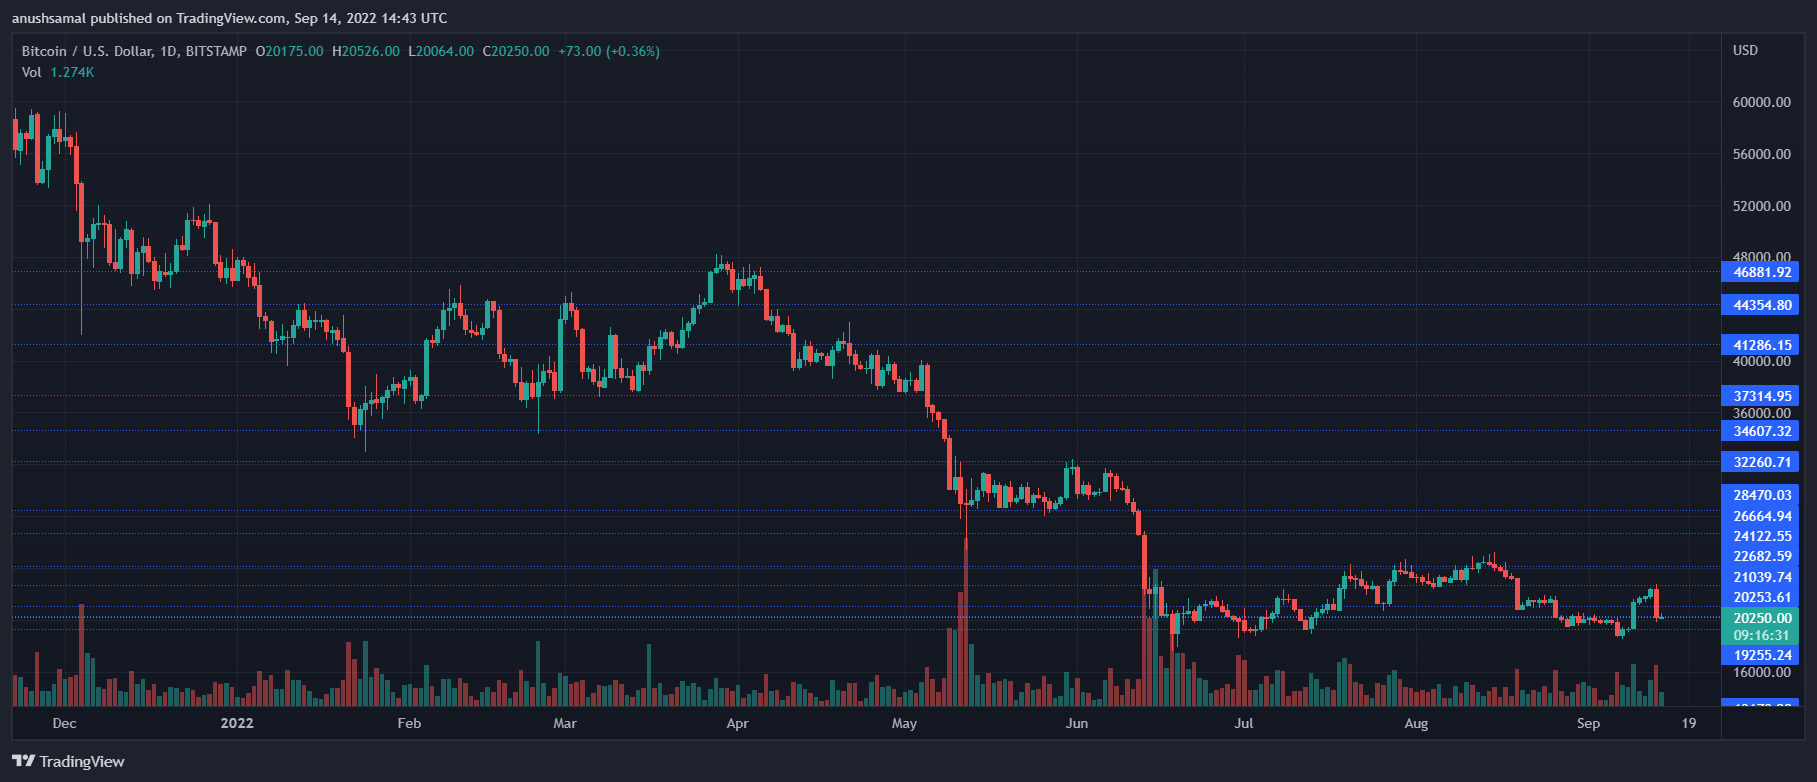
Bitcoin was priced at $20,200 on the one-day chart | Source: BTCUSD on TradingView

""

BTC was trading at $20,200 at the time of writing. The plunge from the $22,000 mark was sudden due to the unanticipated number from the CPI report.
""

Immediate resistance for Bitcoin price was at the $21,000 mark. If BTC manages to topple this level, it can get back to trading above the $22,000 price mark.
""

Local support for BTC was at $19,200. However, with the intense sell-off, the coin could fall to trade near the $18,900 support line.
""

The amount of Bitcoin traded in the past session grew slightly, indicating that there was an influx of buying strength.
""

Technical Analysis
Bitcoin Price

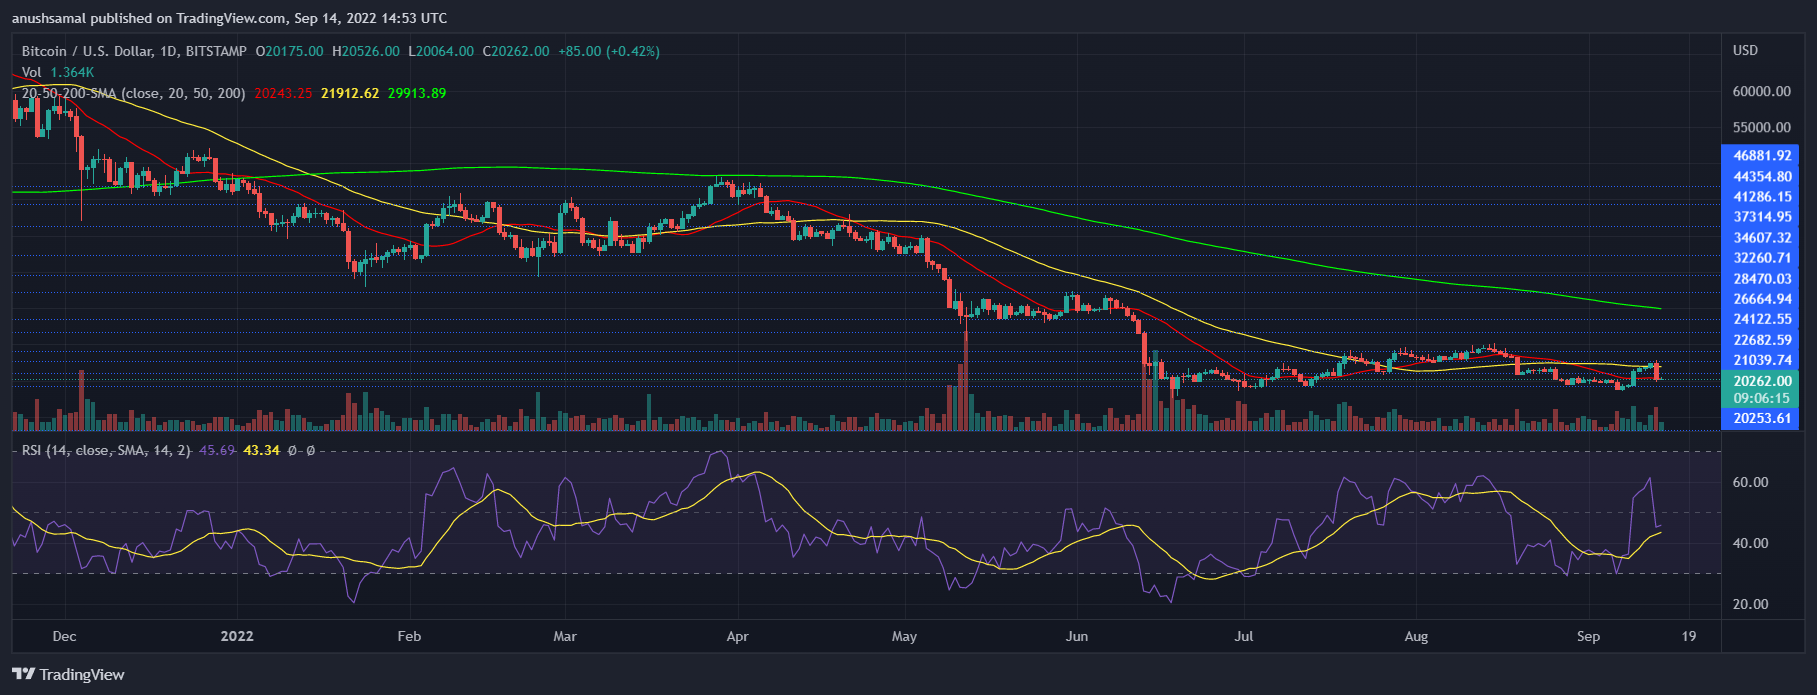
Bitcoin displayed a small uptick in the number of buyers on the one-day chart | Source: BTCUSD on TradingView

""

BTC has registered a sharp fall in buying strength over the last 24 hours. This fall in buyers has further pushed the price near the nearest support line.
""

The Relative Strength Index was seen below the half-line, indicating strong selling strength and, therefore, bea""rishness.

Over the past few trading sessions, RSI noted a small uptick, indicating that the buying strength increased slightly.
""

Bitcoin price just fell through the 20-SMA line, which was also a sign that sellers were driving the price momentum in the market.
Bitcoin Price

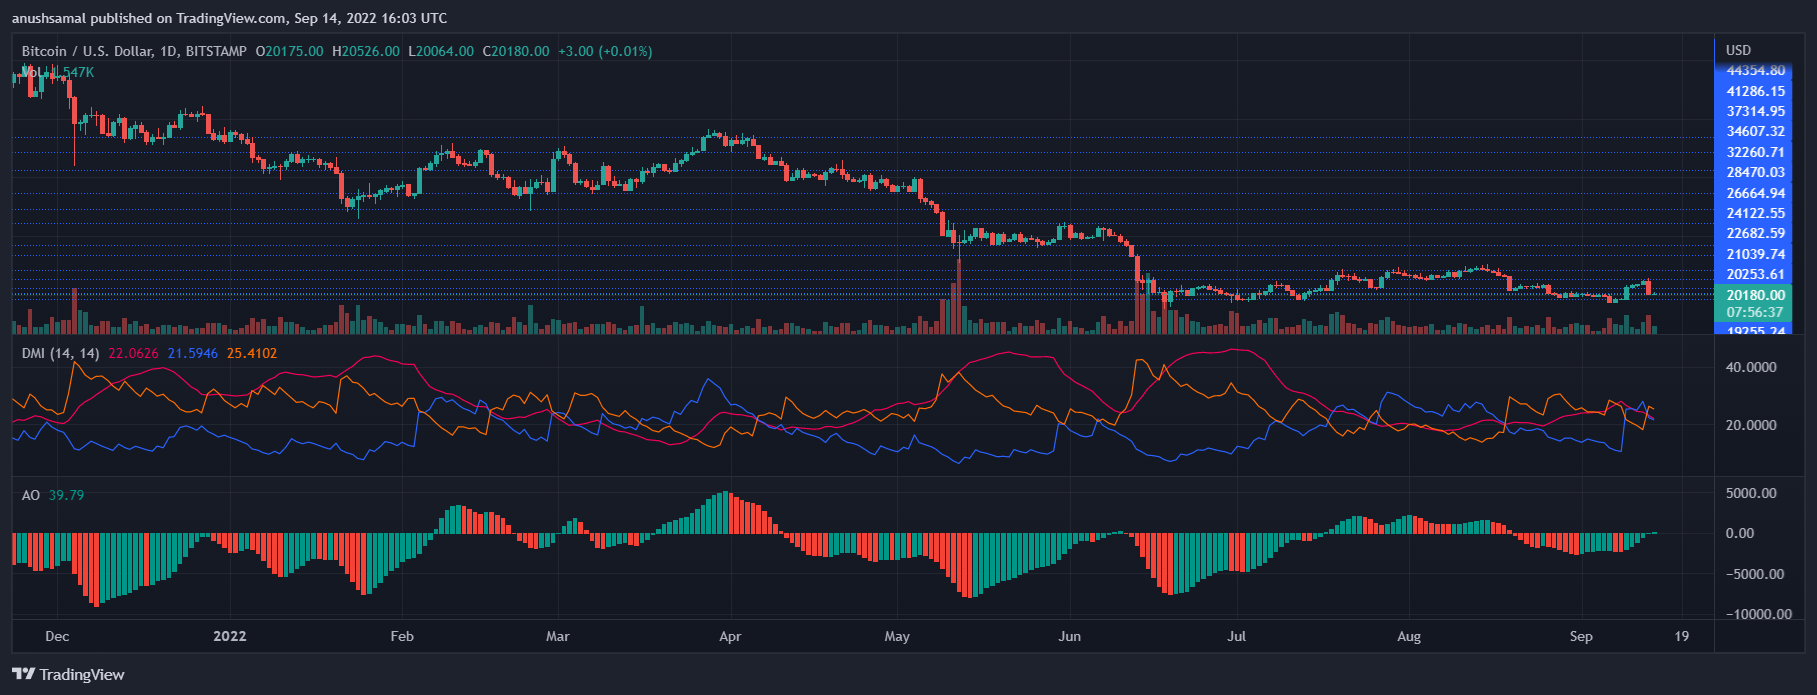
Bitcoin registered buy signal on the one-day chart | Source: BTCUSD on TradingView

""

BTC displayed buy signal despite the market registering a tiny buy signal after buying strength displayed an appreciation.
""

The Awesome Oscillator depicts the overall market strength and the direction of the price. AO climbed above the half-line, indicating that buyers could act on this price action.
""

Even if buyers act on the buy signal, the price of the asset would hardly notice an upward movement. The Directional Movement Index signals the price direction and momentum.
""

DMI was negative as the -DI (orange) line was above the +DI (blue) line. The Average Directional Index (red) was above the 20 mark, which means that the present price direction has gathered strength.


Lecturas Relacionadas

BitMart Research Semanal: Las expectativas de subidas de tipos se intensifican, el mercado general de criptomonedas se consolida tras la volatilidad

**Análisis Semanal de BitMart: Expectativas de subida de tipos presionan, el mercado de cripto se estabiliza con volatilidad** **Mercados macro y tradicionales:** Las acciones estadounidenses cerraron a la baja, lideradas por las tecnológicas y semiconductores, mientras que el petróleo subió un 9.3% tras romperse la tregua en Oriente Medio. Contrariamente, el oro cayó un 1%. Las actas de la FOMC de junio mostraron un tono más agresivo, aumentando las probabilidades de una subida de tipos. Los mercados ahora anticipan una alta probabilidad de al menos un aumento en septiembre. **Mercado Cripto:** BTC subió ligeramente un 0.2%, estabilizándose alrededor de los $64,000, y ETH superó ligeramente a BTC. El sentimiento del mercado mejoró, pero permanece en "miedo". Los ETF de BTC registraron entradas netas por primera vez en ocho semanas, con $197.4 millones, ayudando a detener la hemorragia de ventas institucionales. Sin embargo, el impulso aún es insuficiente para un repunte sólido. La liquidez general de stablecoins permanece limitada. Robinhood Chain vio su TVL superar los $132 millones, impulsado en gran parte por una inyección de capital de Ethena. Michael Saylor's MicroStrategy realizó su primera venta significativa de BTC (3,588 BTC por $216 millones) para pagar dividendos, aunque mantiene una gran reserva. En infraestructura institucional, Swift y varios bancos lanzaron un piloto de libro mayor compartido basado en blockchain, y hay avances en stablecoins reguladas en Asia-Pacífico.

marsbitHace 9 min(s)

BitMart Research Semanal: Las expectativas de subidas de tipos se intensifican, el mercado general de criptomonedas se consolida tras la volatilidad

marsbitHace 9 min(s)

La temporada de Memes llega a Robinhood Chain, pero los 'cosechadores' también están presentes

Robinhood Chain está experimentando un auge de tokens Meme, pero esto ha atraído a estafadores que buscan aprovecharse de los inversores. Se han producido dos incidentes recientes que ilustran el problema. En el primero, atacantes hackearon las cuentas oficiales de SpaceXAI y Starlink en X para promocionar un token falso llamado SCATMAN, inflando su valor antes de vaciar el pool de liquidez y dejar a los inversores con pérdidas. En el segundo, hackers tomaron el control de una cartera de uno de los fundadores de Robinhood, Vlad Tenev, después de una filtración de claves. La utilizaron para comprar un token Meme, lo que generó un frenesí de compras por parte de seguidores que creían que el fundador estaba invirtiendo. La cadena luego congeló la dirección, una medida controvertida que algunos consideran centralizada. Aunque Robinhood Chain se promociona para activos del mundo real (RWA), actualmente su tráfico principal proviene de los Meme. Estos incidentes muestran cómo los estafadores explotan la popularidad, la confianza en figuras prominentes y la psicología del "miedo a perderse algo" (FOMO) para crear bombas de tiempo financieras de corta duración. Destacan las carencias en infraestructura de seguridad, tanto en la cadena como en plataformas como X, y la necesidad de que los inversores verifiquen cuidadosamente los contratos y la liquidez antes de participar.

Foresight NewsHace 13 min(s)

La temporada de Memes llega a Robinhood Chain, pero los 'cosechadores' también están presentes

Foresight NewsHace 13 min(s)

Trading

Spot
活动图片