Bitcoin Volatility Unchanged Amid Dominant Downtrend; HYPE Faces Repeated Tests at Critical Trendline | Guest Analysis

Odaily星球日报Publicado a 2026-07-13Actualizado a 2026-07-13

Resumen

This weekly market analysis updates the outlook for Bitcoin (BTC) and HYPE based on recent price action, largely confirming prior predictions. **Bitcoin (BTC) Analysis:** The report maintains that BTC is in a downtrend but currently within a corrective rebound phase that began from the July 1st low of $57,820. This rebound has reached a key resistance near $64,700. The daily chart shows a developing "descending central zone," suggesting a shift into a consolidation/range-bound phase. The 4-hour chart indicates the rebound may be completing, with proprietary models showing potential short-term topping signals near the current levels. **BTC Trading Strategy (July 13-19):** * **Key Levels:** Resistance is at $64,700, $65,700-$67,300, and $69,500-$71,000. Support lies at $60,950-$62,000, $57,820, and $55,000. * **Mid-term:** The overall structure is bearish. Hold ~20% short positions. Consider increasing shorts to 50% if price rallies to the $65,700-$67,300 zone and shows weakness. * **Short-term:** Use 30% capital for tactical trades. Three scenarios are outlined: 1. **A (Buying Dip):** Consider buying if price drops to $60,950-$62,000 support and shows signs of stabilization. 2. **B (Selling Rally):** Consider shorting if price rallies to the $65,700-$67,300 resistance zone with confirming signals. 3. **C (Buying Higher Low):** Consider buying if, after a breakout above $65,700, a pullback finds support above $57,820. **HYPE Analysis:** HYPE performed as...

In last week's report, based on Bitcoin's daily chart structure, we clearly stated the core judgment that "the oversold rebound phase has begun, and the rebound height will determine the subsequent market direction". We also issued a warning for HYPE, indicating a "significantly high probability of adjustment near the Endpoint 61 (72.97 USD)". This week's market trajectory further validated the effectiveness of our analytical framework: Bitcoin completed the multi-stage rebound as expected and touched a key resistance level, while HYPE met resistance and fell back around 72.97 USD as anticipated, with a maximum drop of 9.39%.

Building upon this, this week's report will provide a detailed breakdown of the potential price paths and specific trading strategies for BTC and HYPE, combining the latest 4-hour and daily chart structures with signals from our proprietary quantitative models.

Summary of This Week's Core Trading Views:

• BTC Multi-timeframe Structure Analysis (Details in Part 1)

• BTC Price Forecast and Mid/Short-term Trading Strategies This Week (Details in Part 2)

• HYPE Hourly Structure Analysis (Details in Part 3)

• HYPE Price Forecast and Short-term Trading Strategies This Week (Details in Part 4)

Market Validation of Last Week's Trading Strategies and Core Views:

• Validation of BTC Forecast: Last week's article clearly stated that Bitcoin had entered a daily-level oversold rebound phase, emphasizing that the height of this rebound would determine the market's subsequent direction. The current market trajectory is developing in line with our prediction.

• Validation of HYPE Forecast: Last week's article indicated a significant probability of HYPE undergoing adjustment near "Endpoint 61" (72.97 USD). Currently, market movements are highly consistent with our judgment.

Part 1: Bitcoin's Structure Analysis from Last Week

1. Bitcoin Daily Chart Structure Analysis: (Based on price action post-May 6th)

Bitcoin Daily Candlestick Chart
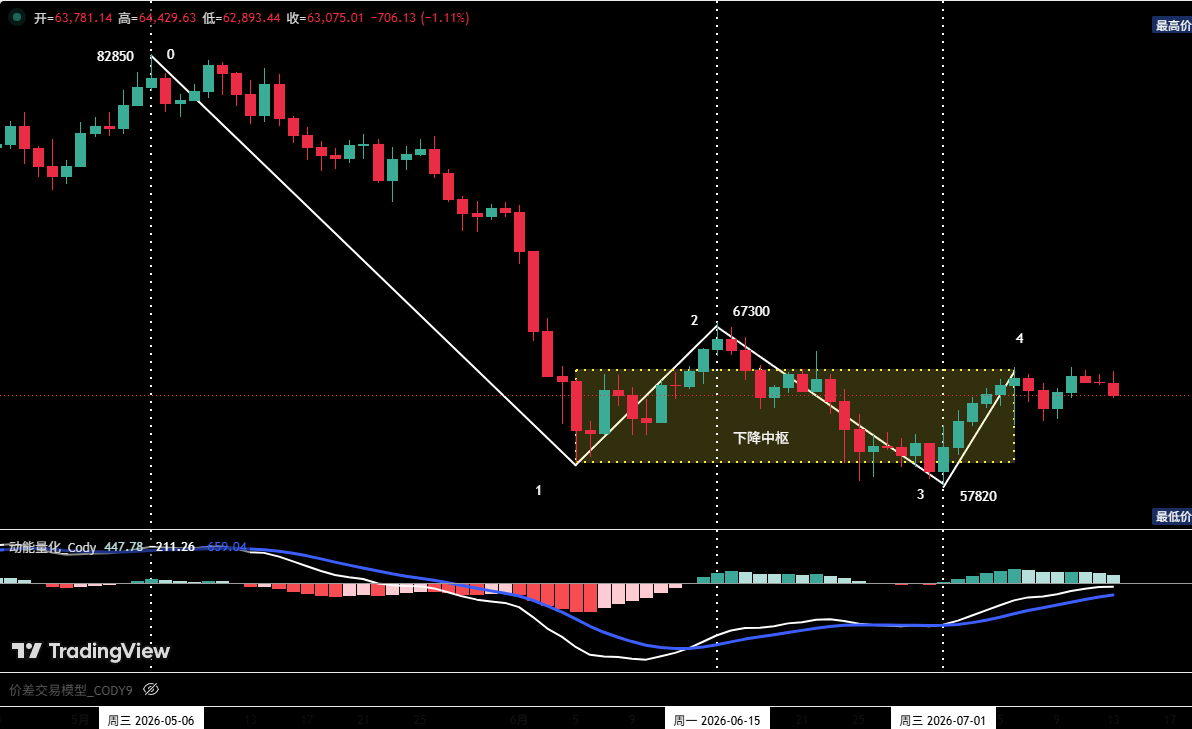
Figure 1

1. As shown in (Figure 1): The corrective move initiated from the May 6th high of $82,850 has presented a four-segment adjustment structure on the daily chart: segments (0-1), (1-2), (2-3), and (3-4).

2. Since touching the low of $57,820 on July 1st, the market is currently developing the rebound segment (3-4), and the price has already broken through the $64,500 resistance level. Last week's commentary explicitly stated: If this rebound first breaks the $64,500 resistance, and then (preferably) breaks the $65,700 resistance, the probability significantly increases for a subsequent stabilization and rebound above the low of $57,820 once the (3-4) rebound segment concludes and corrects.

3. On the daily timeframe, the price overlap across segments (1-2), (2-3), and (3-4) has preliminarily formed a "descending consolidation zone" (as shown in the chart). Based on the above analysis, the market is highly likely to enter a "zone extension" phase next, meaning this "zone" will be composed of five or even more overlapping segments. This signals a short-term market entry into a volatile, range-bound consolidation pattern.

2. In-depth Bitcoin Hourly Structure Analysis: (Using 4-hour as the analysis cycle)

Bitcoin_4-hour Candlestick Chart
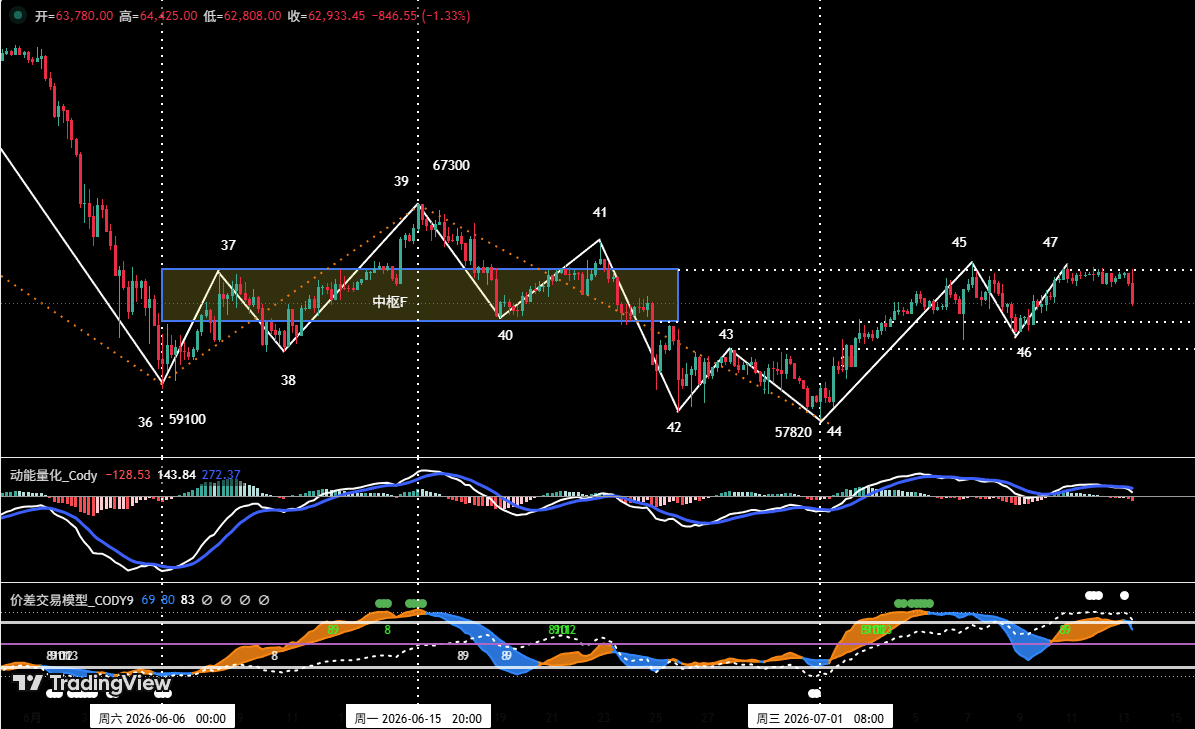
Figure 2

1. On the 4-hour chart, the rebound starting from the July 1st low of $57,820 clearly shows a three-segment structure: (44-45), (45-46), and (46-47).

2. Based on the current structure analysis, the price is in the midst of developing the (46-47) rebound segment. As the local high "Endpoint 47" was being formed, our proprietary "Momentum Quantitative Model" showed a clear bearish divergence signal, and the "Price Difference Trading Model" touched a top warning signal (white dot). Therefore, the probability of a technical correction at the hourly level here is extremely high. If the price corrects as expected, watch for support effectiveness near "Endpoint 46". If signs of stabilization appear around this level, a subsequent rebound will likely occur, with the primary upside target initially being $65,700; if rebound momentum is strong, the next important target is $67,300.

Part 2: Bitcoin Price Forecast and Trading Strategies for This Week (07.13~07.19)

1. BTC Price Forecast for This Week:

This Week's Core View: Focus closely on the price's performance around the key resistance level of $64,700. If a correction occurs as expected, closely observe the effectiveness of support when it falls back near $61,500. Stabilization signals at this level will determine whether the subsequent rebound can continue.

2. Core Resistance Levels:

• First Resistance Zone: $64,700 area (upper bound of previous consolidation zone)

• Second Resistance Zone: $65,700~$67,300 area (previous significant resistance area)

• Third Resistance Zone: $69,500~$71,000 area (previous significant resistance area)

3. Core Support Levels:

• First Support Zone: $60,950~$62,000 area (previous important support area)

• Second Support Level: Near $57,820 (previous important support level)

• Third Support Level: Near $55,000 (previous important support level)

4. Trading Strategies for This Week (Excluding the Impact of Sudden News):

1. Mid-term Strategy: Bitcoin_Daily Candlestick Chart: (Position Monitoring Model)
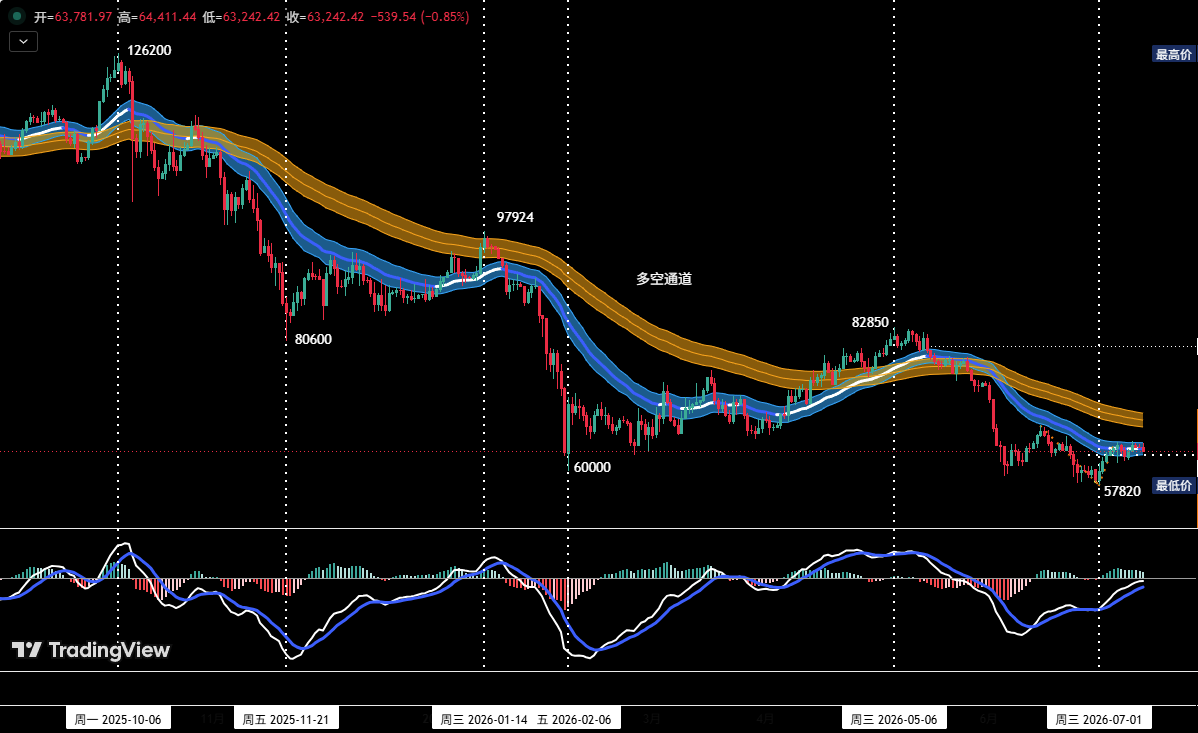
Figure 3

Position Monitoring Model: As shown in (Figure 3), the current price has effectively broken below the "Bull-Bear Channel", confirming a shift to a bear-dominated market structure.

• Current mid-term short positions should be maintained at around 20% for now.

• If the price rebounds to the $65,700~$67,300 area and shows signs of stagnation, combined with top signals from our proprietary quantitative models, consider increasing mid-term short positions to within 50%.

2. Short-term Strategy: Use 30% of capital, set stop-loss points, and look for "price difference" opportunities based on support and resistance levels. (Use 30-minute/60-minute charts as the operation cycle).

3. For short-term operations, to dynamically respond to the market's complex evolution, we have pre-determined three specific contingency plans: A/B/C.

• Plan A: Tentatively go long if support in the $60,950~$62,000 area holds. • Entry: If the price corrects from near $64,700 and, upon falling to the $60,950~$62,000 area, shows signs of stabilization combined with bottom signals from quantitative models, aggressive investors can establish a long position of about 15%. • Risk Control: Set an initial stop-loss. • Exit: Gradually close the position for profit when the price reaches important resistance levels combined with model signals.

• Plan B: Tentatively go short near strong resistance zones. • Entry: If the price rebounds and meets resistance in the $65,700~$67,300 area, combined with top signals from quantitative models, establish a short position of about 30%. • Risk Control: Set an initial stop-loss. • Exit: Gradually close the position for profit when the price adjusts to important support levels combined with model signals.

• Plan C: Lightly test long near strong support zones. • Entry: After the price breaks above $65,700 and then corrects, if signs of stabilization appear above the previous low of $57,820, combined with bottom signals from quantitative models, establish a long position of about 30%. • Risk Control: Set an initial stop-loss. • Exit: Gradually close the position for profit when the price rebounds to important resistance levels combined with model signals.

Part 3: HYPE Hourly Structure Analysis

HYPE_4-hour Candlestick Chart
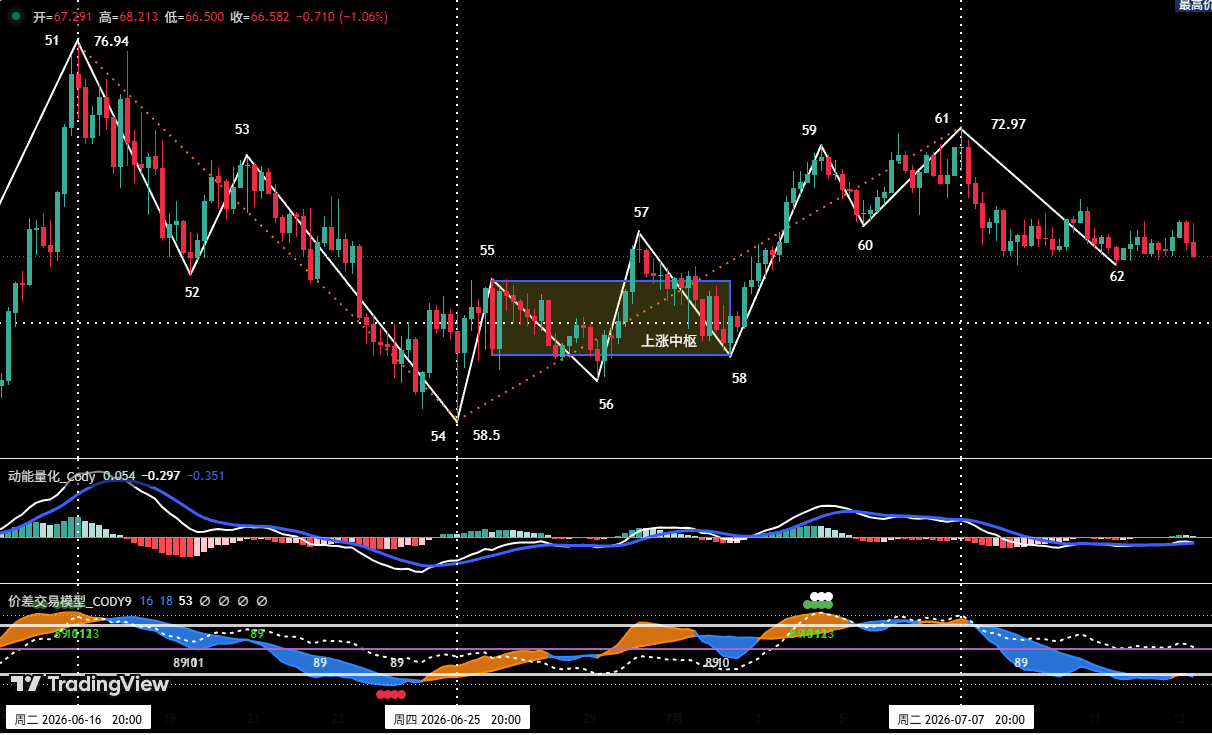
Figure 4

1. As shown in (Figure 4), from the June 25th low of $58.5 (Endpoint 54) to the July 7th high of $72.97 (Endpoint 61), HYPE's move on the 4-hour cycle can be subdivided into a seven-segment upward structure. Among them, segments 55-56, 56-57, and 57-58 overlap to form an "ascending consolidation zone".

2. Last week's commentary pointed out: Since a complete seven-segment upward structure has run from "Endpoint 54 to Endpoint 61", and top warning signals were triggered at "Endpoint 59" and "Endpoint 61" respectively, be alert to short-term adjustment risks. Last week, the market met resistance and began adjusting around $72.97 as expected. During the development of the (61-62) correction segment, the maximum decline was approximately 9.39%.

3. Based on the 4-hour chart analysis, the price is currently developing the (61-62) correction segment. The current "Endpoint 62" has already broken below the previous low "Endpoint 60" ($68.16), which preliminarily damages the structure that has been rising since "Endpoint 54".

Part 4: HYPE Price Forecast and Short-term Trading Strategies This Week

1. HYPE Price Forecast for This Week:

1. Core Resistance Levels:

• First Resistance Level: $68~$69.5 area

• Second Resistance Level: Near $72.97

• Third Resistance Level: Near $76.94

2. Core Support Levels:

• First Support Level: Near $65.5

• Second Support Zone: $60.5~$61.5 area

This Week's Core View on HYPE: Focus on where the current correction "Endpoint 62" concludes, and whether the subsequent rebound height can break through the $72.97 resistance.

2. HYPE Short-term Trading Strategies for This Week: This Week's Short-term Operations: Strategy One: If, after the (61-62) correction segment ends, the price rebounds and breaks the $72.97 resistance—since it would be approaching the strong resistance area of the historical high at $76.94—it is recommended to remain观望 (unallocated/cash).

Strategy Two: Conversely, if after the (61-62) correction segment ends, the price rebound fails to reach $72.97, it is recommended to establish short positions on rallies. Operationally, strict stop-losses must be set, with position size controlled within 30%.

Part 5: Special Reminders:

  1. Upon Entry: Immediately set an initial stop-loss.
  2. When Profit Reaches 1%: Move the stop-loss to the entry cost (breakeven point) to ensure capital safety.
  3. When Profit Reaches 2%: Move the stop-loss to the 1% profit level.
  4. Continuous Tracking: Thereafter, for every additional 1% profit, move the stop-loss up by 1%, dynamically protecting and locking in profits.

Financial markets change rapidly, and all market analysis and trading strategies require dynamic adjustment. All views, analytical models, and operational strategies involved in this article are derived from personal technical analysis, intended solely for personal trading log purposes, and do not constitute any investment advice or operational basis. The market carries risks, investing requires caution. Please do not make decisions based on this content.


Criptos en tendencia

Preguntas relacionadas

QAccording to the article, what is the key price level (in USD) where Bitcoin's rebound met resistance and triggered a technical adjustment?

AThe key resistance level where Bitcoin's rebound met resistance was around 64,700 USD. At this point, the self-built 'momentum quantitative model' showed a clear top divergence signal and the 'price difference trading model' triggered a top warning signal, indicating a high probability of a technical adjustment.

QWhat are the three core operational plans (A, B, C) for Bitcoin's short-term trading strategy outlined in the article?

AThe three short-term Bitcoin trading plans are: Plan A: Test buying (go long) if price finds support in the 60,950-62,000 USD zone. Plan B: Test selling (go short) if price encounters resistance in the 65,700-67,300 USD zone. Plan C: Lightly test buying (go long) if price retreats but finds support above the previous low of 57,820 USD after breaking above 65,700 USD.

QFor HYPE, what was the specific price point (referred to as 'endpoint 61') where it encountered resistance and began a correction last week?

AFor HYPE, the specific price point where it encountered resistance and began a correction was at 72.97 USD, which is referred to as 'endpoint 61' in the analysis.

QWhat is the article's overall medium-term (mid-line) stance on Bitcoin's market structure based on the 'Position Monitoring Model'?

AThe article's medium-term stance on Bitcoin, based on the 'Position Monitoring Model', is bearish. The model shows that the price has effectively broken below the 'Bull-Bear Channel', confirming a market structure shift to one dominated by a downtrend. It recommends maintaining a medium-term short position of around 20%.

QWhat is the critical condition for considering to establish a short position in HYPE according to the weekly strategy?

AThe critical condition for considering a short position in HYPE is if, after the (61-62) correction segment ends, the price rebounds but fails to reach the 72.97 USD resistance level. In this scenario, the strategy suggests establishing a short position on rallies, with strict stop-loss and position control within 30%.

Lecturas Relacionadas

human.tech lanza el Clean SDK para aplicaciones Web3 centradas en la privacidad

human.tech ha lanzado el Clean SDK, un kit de desarrollo que permite crear aplicaciones Web3 con privacidad por defecto y responsabilidad transparente. Este SDK, lanzado junto a Aztec v5, proporciona componentes para integrar verificación de identidad de conocimiento cero, screening de sanciones y transacciones privadas, sin necesidad de manejar datos sensibles o infraestructura de cumplimiento desde cero. El SDK resuelve el dilema entre privacidad y responsabilidad, combinando pruebas de conocimiento cero con verificación programable. Esto permite a las aplicaciones demostrar que los usuarios son legítimos y que los fondos han pasado controles, manteniendo la confidencialidad. Shield, la primera aplicación construida con el Clean SDK, es un puente privado a Aztec. Permite a usuarios y agentes autónomos transferir activos demostrando, sin revelar identidades, que hay una persona real detrás de cada transferencia y que los fondos han sido verificados contra sanciones. El kit incluye tres técnicas de verificación: Prueba de Inocencia (screening contra 23 fuentes de sanciones), Prueba de Personalidad (verificación simplificada con Human Passport) y Prueba de Manos Limpias (credenciales de identidad gubernamental de conocimiento cero para transacciones de alto valor). Diseñado para desarrolladores en Aztec, el SDK permite integrar privacidad programable directamente en aplicaciones descentralizadas. Shield ejemplifica su uso, pero el objetivo es habilitar un ecosistema completo de aplicaciones financieras y servicios descentralizados que requieran verificación respetuosa con la privacidad. human.tech desarrolla soluciones de conocimiento cero para demostrar personalidad, mantener la privacidad y crear sistemas digitales escalables y responsables, con un ecosistema que incluye también Human Passport, Wallet as a Protocol (WaaP) y Human Network.

TheNewsCryptoHace 26 min(s)

human.tech lanza el Clean SDK para aplicaciones Web3 centradas en la privacidad

TheNewsCryptoHace 26 min(s)

¿Liberando 100 millones de dólares en liquidez? La nueva política de Pump.fun pone a prueba la técnica del 'pump' de 5 minutos

**Resumen en español europeo: Pump.fun lanza el modo BOOST para redirigir 1.000 millones de dólares en liquidez "inerte"** El 21 de julio, Pump.fun anunció oficialmente el modo BOOST, un nuevo mecanismo por defecto para el lanzamiento de memecoins. El objetivo es abordar un problema central de su plataforma: aproximadamente el 20% de la liquidez que se bloquea en los pools (LP) cuando un token se migra desde su curva de enlace (bonding curve) queda permanentemente inutilizable, incluso si el precio del token cae a cero. La plataforma estima que esta "liquidez muerta" supone un desperdicio de más de 1.000 millones de dólares anuales. El funcionamiento de BOOST es directo: en lugar de inmovilizar ese 20% de fondos en el LP, la plataforma los utiliza durante los primeros 5 minutos tras la migración para comprar el propio token en el mercado secundario mediante un sistema TWAP (Precio Medio Ponderado en el Tiempo). Todos los tokens comprados se queman inmediatamente, creando presión de compra a corto plazo y reduciendo permanentemente la oferta en circulación. Este cambio no añade liquidez externa ni altera la experiencia de trading en la bonding curve. Su propósito es mejorar la experiencia post-migración: generar un "fuego artificial" de 5 minutos que podría aumentar la retención de traders y la actividad comercial. La lógica subyacente es que para que el modelo de negocio de Pump.fun sea sostenible, los tokens lanzados necesitan generar volumen de trading continuo después de su lanzamiento inicial. Sin embargo, el mecanismo genera debate. Los críticos señalan que el breve impulso de 5 minutos podría facilitar que proyectos de baja calidad parezcan exitosos, fomentando lanzamientos más especulativos. Además, una vez finalizada la compra automática, los tokens podrían sufrir caídas bruscas si se enfrentan a grandes órdenes de venta, intercambiando el riesgo de un colapso posterior por una breve ilusión de bombeo inicial.

marsbitHace 33 min(s)

¿Liberando 100 millones de dólares en liquidez? La nueva política de Pump.fun pone a prueba la técnica del 'pump' de 5 minutos

marsbitHace 33 min(s)

Vender espacio de bloques está muerto: las blockchains públicas deben encontrar nuevas formas de sobrevivir

El modelo de negocio de vender espacio en bloques para las cadenas públicas (L1/L2) está en crisis. Mientras aplicaciones y otros proyectos generan grandes ingresos, la mayoría de las blockchains luchan por monetizar. Un ejemplo claro: Hyperliquid generó unos 58 millones de dólares en 30 días, frente a los 430.000 de Arbitrum. La conclusión es clara: las cadenas públicas deben evolucionar más allá de ser infraestructuras neutrales. El futuro está en convertirse en estudios de productos, distribuidores de aplicaciones, pasarelas de pago o soluciones SaaS especializadas para nichos verticales específicos. El artículo también analiza otros temas clave: 1. **El ataque a Ostium:** Un fallo en su infraestructura off-chain para importar precios permitió a un atacante robar más de 23 millones de USDC, reduciendo su TVL en más del 40%. Este caso subraya los riesgos críticos al conectar mercados tradicionales con DeFi. 2. **El futuro de las opciones on-chain:** Para lograr adopción masiva, los derivados complejos como las opciones deben dejar de comercializarse como tales. El éxito reside en abstraer su complejidad en productos sencillos como bóvedas de rendimiento, opciones binarias a corto plazo o productos estructurados, donde el usuario final solo ve el resultado, no la mecánica. En resumen, la industria se mueve hacia una especialización profunda, donde la seguridad, la experiencia de usuario simplificada y un claro enfoque en generar valor para clientes específicos serán claves para la supervivencia y los ingresos.

marsbitHace 52 min(s)

Vender espacio de bloques está muerto: las blockchains públicas deben encontrar nuevas formas de sobrevivir

marsbitHace 52 min(s)

Notas de Podcast|En conversación con el director de gestión de activos de GSR: Para saber si este repunte de criptomonedas es real o falso, basta con observar las tasas de interés de préstamos en Aave

Resumen del podcast: En conversación con Andy Baehr, Director General de Gestión de Activos de GSR, se analiza si el actual repunte del mercado cripto es real o efímero. Baehr describe el mercado actual como en un estado de "ambivalencia", con rebotes cortos que carecen de convicción y momentum sostenido. Destaca tres señales clave a seguir: 1. **Tipos de interés en DeFi (ej. Aave)**: Actualmente, los tipos para stablecoins como USDC rondan el 3.75%, similares a los bonos del Tesoro estadounidense. La ausencia de un diferencial por riesgo ("credit spread") indica poca demanda de apalancamiento, señal de baja energía en el mercado. Un aumento repentino sería un indicador claro de una recuperación genuina con mayor apetito por el riesgo. 2. **Consenso sobre el "pico de medidas restrictivas" de la Fed**: El mercado necesita alcanzar un "Fed Solstice", el momento en que se perciba claramente el fin del ciclo de subidas de tipos. Hasta entonces, cualquier rebote es vulnerable. 3. **Posible aprobación de la CLARITY Act**: Su probabilidad ha caído del 75% al 40%. Si se aprueba antes del 7 de agosto, sería una sorpresa positiva que probablemente impulse los precios. Baehr también señala la falta de compradores estructurales actuales, como los fondos ETF (cuya salida de capitales es notable) o las empresas del tesoro con cripto (DAT), que suelen entrar más tarde en un ciclo alcista. Concluye que, para que el rebote sea sostenido, se necesita un nuevo aumento del apalancamiento, visible a través de los tipos de DeFi.

marsbitHace 1 hora(s)

Notas de Podcast|En conversación con el director de gestión de activos de GSR: Para saber si este repunte de criptomonedas es real o falso, basta con observar las tasas de interés de préstamos en Aave

marsbitHace 1 hora(s)

Trading

Spot

Artículos destacados

Cómo comprar HYPE

¡Bienvenido a HTX.com! Hemos hecho que comprar Hyperliquid (HYPE) sea simple y conveniente. Sigue nuestra guía paso a paso para iniciar tu viaje de criptos.Paso 1: crea tu cuenta HTXUtiliza tu correo electrónico o número de teléfono para registrarte y obtener una cuenta gratuita en HTX. Experimenta un proceso de registro sin complicaciones y desbloquea todas las funciones.Obtener mi cuentaPaso 2: ve a Comprar cripto y elige tu método de pagoTarjeta de crédito/débito: usa tu Visa o Mastercard para comprar Hyperliquid (HYPE) al instante.Saldo: utiliza fondos del saldo de tu cuenta HTX para tradear sin problemas.Terceros: hemos agregado métodos de pago populares como Google Pay y Apple Pay para mejorar la comodidad.P2P: tradear directamente con otros usuarios en HTX.Over-the-Counter (OTC): ofrecemos servicios personalizados y tipos de cambio competitivos para los traders.Paso 3: guarda tu Hyperliquid (HYPE)Después de comprar tu Hyperliquid (HYPE), guárdalo en tu cuenta HTX. Alternativamente, puedes enviarlo a otro lugar mediante transferencia blockchain o utilizarlo para tradear otras criptomonedas.Paso 4: tradear Hyperliquid (HYPE)Tradear fácilmente con Hyperliquid (HYPE) en HTX's mercado spot. Simplemente accede a tu cuenta, selecciona tu par de trading, ejecuta tus trades y monitorea en tiempo real. Ofrecemos una experiencia fácil de usar tanto para principiantes como para traders experimentados.

670 Vistas totalesPublicado en 2024.12.11Actualizado en 2026.06.02

Cómo comprar HYPE

Discusiones

Bienvenido a la comunidad de HTX. Aquí puedes mantenerte informado sobre los últimos desarrollos de la plataforma y acceder a análisis profesionales del mercado. A continuación se presentan las opiniones de los usuarios sobre el precio de HYPE (HYPE).

活动图片