1. BTC short line retraction, urgent need to pull up the variable disk once
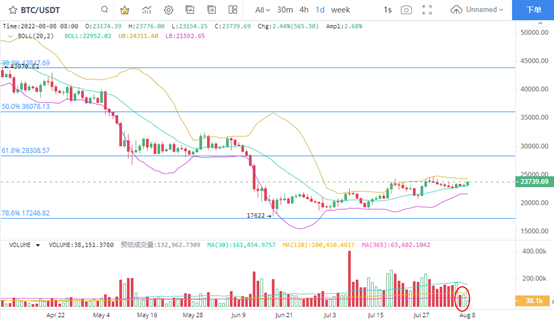
In the daily K-line chart, the BTC short-term contraction for two consecutive trading days indicates that the price can not maintain the current change of hands. If BTC fails to change its position in the short term and the price increase is limited, more selling pressure will suppress the price increase. At present, BTC needs to pull up the market once, so as to undertake the market entry energy of recent investors. In the past month, BTC's spot trading volume has remained at a high level. Meanwhile, more turnover orders have been accumulated in the chain trading volume, which means that BTC has strong shock demand. If the current price trend can be maintained, it is expected that there will be a continuous performance opportunity on the increase.
2. The transaction volume on the chain remained stable
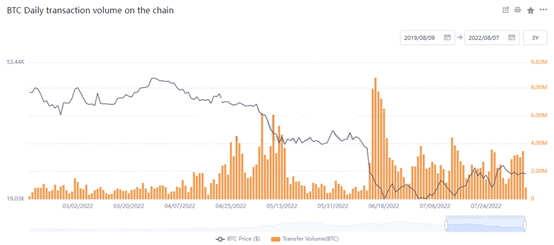
BTC's online trading volume is very strong. The online trading volume in the recent five trading days is very stable, which is the most stable interpretation of the average online trading volume after June 20. That is to say, BTC's online trading volume is very active at present, and investors' transfer frequency is very high, which means that the support for the price is still effective. Judging from the transfer direction, it is relatively difficult to judge the trading intention of investors. However, judging from the activity, BTC can still maintain the current fluctuation rhythm.
3. The number of large value transactions continued to decline
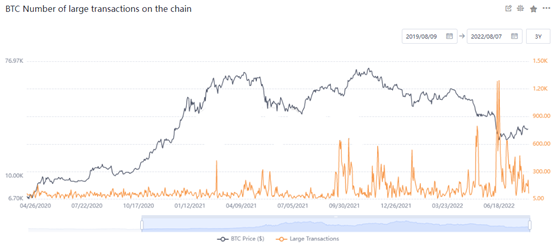
The number of large value transactions of BTC continued to retreat, and the current value has dropped to 64 on August 7, indicating that the price may continue to fluctuate and strengthen in the short term. The decrease in the number of major large transactions means that the dominant power of the giant whale traders to the market is weakened, and BTC is in a stage of having to change its market. Judging from the number of large transactions of BTC, the current number of large transactions is near the low level of the year. Looking back at the performance of large-scale transactions in the past year, it is more likely that the market will continue the current trend after the number of large-scale transactions decreases.
At present, the short-term trend of BTC price is in a rebound state, and there is no change in the medium and long-term callback trend. In terms of rebound pressure level, focus on the selling performance of US $28308 corresponding to 61.8% of Fibonacci.
4. Eth trading volume continues to be depressed
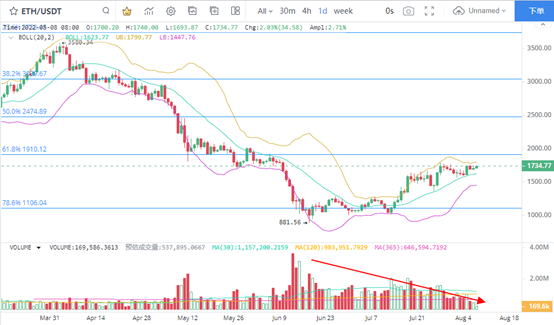
The shrinking trend of the trading volume of eth is relatively clear, and the trading volume has been at the low level in the past three months, indicating that the trading boom caused by the accelerated decline of eth has been cooling down. Based on this judgment, ETH clearly needs to pull up the bulls under the key pressure level of 61.9% Fibonacci corresponding to US $1910, so as to further confirm the strong price. In terms of operation, it is clear that the opportunities for buying eth at a low price are significantly reduced, the market uncertainty is enhanced, and the trading level is aware of risks.
5. The activity of eth sending address is strong
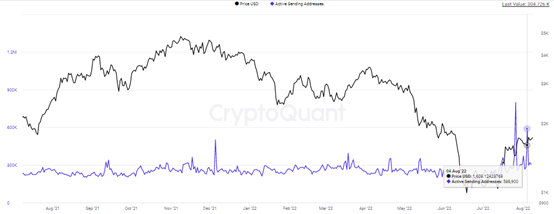
The number of addresses sending eth shows signs of activity. Through judging the activity on July 26 and August 4, the number of active addresses on the two trading days can reach 799000 and 599000 respectively. The number of active addresses corresponding to the same period can reach 934000 and 734000 as a whole.. In other words, the number of active addresses is more than the number of addresses that send eth, and the activity increases sharply. Although the trading intention of sending eth is unknown, more eth addresses may be sold. In terms of trading, we can pay attention to the risk of price pullback in the near future.