[Key interpretation] BTC whale participation drops, ETH short-term brewing rebound

Huobi ResearchPublicado a 2022-06-24Actualizado a 2022-06-27

Resumen

In the 4-hour K-line chart, as the short-term fluctuation of BTC price narrows.

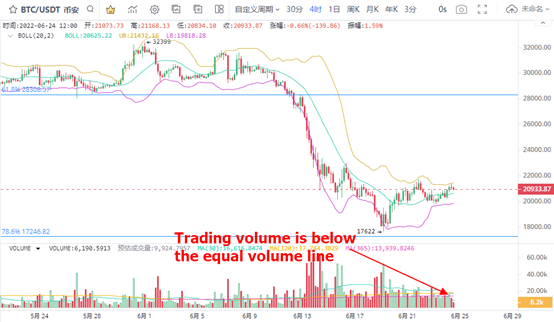
1、 BTC transaction volume continues to shrink

In the 4-hour K-line chart, as the short-term fluctuation of BTC price narrows, the direction selection needs to start during the closing period of brin line. The brin line is closed to a narrow range of $19819 to $21416, with a span of $1597. Judging from the rebound in the number of new addresses, the number of new addresses on June 14 reached a recent high, corresponding to a large selling pressure of $22500. The number of new addresses rebounded, and the corresponding investors' holding points were confirmed. The selling pressure continued to exist in the near future until it exceeded $22500 upward.

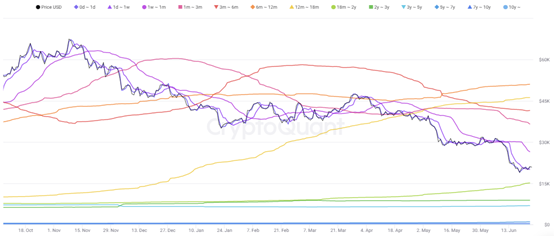
2. BTC has realized cost up

During the trading period, the holding cost of investors will continue to move, while the holding cost price of long-term investors is low and will move up in the price shock stage. Therefore, recently, we have paid attention to the cost trend of BTC in the horizontal consolidation stage. The cost price of the main cash holding investors with a cash holding address of 18 to 24 months is lower than the current BTC current price. Therefore, the currency holding trend of some investors largely determines the rise and fall of BTC. The cost price of 18 to 24 month investors is the cost price of long-term investors holding currency closest to the current BTC price. On June 23, the cost price rose to $15117, a difference of $5793 from the current $20900. Upward, it is noted that the cost price of investors who hold money for one week to one month has dropped to US $26495. Therefore, the fluctuation space of BTC will still be around us $15117 to US $26495.

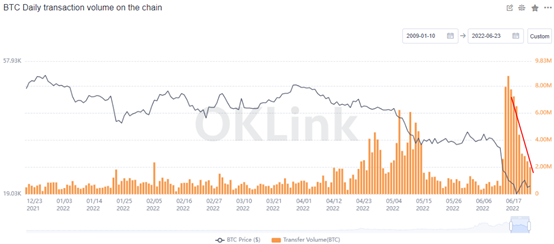
3. BTC online transaction volume shrinks

Although the on chain trading volume of BTC is at a high level in the short term, the contraction trend is clear. At present, the trading volume on the chain has reached twice the average value since 2022. This shows that the rebound in trading volume brought about by the recent price drop has not ended. The high trading volume on the chain means that the impact on prices will be reflected in the near future. There are many opportunities for BTC price fluctuation due to active transactions on the chain. At present, the area around 20000 dollars is a relatively good defensive point, whether it is low or holding money.

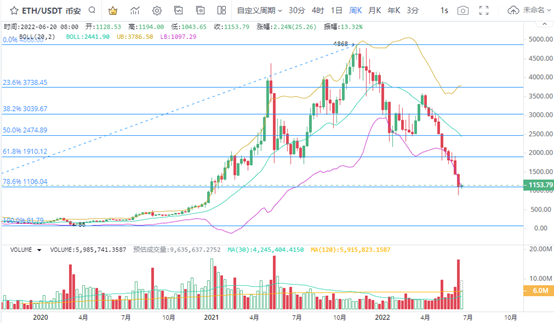
4. Eth brewing interval rebound

The weekly K-line chart of eth shows that although the price has recovered to more than US $1106 corresponding to 78.6% of Fibonacci, a strong rebound has not yet occurred. In terms of trading volume, the volume of eth can be large during the decline period, and the key price rise space still needs time to be tested. From the performance of the range price, ETH is still around us $1153. With the continuation of the range shock, the price increase of eth is expected to be strong.

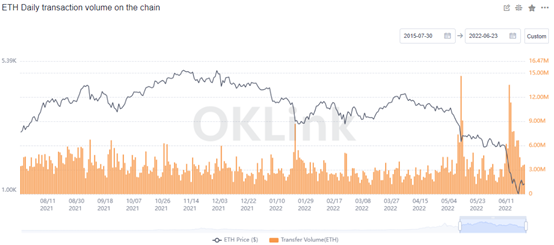
5. The trading volume on the ETH chain fell back

After the trading volume on the ETH chain has dropped, the average value is still higher than the recent average value, indicating that the trading heat of eth has dropped rapidly, and the market change may occur in the near future. Looking back on the previous week, after the ETH oversold rebound trend continued, the ETH price was temporarily supported and was in the stage of rebound warming. Its price increase is expected to strengthen. Due to the high trading volume in the low price area, as eth leaves the low price area, its cash holding profit space will also increase. Next, focus on the rebound opportunities below $1500.

Lecturas Relacionadas

Exploit de gobernanza de Token of Power drena $1.58 millones en WETH, según TRM

La empresa de inteligencia de blockchain TRM Labs ha detallado un ataque de toma de control de gobernanza contra el protocolo Token of Power, que drenó aproximadamente 1,58 millones de dólares en WETH. Según el análisis, el atacante explotó una debilidad en la configuración de la DAO de Aragon del protocolo: la ausencia de un timelock. Esto permitió al atacante proponer, votar y ejecutar una acción de gobernanza maliciosa en un solo bloque. El atacante financió la operación con 662 ETH retirados de Tornado Cash, compró suficientes tokens TOP para obtener poder de voto mayoritario, acuñó 10 mil millones de nuevos TOP y los cambió por WETH a través de un grupo de Balancer antes de devolver los fondos mediante Tornado Cash. La explotación ejemplifica cómo el diseño de gobernanza puede convertirse en un riesgo de seguridad directo. Los timelocks están diseñados para dar tiempo a los usuarios y equipos de seguridad para reaccionar antes de que una propuesta sea ejecutable. Para los usuarios de DeFi, este caso recuerda que el riesgo no se limita a los errores de código; los parámetros de gobernanza y los controles del tesoro son igual de cruciales. El siguiente paso será monitorear si los fondos robados se mueven nuevamente y si el protocolo, Aragon o los proveedores de liquidez afectados publican más detalles sobre remediación. Este informe se basa en datos del reporte de seguridad de TRM Labs.

bitcoinistHace 1 hora(s)

Exploit de gobernanza de Token of Power drena $1.58 millones en WETH, según TRM

bitcoinistHace 1 hora(s)

Los honorarios diarios de XRP Ledger caen por debajo de los 400 dólares mientras resurge el debate sobre la actividad de la red

El libro mayor de XRP vuelve a ser analizado después de que datos de tarifas mostraran que las comisiones diarias de la red cayeron por debajo de los 400 dólares. Aunque las tarifas bajas son un diseño fundamental de XRPL y suelen considerarse una fortaleza, la generación de comisiones también puede utilizarse como indicador de la actividad, la demanda y el uso de transacciones pagadas en la red. La quema semanal de aproximadamente 3.100 dólares subraya el contraste con cadenas de altas comisiones como Ethereum y Bitcoin. Para los partidarios, las tarifas bajas significan que XRPL sigue siendo eficiente y accesible, mientras que para los críticos, una generación de tarifas muy baja puede plantear dudas sobre si la red está experimentando suficiente demanda de alto valor en relación con su capitalización de mercado y su narrativa de pagos de larga data. Esta tensión es la que hace que los datos importen. La historia de XRP a menudo depende de los pagos, la liquidez y la adopción empresarial; los datos de tarifas en cadena ofrecen a los operadores una forma de evaluar si la red está viendo actividad transaccional significativa. Es importante no exagerar la conclusión: un día de tarifas bajas no significa que la red esté fallando, sino que agrega un punto de datos al debate sobre el uso de XRPL. También crea un contraste útil con el impulso más amplio de Ripple hacia RLUSD, pagos con agentes de IA e infraestructura de liquidación empresarial. Se debe observar si la cifra de tarifas se recupera, si los recuentos de transacciones cuentan una historia diferente y si exploradores nativos como Bithomp confirman la misma tendencia. La historia pertenece a la conversación diaria del mercado, destacando cómo las fuertes narrativas en cripto provienen cada vez más de datos en cadena y actualizaciones de protocolos, no solo de comentarios.

bitcoinistHace 3 hora(s)

Los honorarios diarios de XRP Ledger caen por debajo de los 400 dólares mientras resurge el debate sobre la actividad de la red

bitcoinistHace 3 hora(s)

Trading

Spot
Futuros
活动图片