Traders and investors holding on to Polygon [MATIC] may have spotted a 10% uptick in price over the last 24 hours. In doing so, they may have assumed that a bullish run was underway. Unfortunately, they would be wrong.
With an index price of $0.3637, the crypto has dropped back to its April 2021 levels. With the MACD poised for a bearish run, the three month-long decline in price might be far from over.
A tale of 80 days…
Before the plague hit, MATIC started the month at an index price of $1.62. Over the last 80 days, the altcoin has lost 77% of its value to mark a spot at $0.372.
Over the last 24 hours, the alt’s price registered a 10% uptick. Within the 80-day period, the market capitalization also declined from $12.45 billion to $2.98 billion, at the time of writing.
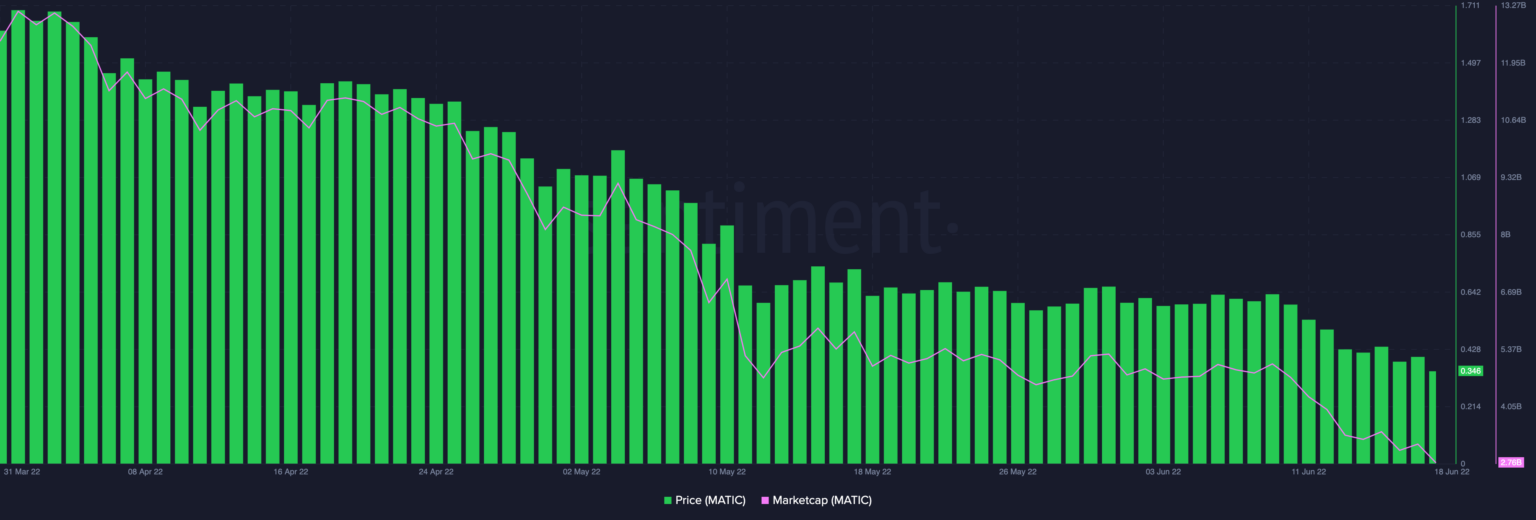
Source: Santiment
Struggling to keep the bears at bay, the Relative Strength Index (RSI) and the Money Flow Index (MFI) have been stationed below 50 for three months. Within that period, the RSI went as low as 22 on 12 May. The MFI also touched a low of 13 on 11 April. At press time, the RSI and MFI were deeply oversold at 31 and 18, respectively.
While the latest uptick in the price of MATIC might give investors a false sense of recovery, it is trite to point out that recovery is still far from sight. Looking at the 50 EMA showed the EMA line resting comfortably above the price.
This is indicative of a bearish bias. Also, implying a renewed bear run, the MACD line on 12 June intersected the trendline in a downward curve.
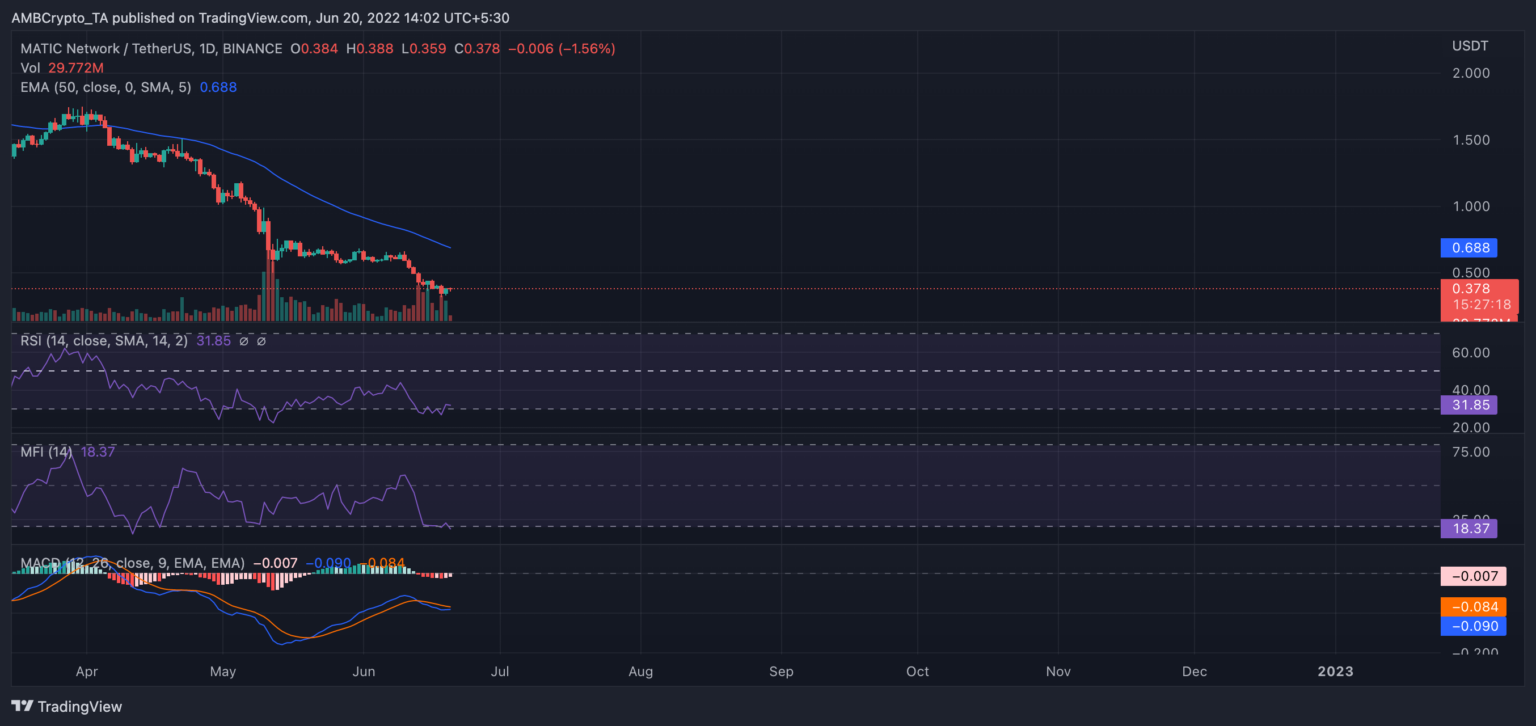
Source: TradingView
The position of the exchange flow balance metric for MATIC lent credence to its bearish outlook. With a reading of -13.74 million at press time, a price drop down seemed imminent.
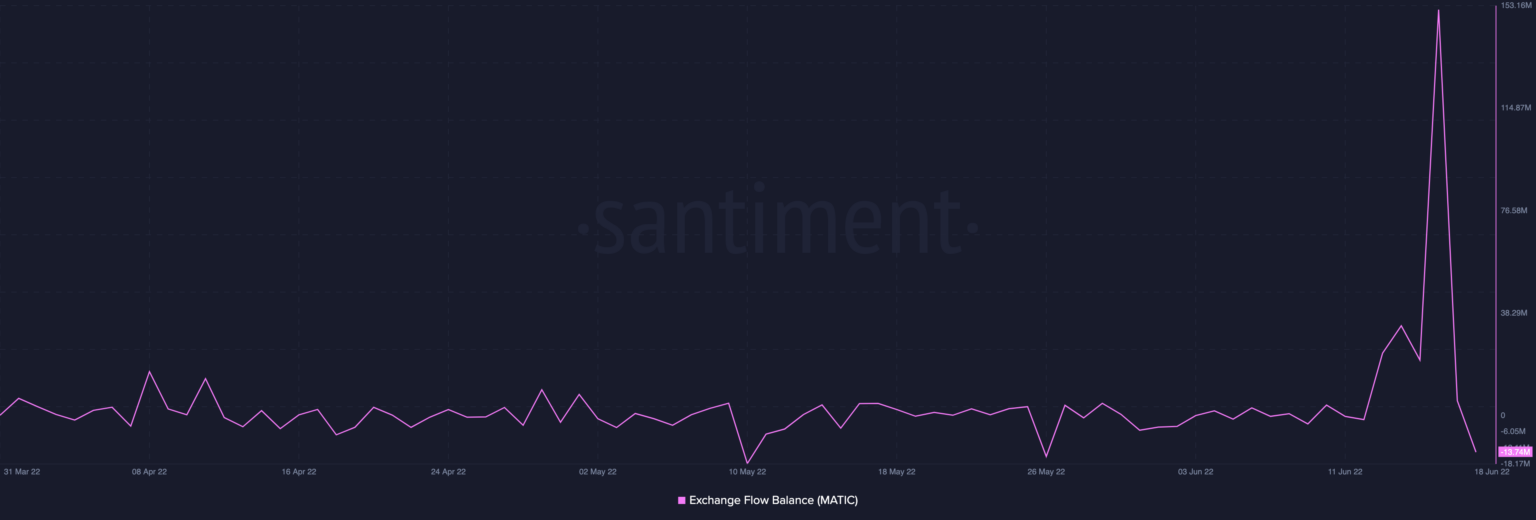
Source: Santiment
On-chain analysis
A review of MATIC’s on-chain performance over the last three months revealed a decline in the number of new addresses created on the network daily.
After registering a high of 3357 on 12 May, the network’s growth took on a downtrend. At the time of writing, it had recorded a 50% drop to be pegged at 1,672 new addresses.
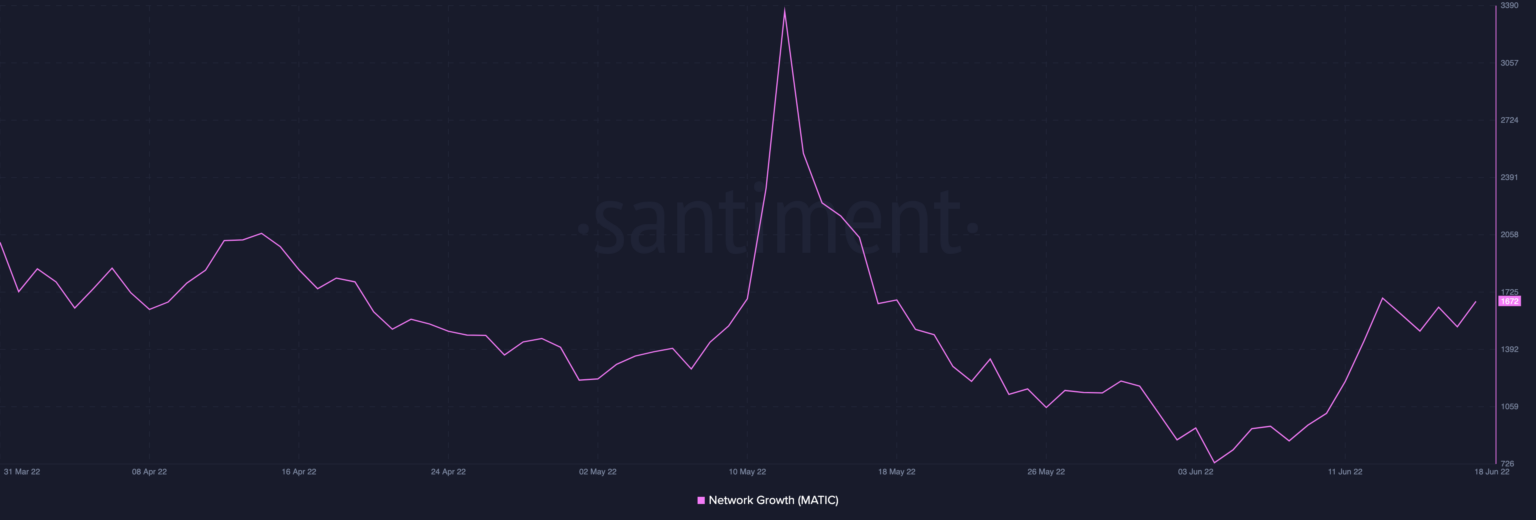
Source: Santiment
Whale accumulation of the altcoin has embarked on a steady decline since mid-May. After recording a total count of 1,079 transactions between 10 and 13 of May, the count for whale transactions above $100k has since taken a beating.
Since 13 May, a 62% decline has been registered. For transactions above $1 million, an 88% drop in count has been recorded since the high on 13 May.
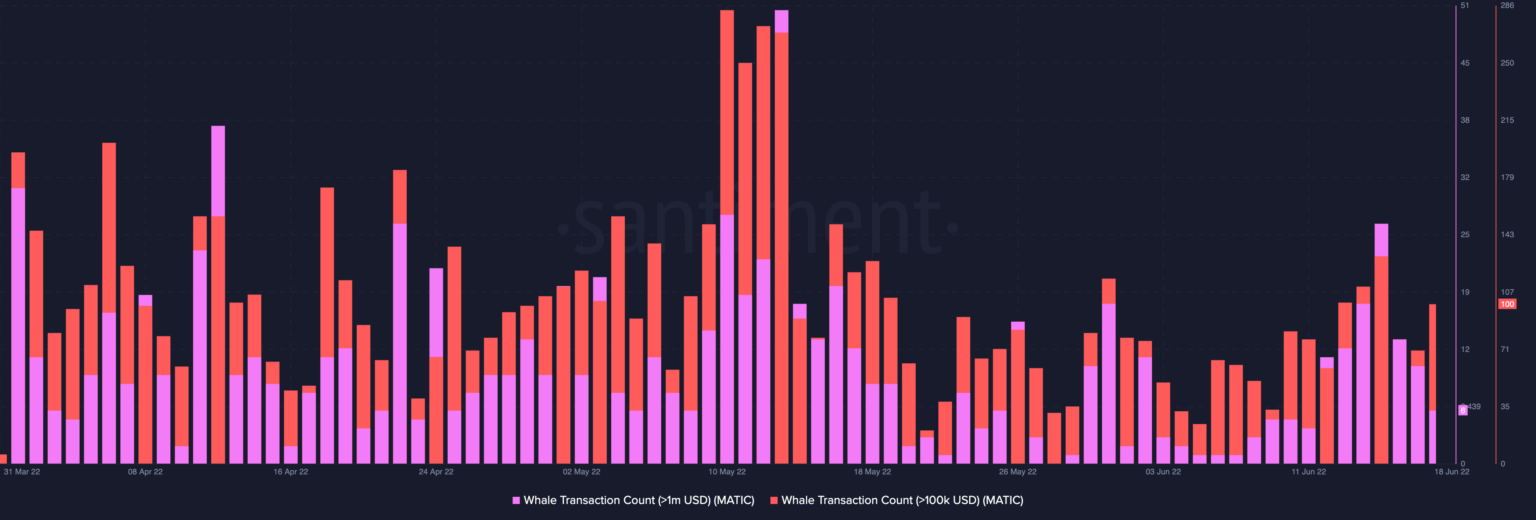
Source: Santiment
In addition to this, active deposits on the network have dropped steadily since 11 May after a high of 661.
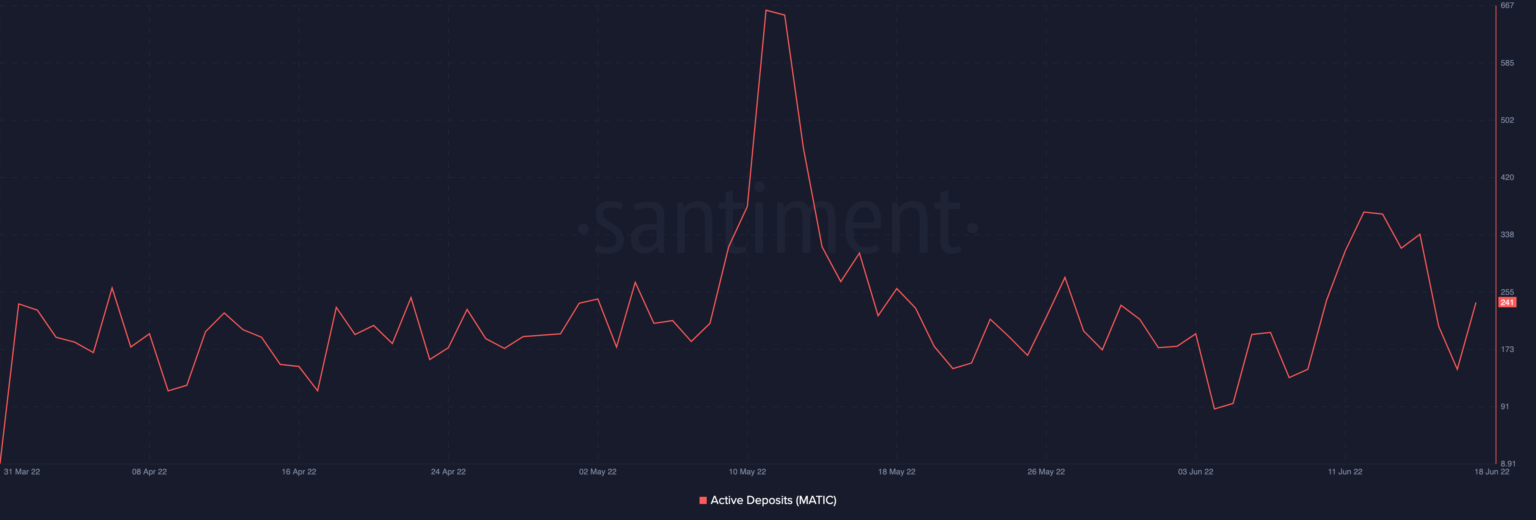
Source: Santiment
So far this year, the Polygon Network has introduced some updates to its ecosystem. These updates include the Green Manifesto and its Carbon Neutral project. However, with a sustained decline in price, more has to be done by the network in order to retain its investors.