Executive Summary
- A “correlation 1” event has seen major assets and equities decline markedly, with Bitcoin being no exception, recording its largest drawdown of the cycle.
- The price contraction has resulted in the BTC spot price reaching the Active Investor Price, located at $51.4k, which is a crucial level for investor psychology.
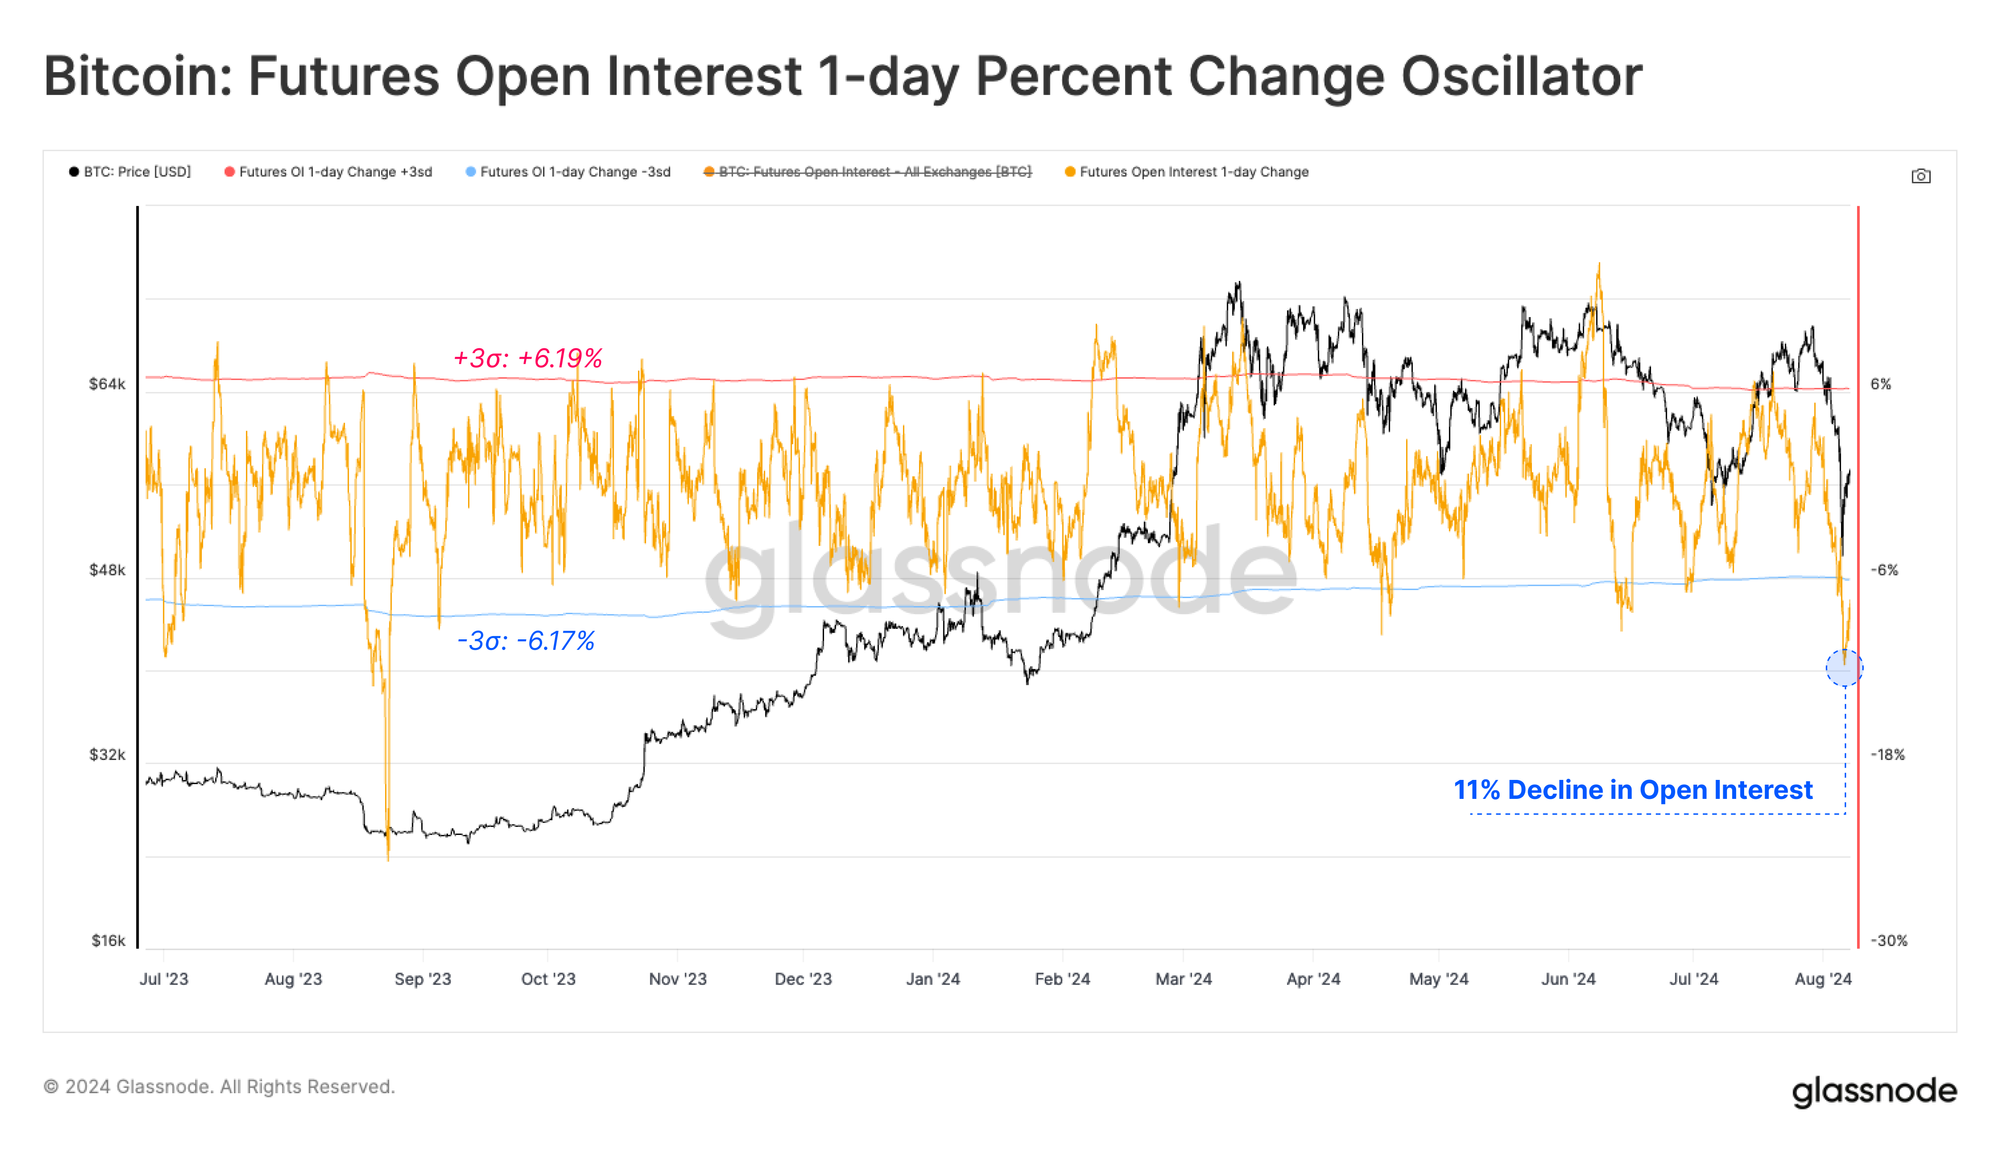
- A dramatic flush out of leverage has also occurred, with futures open interest declining by 11% in one day. This likely increases the importance on on-chain data moving forwards.

Selling-Off
Periods of widespread decline across global markets are typically infrequent, occurring at points of acute global stress, deleveraging, and heightened geopolitical risk. On Monday 5-Aug, equities and digital assets sold off sharply, as the unwinding of the yen-carry trade deleveraged markets, and US treasuries rallied on fears of a recession.
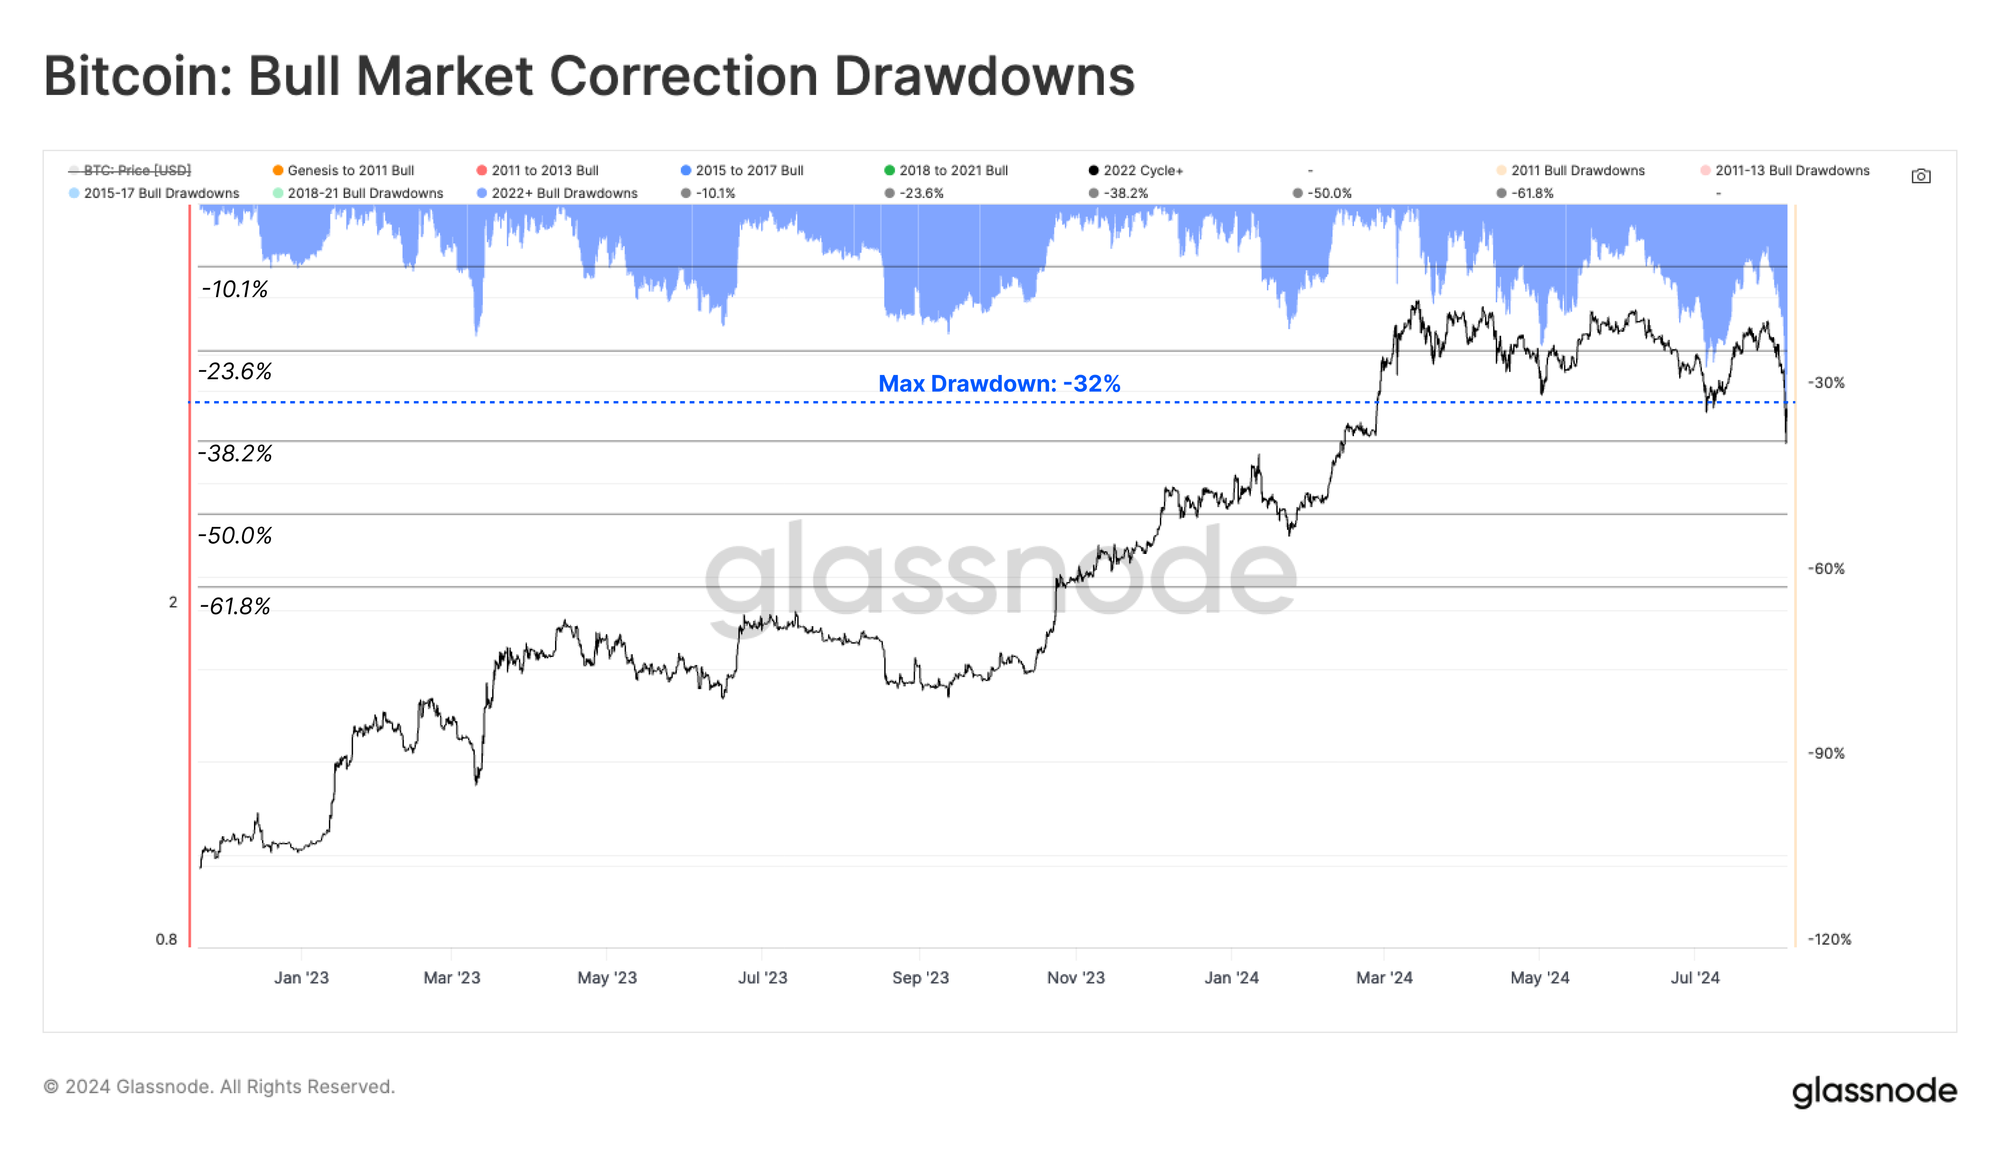
Bitcoin recorded a drawdown of -32% from the ATH, the most severe of the current cycle.
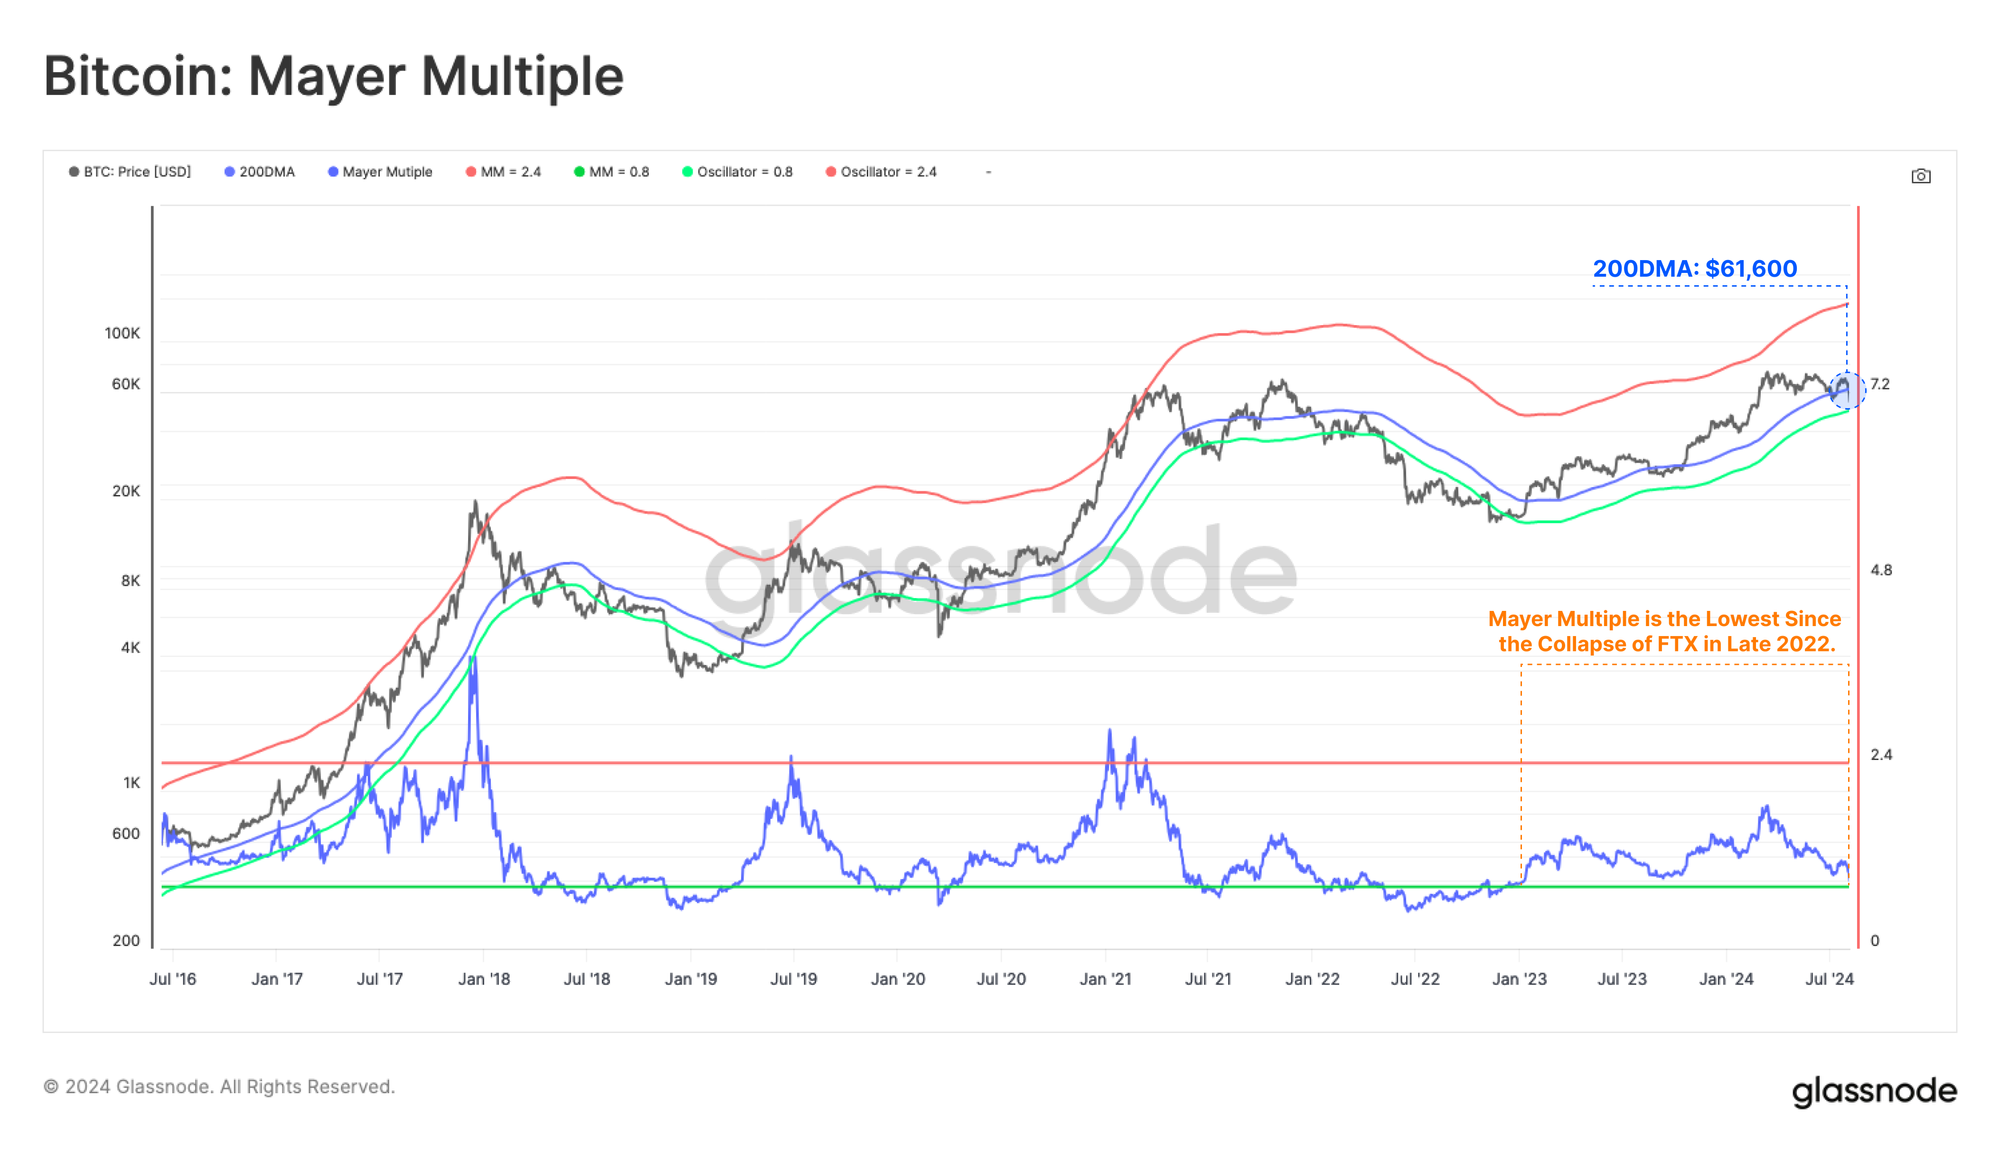
To assess the severity of the price contraction, we can utilize the well-known Mayer Multiple, which is the ratio between Price and the 200-day moving average. The 200DMA is widely considered a point of delineation between bullish and bearish market conditions by traders and investors.
Currently, the Mayer Multiple is trading at a value of 0.88, which is the lowest since the collapse of FTX in late 2022.
Key On-Chain Pricing Levels
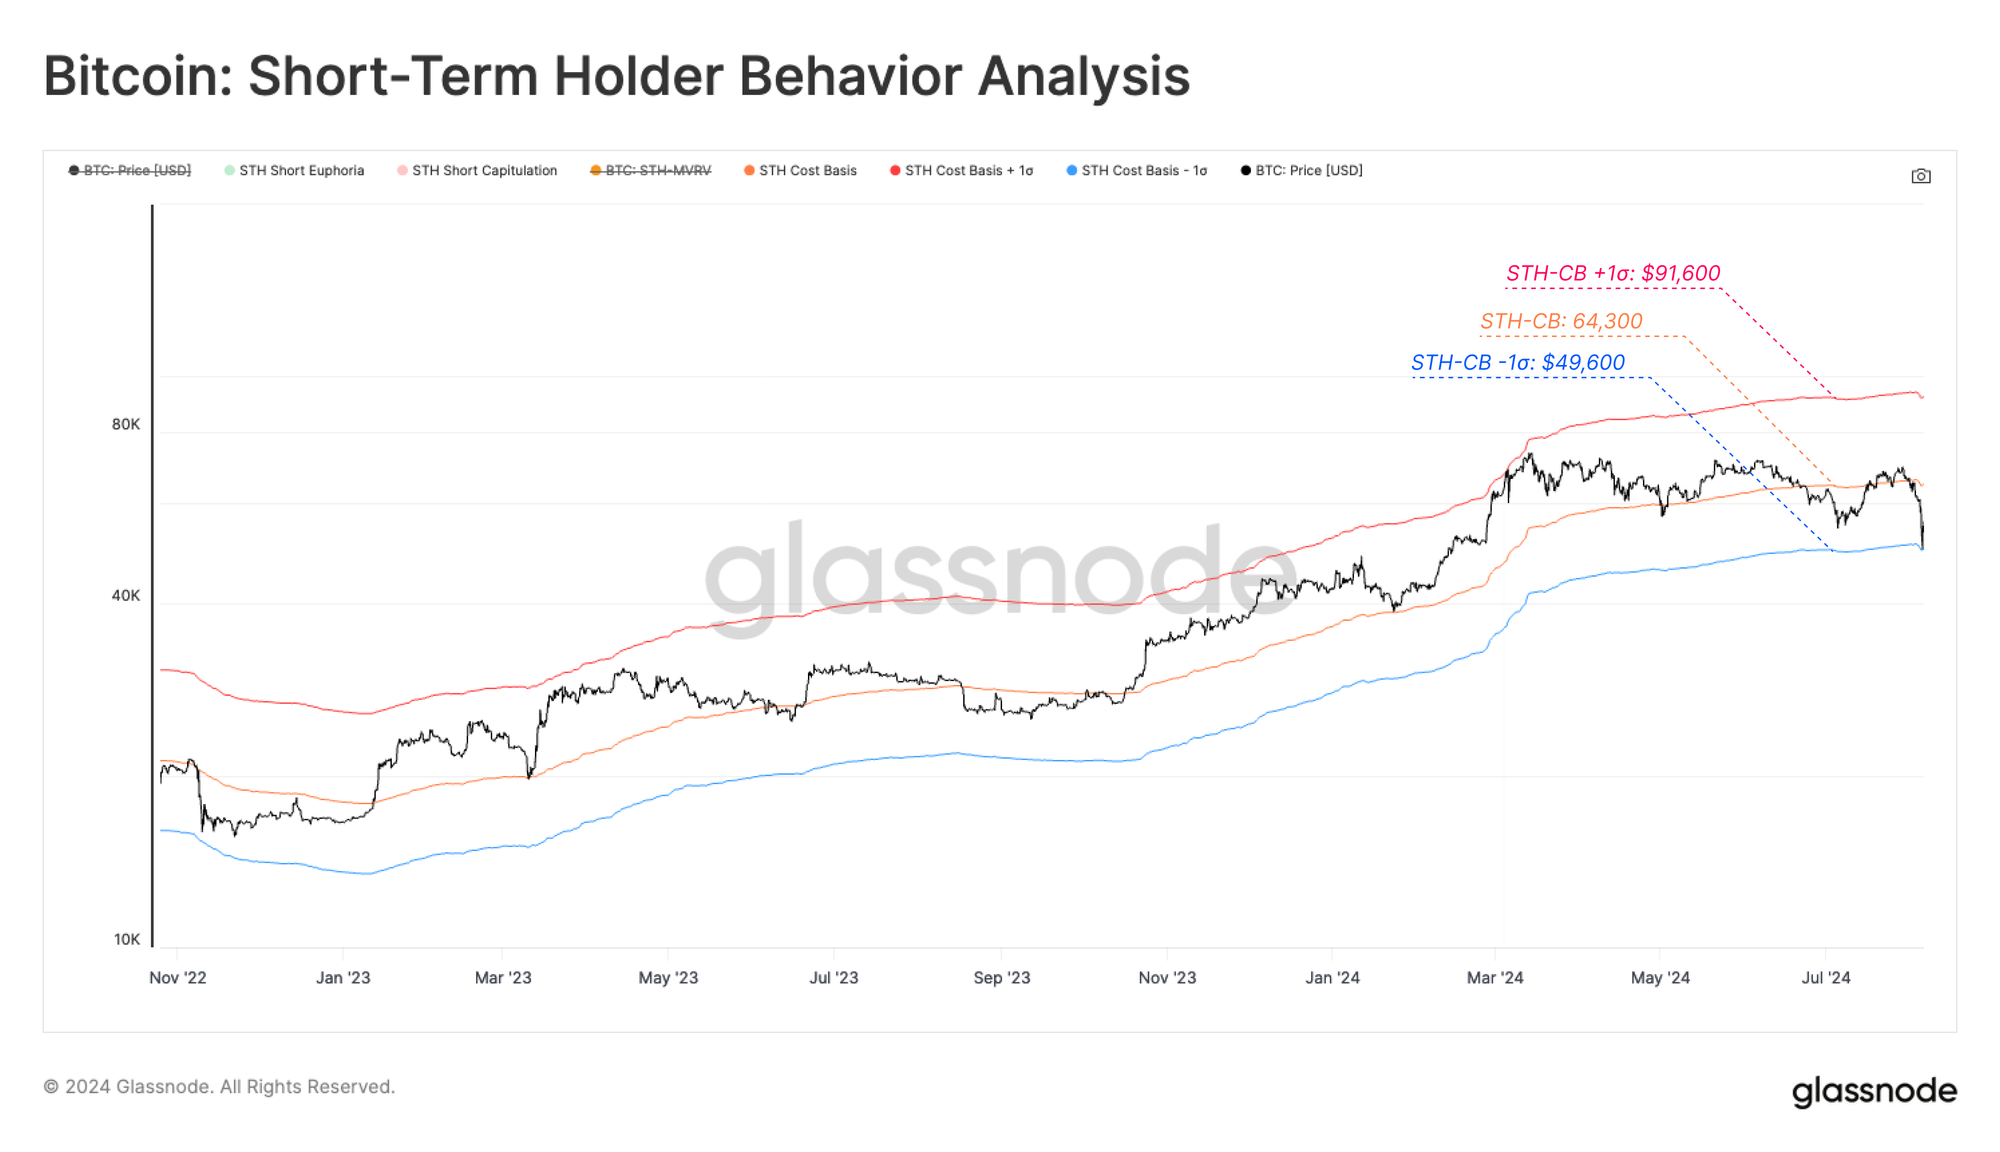
Moving into the on-chain domain, we can assess the severity of the sell-off using the Short-Term Holder Cost-Basis, as well bands representing a -1 standard deviation move below. This helps us evaluate how the profitability of new investors has changed during volatile price action.
- 🟠 Short-Term Holder Cost-Basis: $64,300
- 🔵 Short-Term Holder Cost-Basis -1SD: $49,600
The Spot price crashed to within touching distance of the -1SD pricing band, with only 364 / 5139 (7.1%) trading days recording a deviation below the pricing level. This underscores the sharp pace of the market decline.
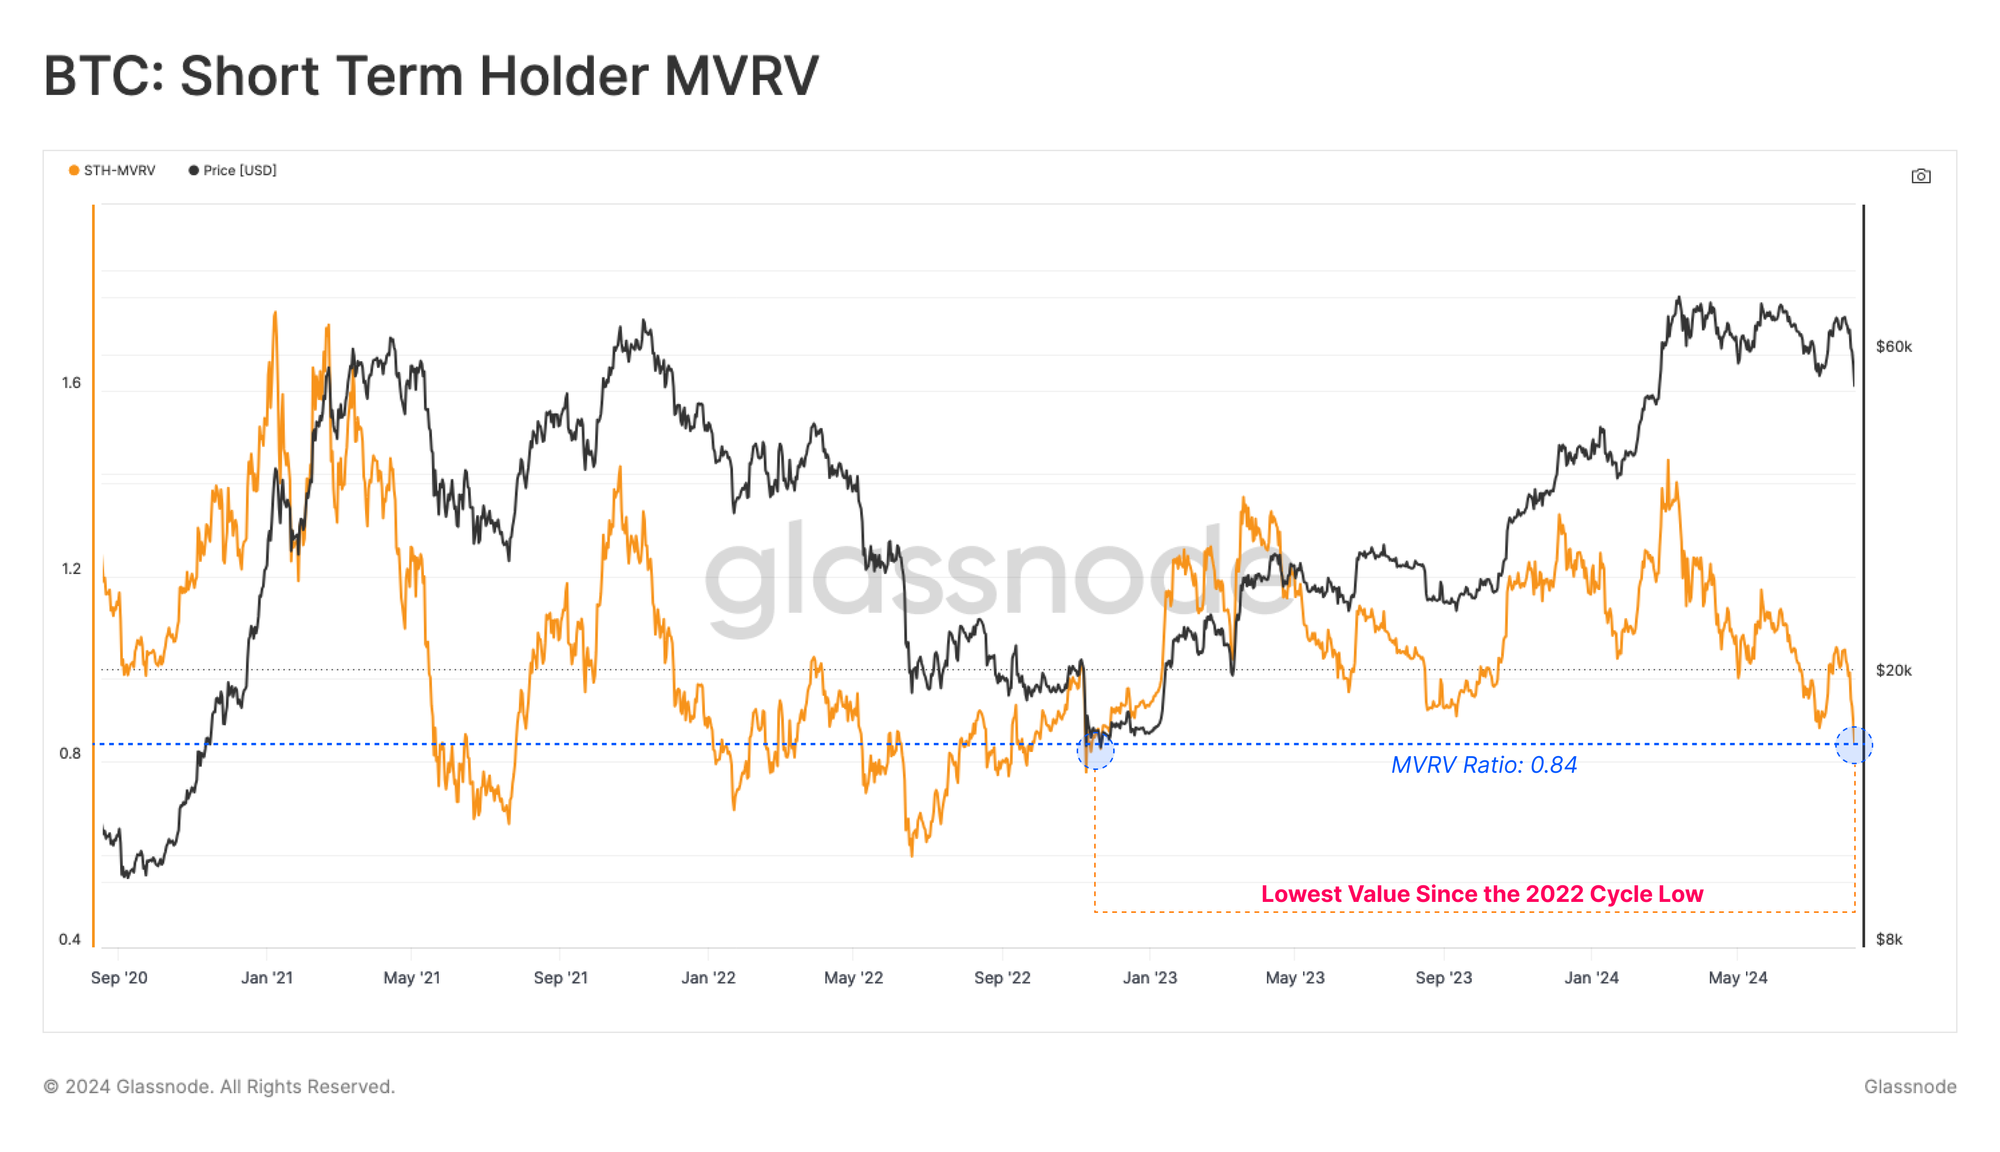
We can also assess these market dynamics through the lens of Short-Term Holder MVRV, which gauges the magnitude of unrealized profit, or loss held across the new investor cohort.
Short-Term Holders are currently holding the largest unrealized loss since the FTX implosion, which again highlights a point of serious investor stress imposed by current market conditions.
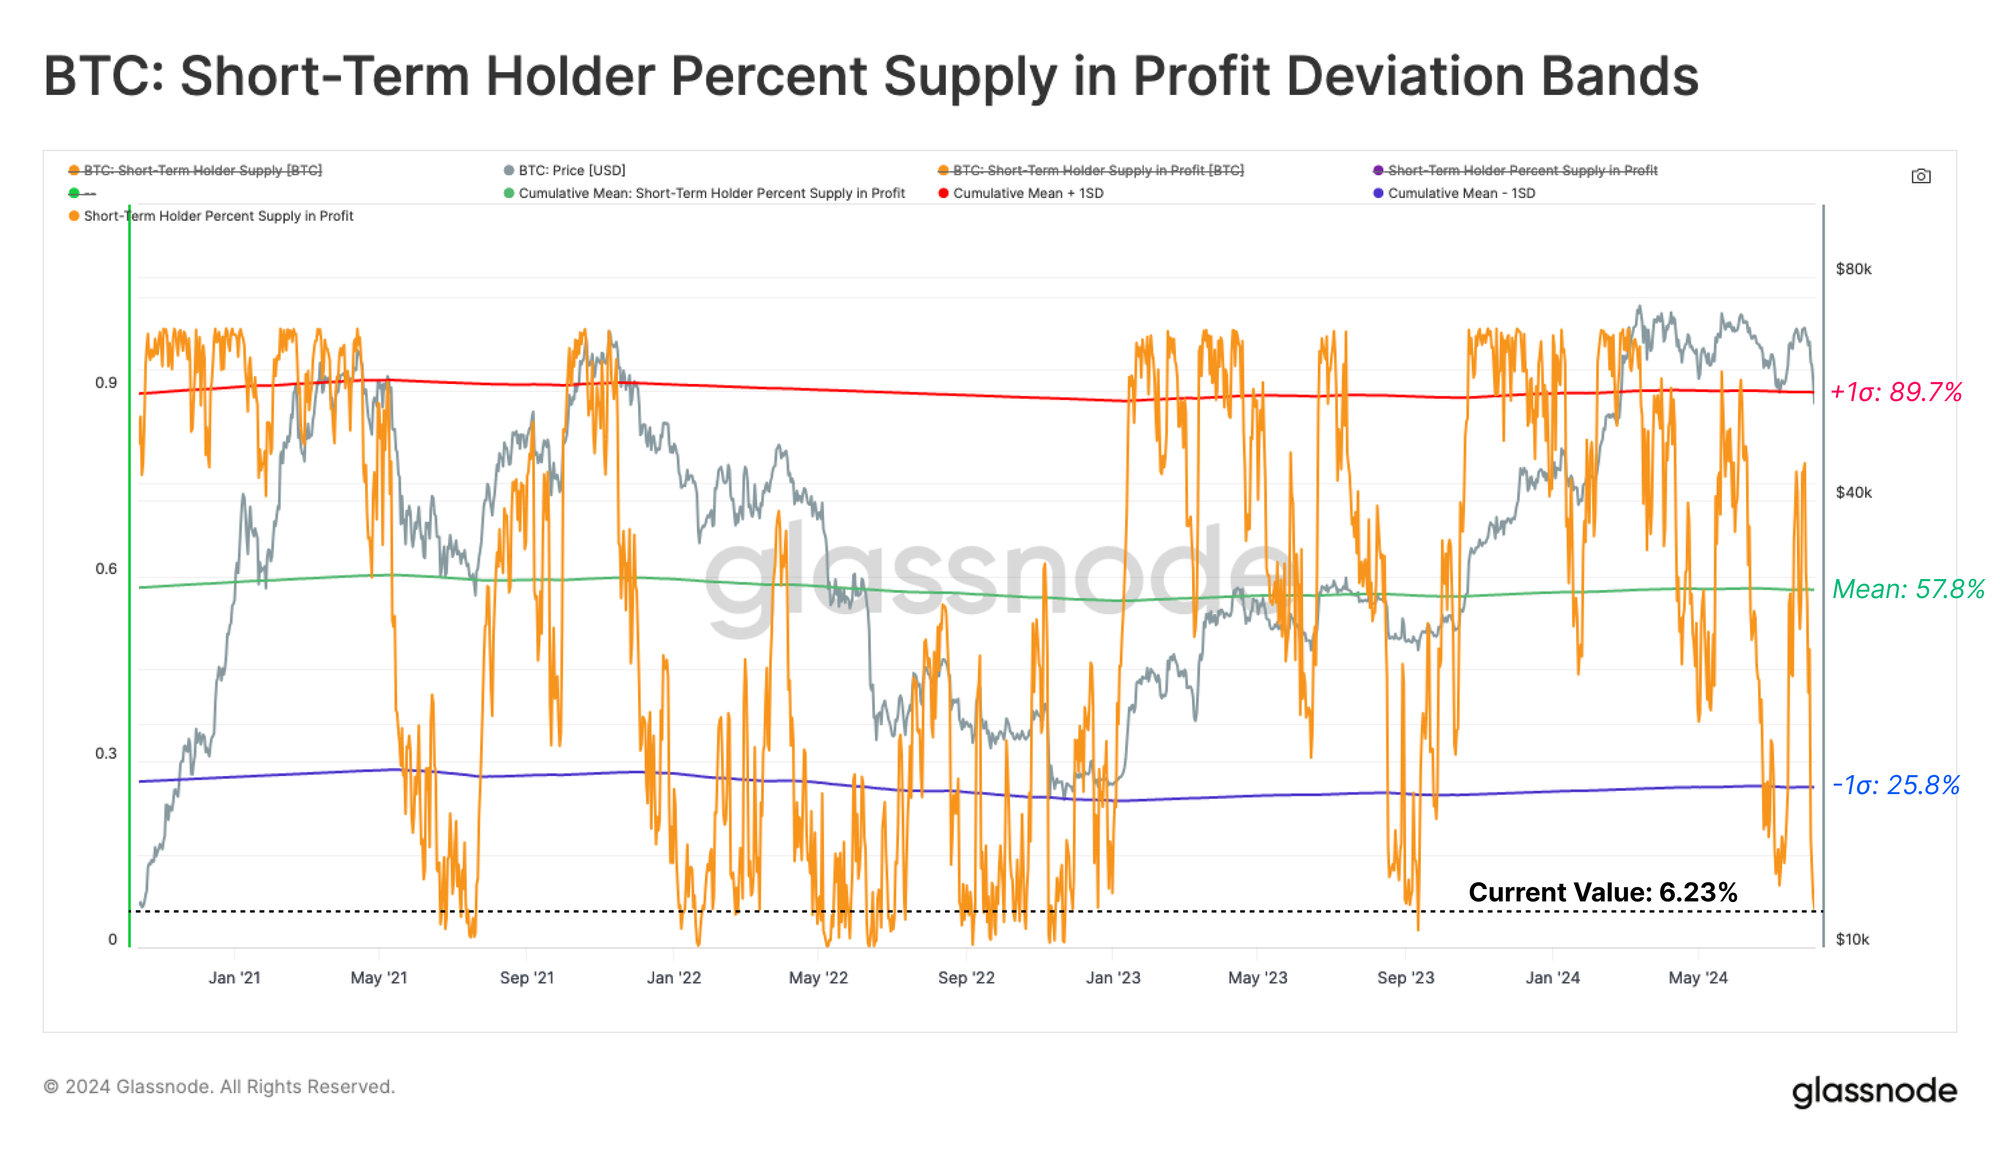
If we evaluate the percentage of Short-Term Holder Supply held in profit, we can see that just 7% of their supply is held in a profitable position, and is similar to the sell-off in August 2023.
This is also more than -1 standard deviation below the long-term average for this metric, and suggests a notable degree of financial stress amongst recent buyers.
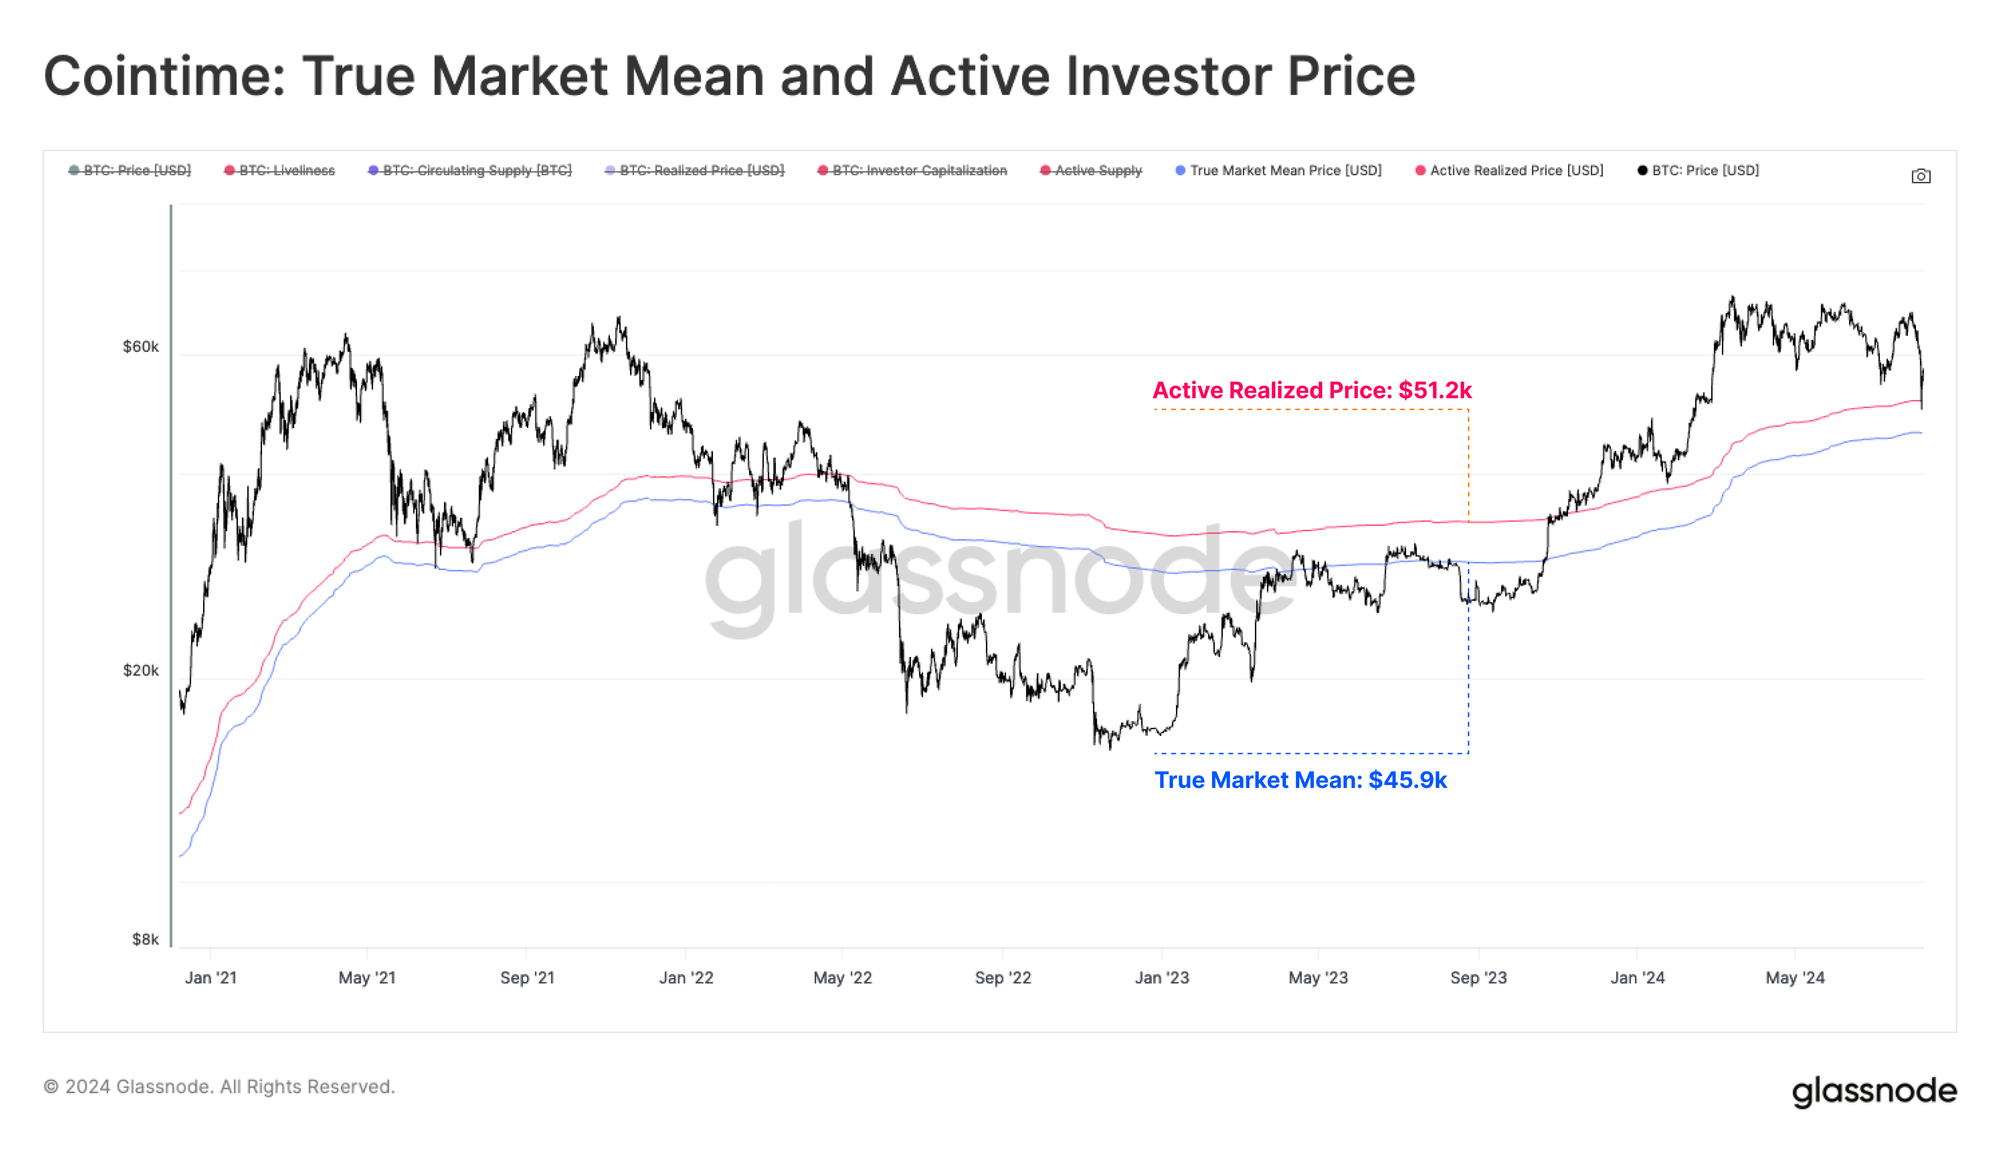
The True-Market Mean ($45.9k) and the Active Investor Price ($51.2k) both provide estimates of the average cost basis for investors who are active within the current cycle. These models attempt to discount lost and long dormant coins.
The position of the spot price relative to these two key pricing levels can be considered as zone of interest for differentiating between macro Bull and Bear markets.
- 🔴 Active Investor Price: $51.2k
- 🔵 True Market Mean: $45.9k
The market did find support near the Active Investor Price, which suggests a cohort of investors provides buy-side support near their longer-term cost basis. Should the market decisively break below these two pricing regions, if would require a significant re-evaluation of bull market structure, and would indicate a large proportion of the market is now underwater.
Realized Losses Spike Higher
In the previous section, we evaluated the position of the market relative to levels where investors are likely to be under serious financial pressure. The next step is to assess the investor response, by analyzing the magnitude of losses locked in during the event.
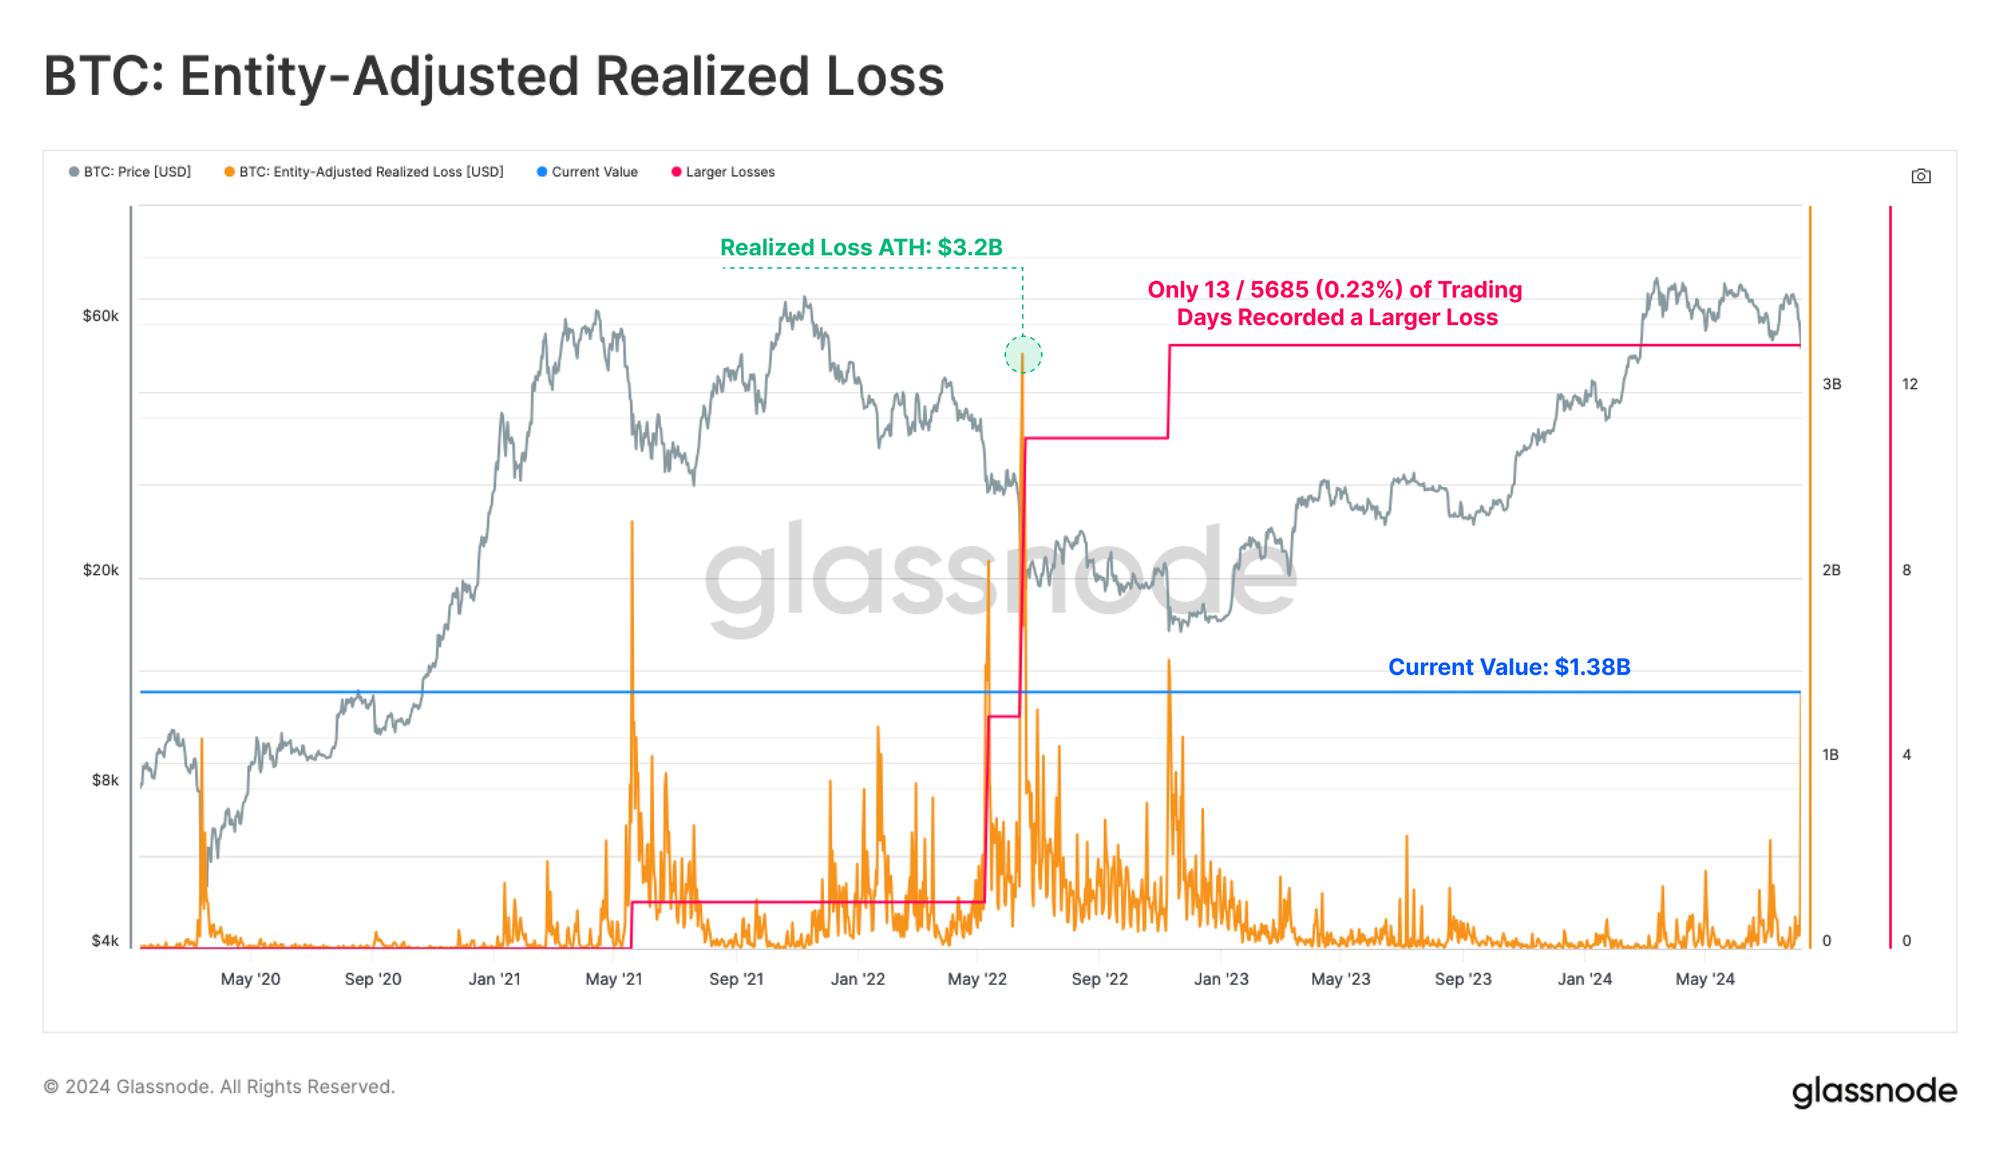
The sell-off triggered a surge in panic by investors, with around $1.38B in realized losses locked in by market participants. In absolute terms, this is the 13th largest event in history on a USD denominated basis.
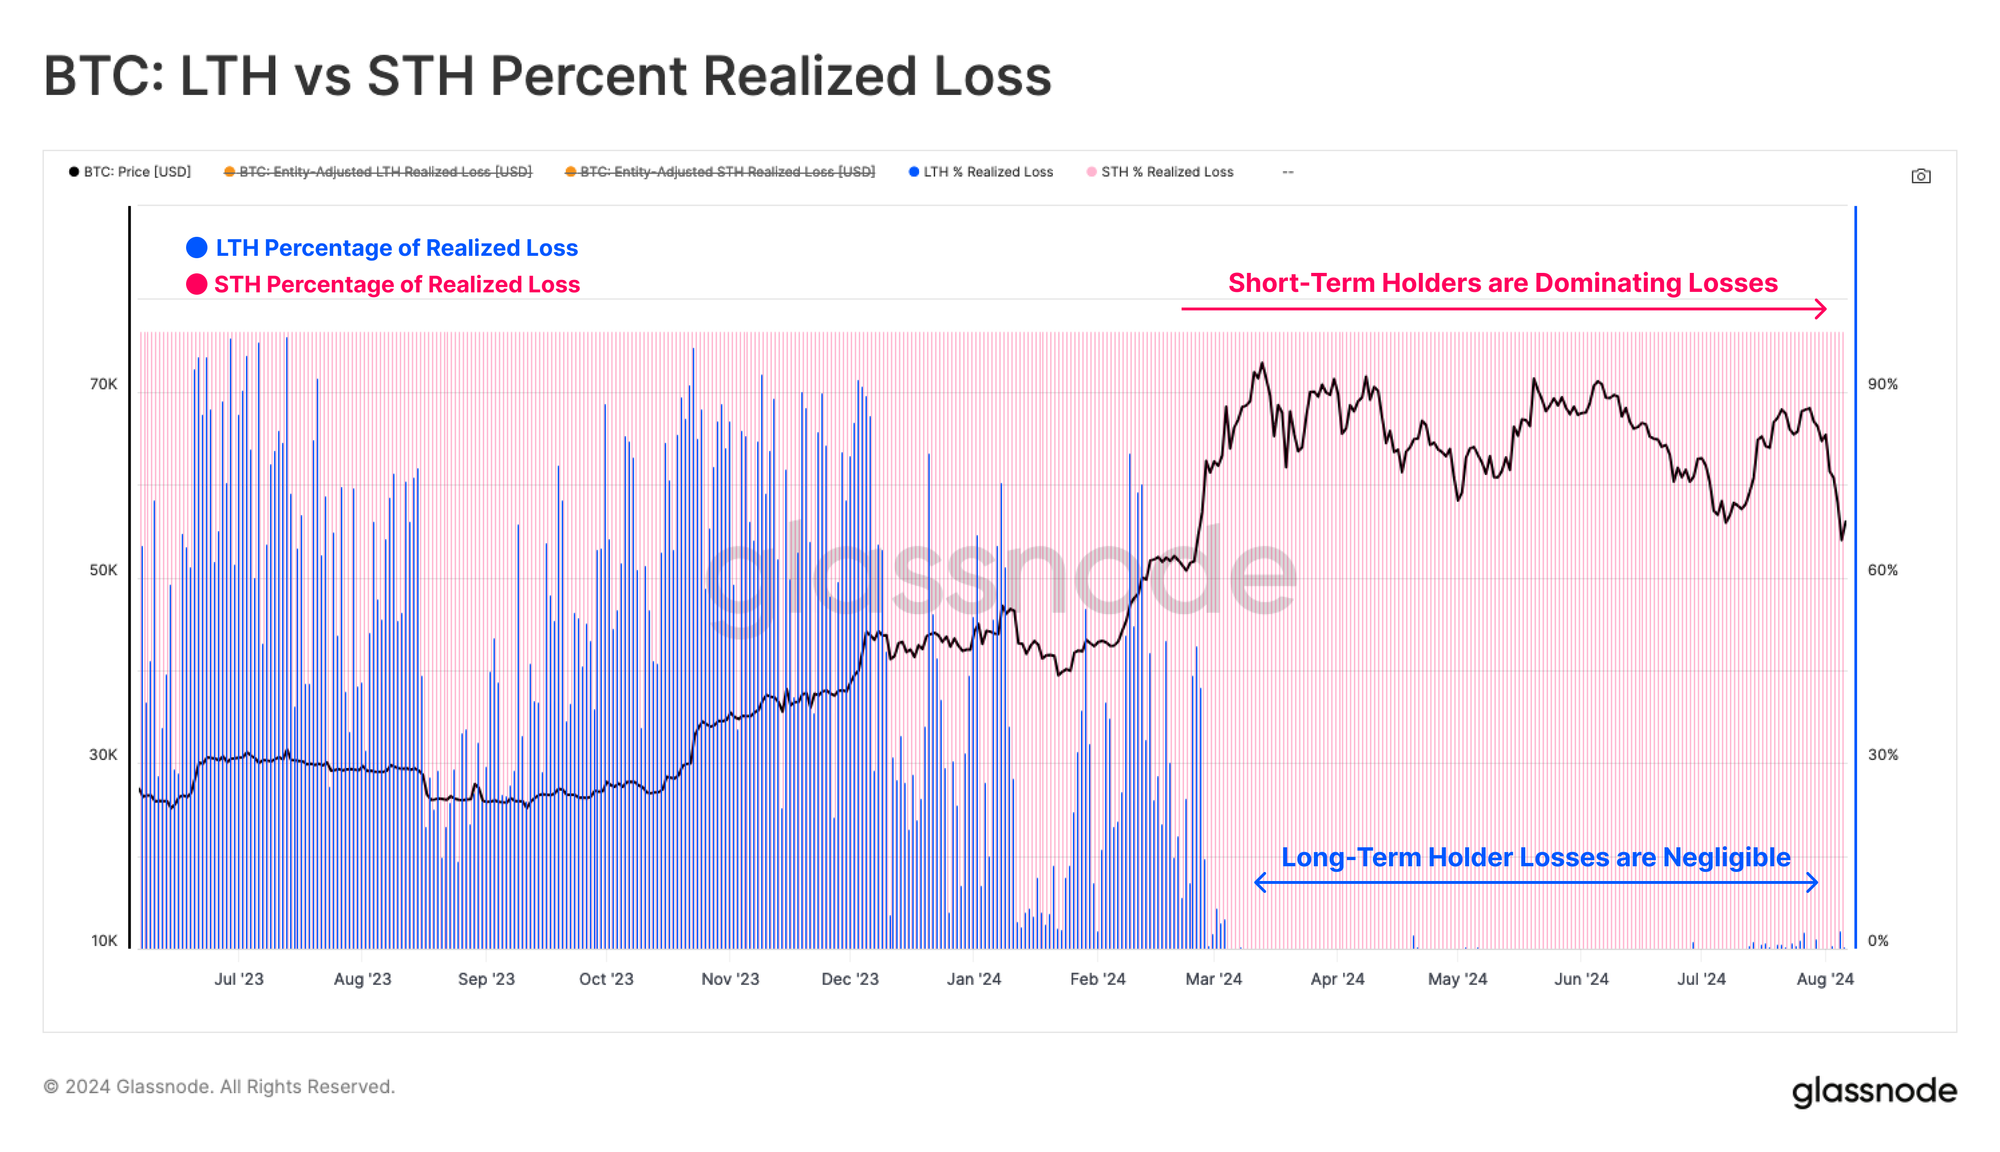
We can decompose these losses by Long or Short-Term holder cohorts to identify which groups were most affected. Remarkably, 97% of all losses can be attributed to Short-Term Holders, and the Long-Term Holder cohort were comparatively unfazed.
Therefore, we will focus on the Short-term Holder cohort as the centrepiece for loss analysis moving forwards.
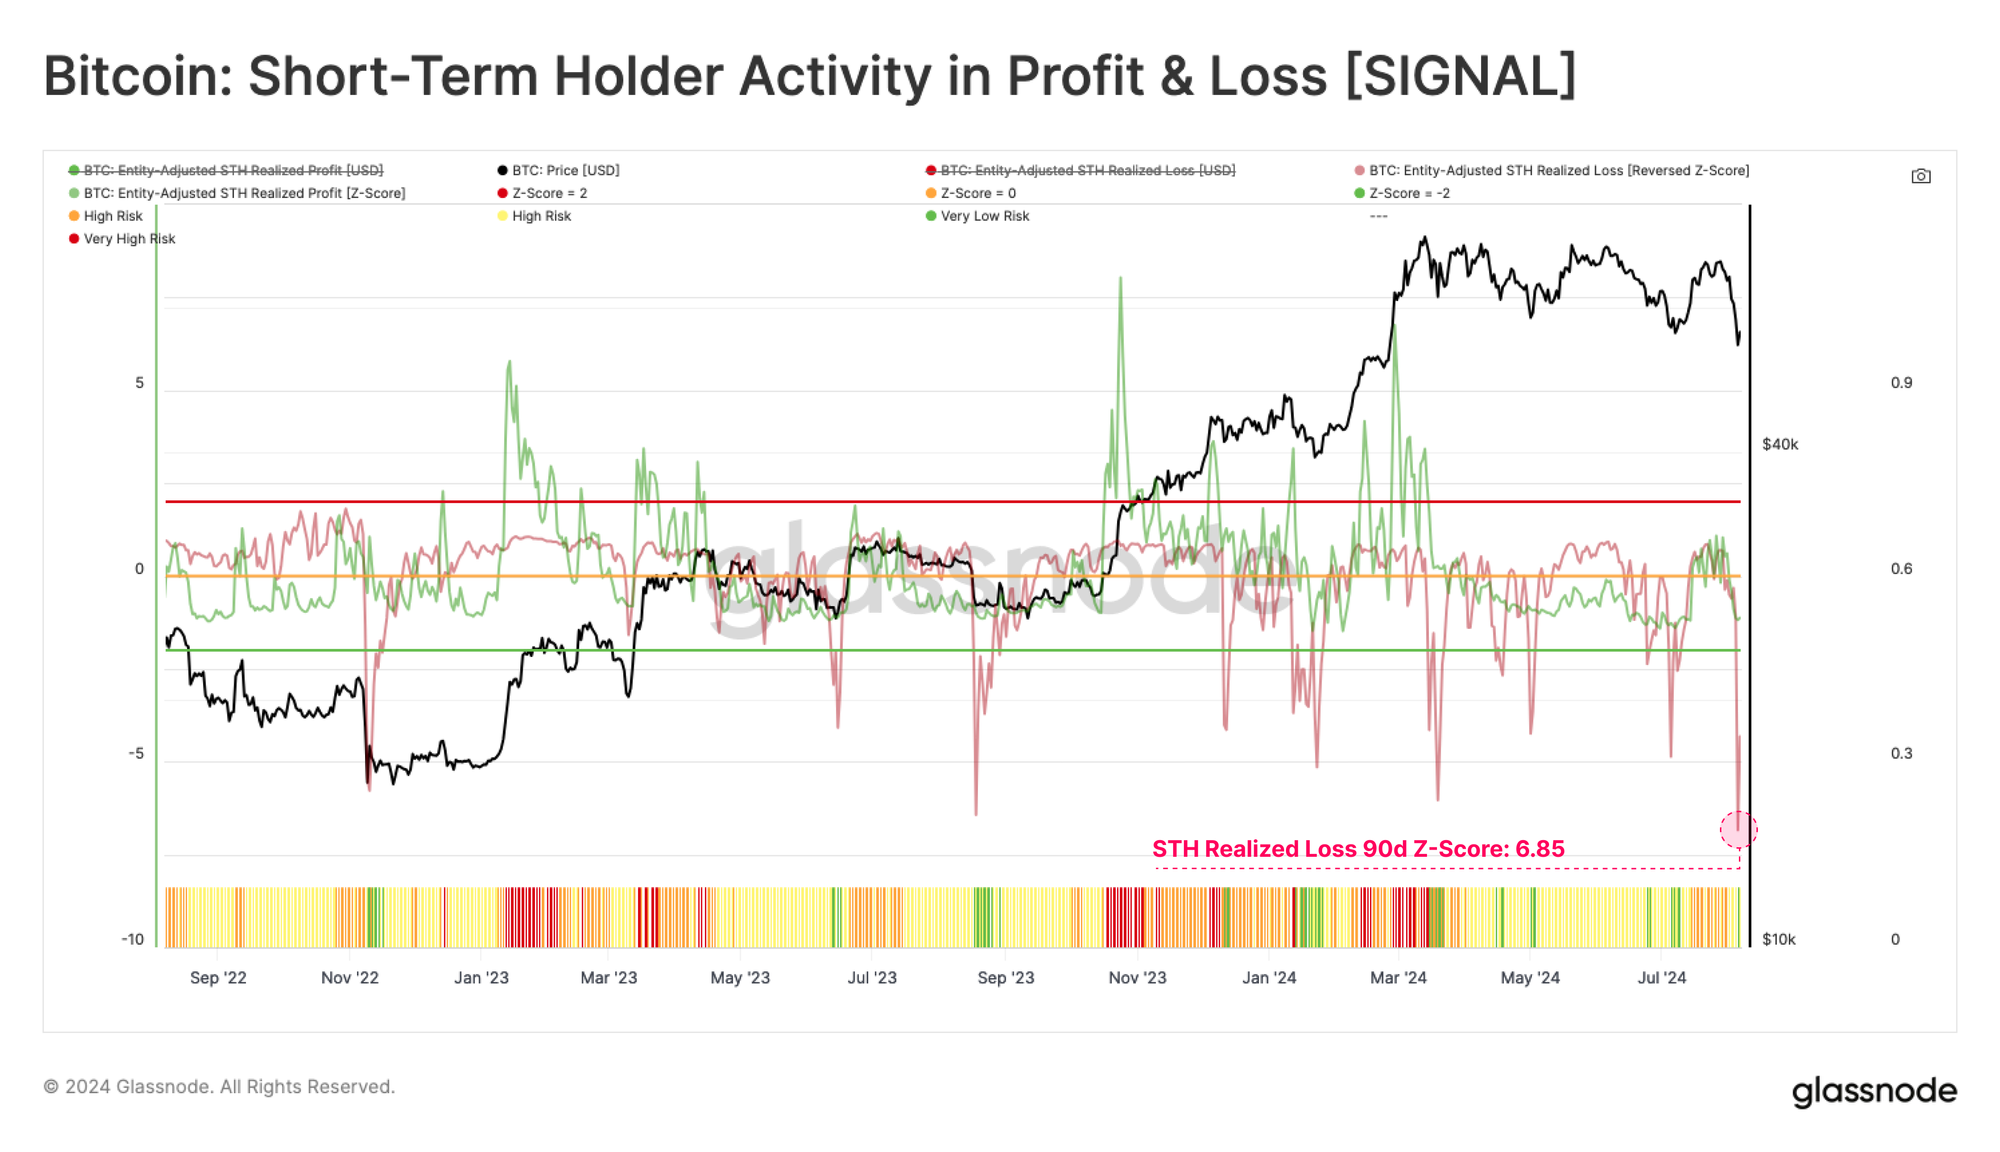
Isolating for Short-Term Holders, we note that the Z-Score of their Realized Loss has recorded a 6.85 standard deviation move, with only 32 trading days ever hitting larger value. This highlights the severity of the sell-off event in a historical context.
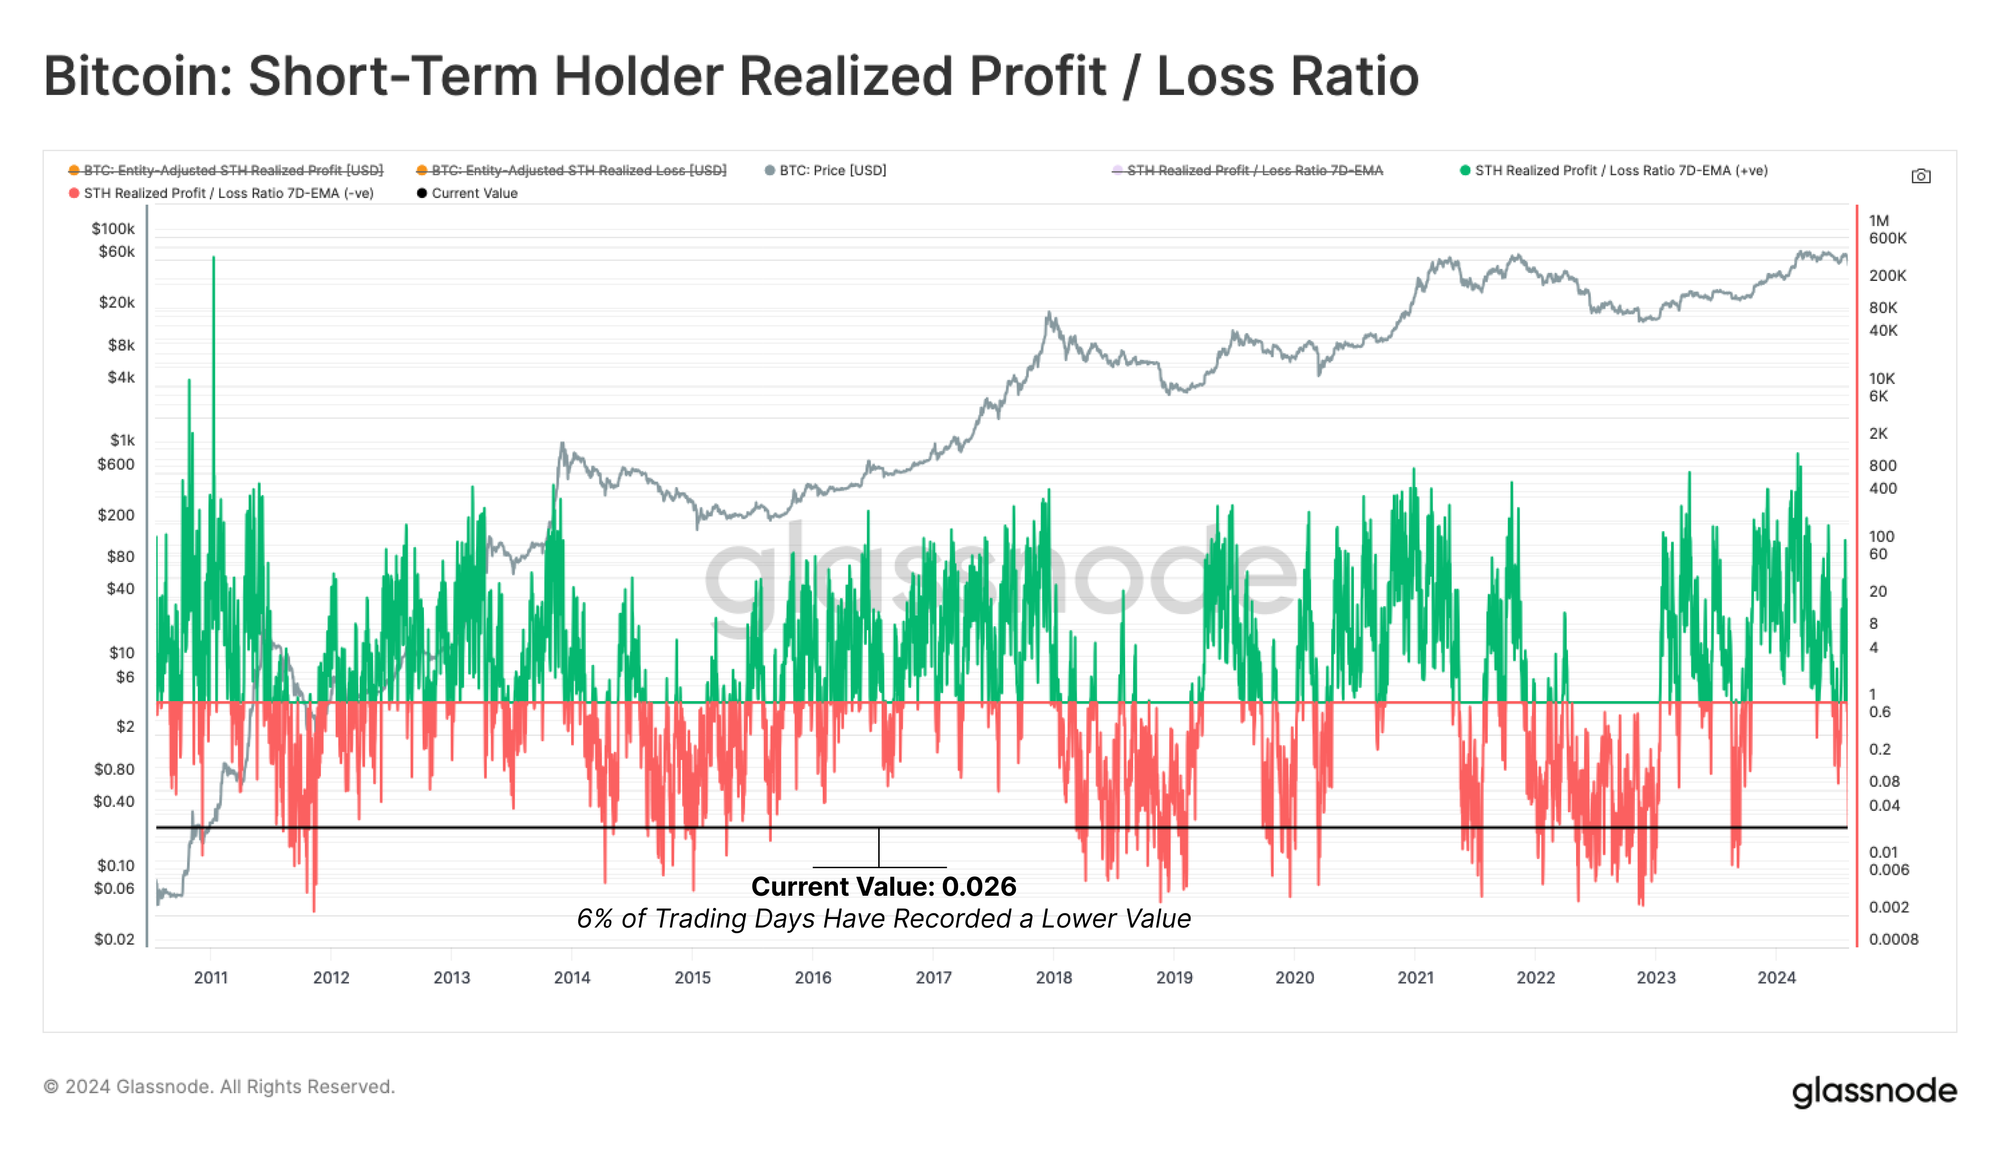
This sentiment is echoed across the STH Realized Profit / Loss Ratio, which collapsed to historically low values, with only 6% of trading days recording a lower value.
This indicates that the primary reaction from investors was one of panic and fear, as coins were sold well below their original acquisition price.
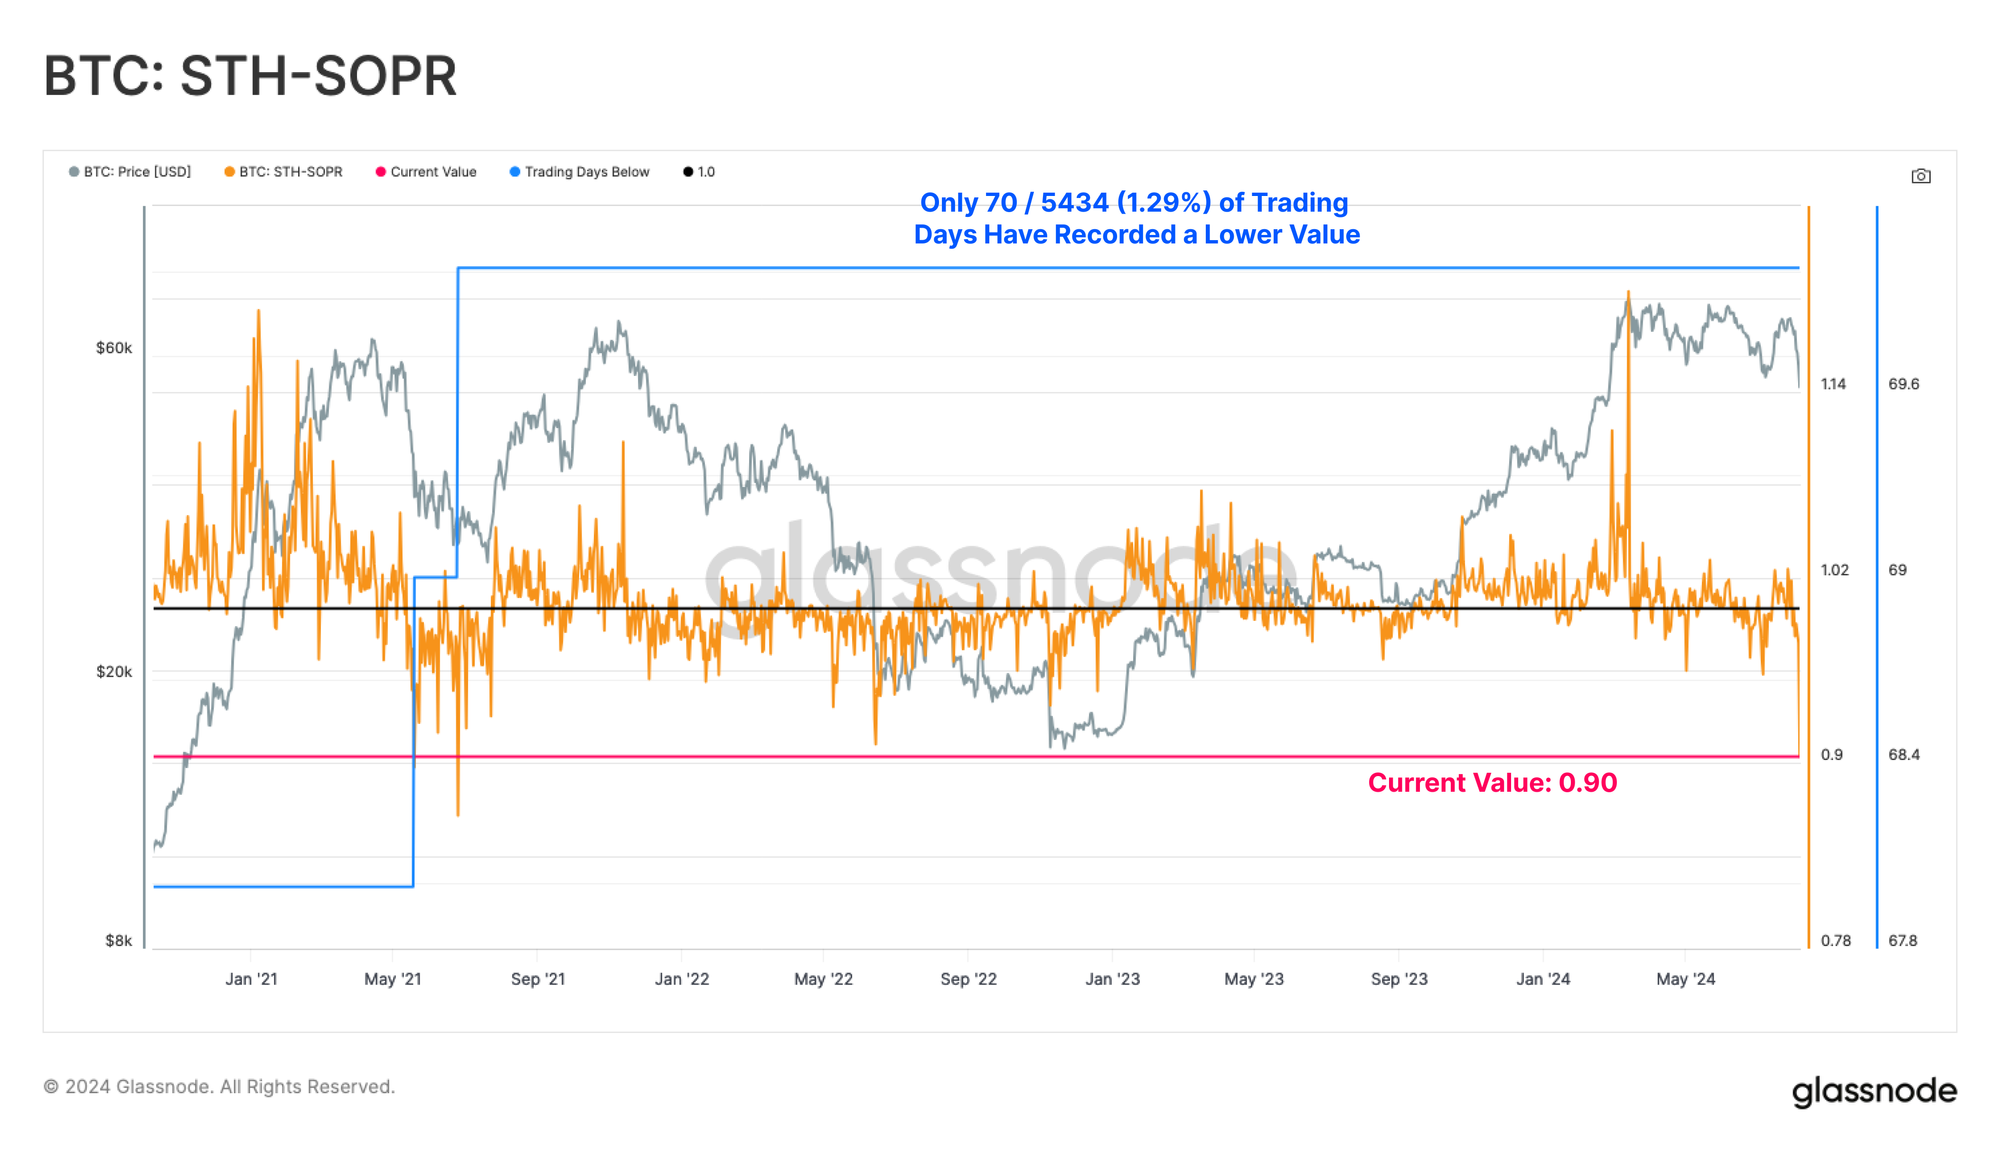
Short-Term Holder SOPR has also reached staggering depths, as new investors locked in a -10% loss on average. This speaks to a form of capitulation, with only 70 trading days ever registering a lower value.
Derivatives Flush Out
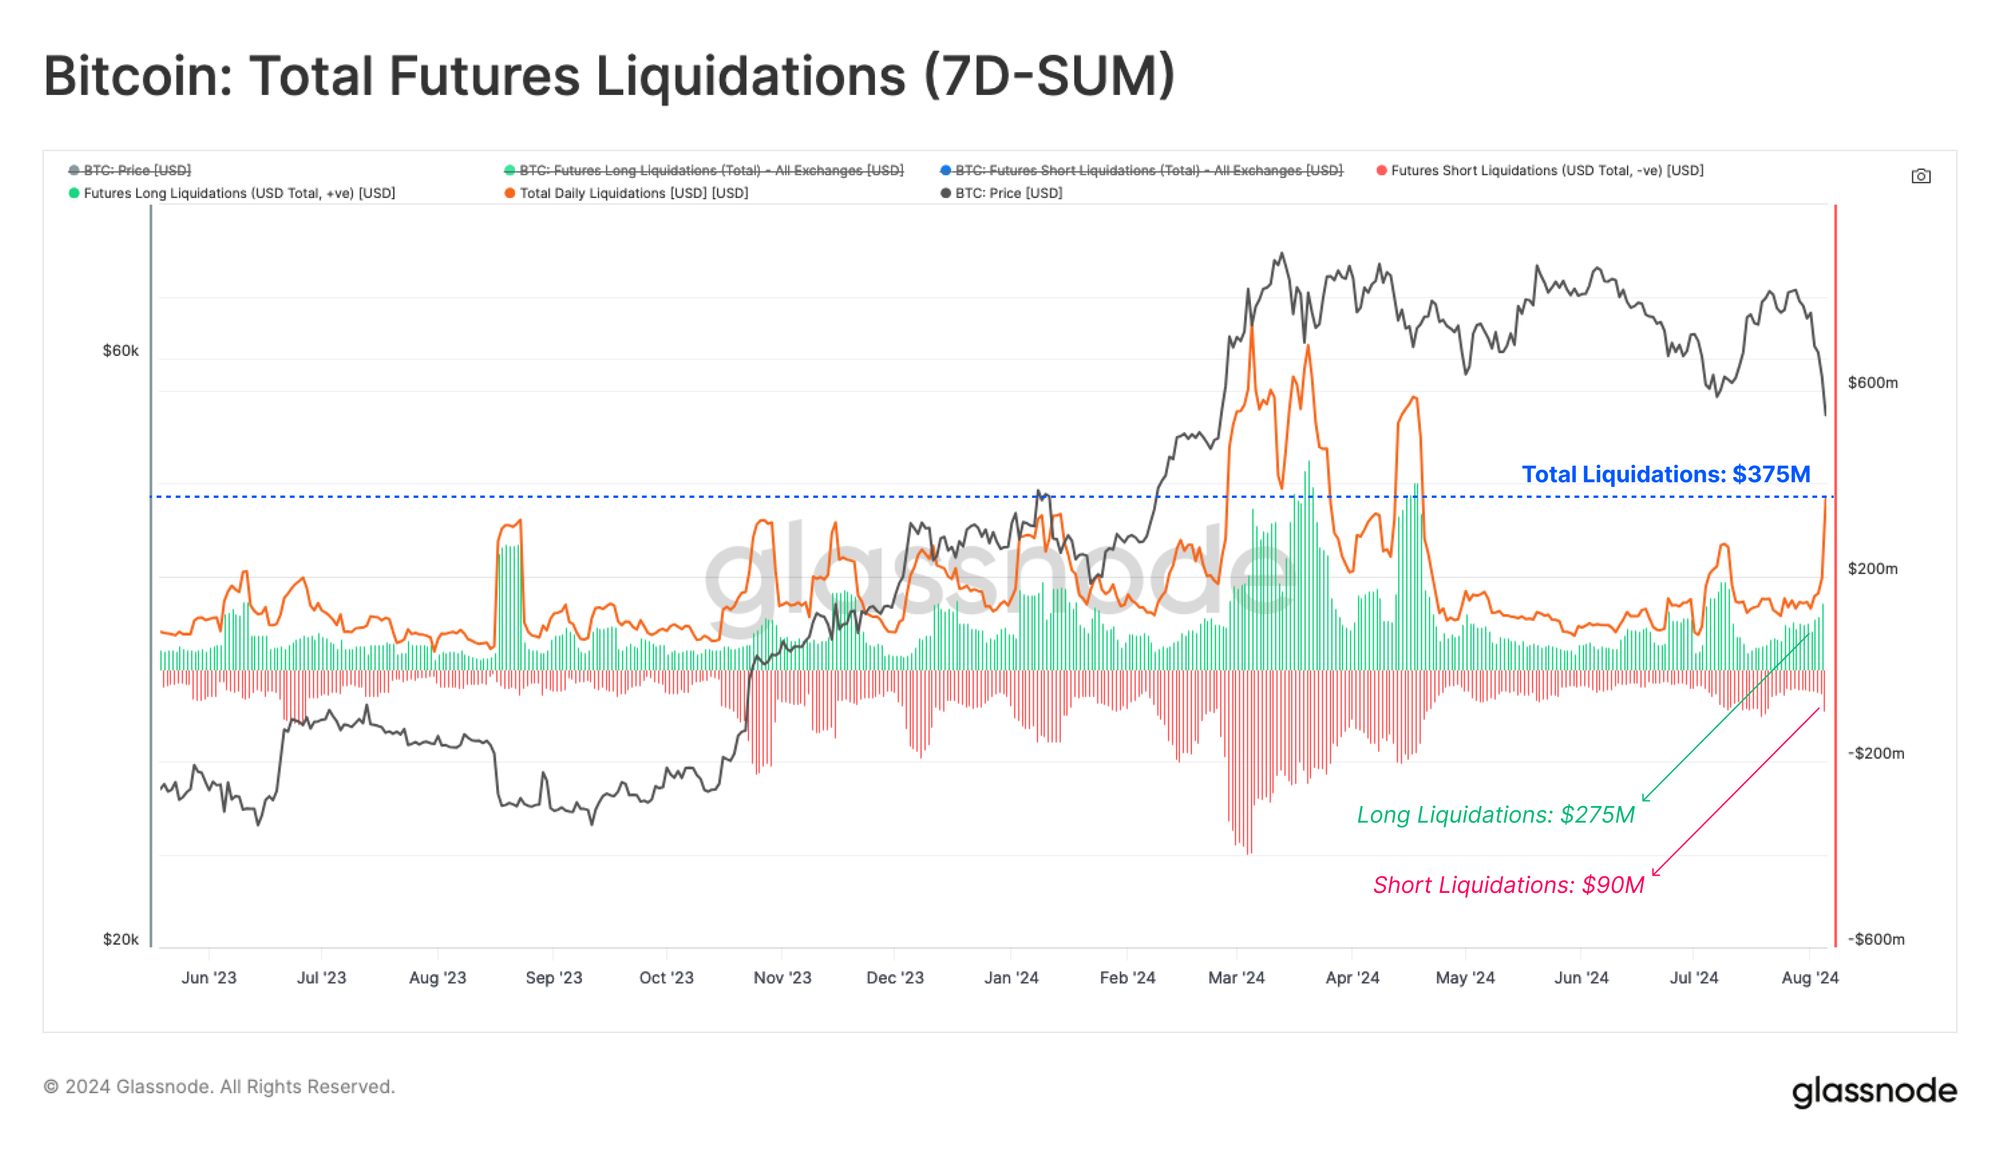
In derivatives markets, a large volume of long positions were forced closed, with a total of volume of $275m worth of long contracts liquidated. Additionally, an extra $90m was liquidated from the short-side, for combined total liquidation volume of $365m. This demonstrates how many leveraged speculators were purged from the market.
This forced closure of positions resulted in a -3 standard deviation decline in futures open interest, equivalent to an -11% reduction in one day. This likely represents a complete reset across futures markets, and suggests that spot and on-chain data will provide key insight into the recovery process in the weeks ahead.
Summary and Conclusions
August has already been a exceptionally eventful month across both equity and digital asset markets, after a “correlation-1” event sparked a major market sell-off. Bitcoin recorded its largest drawdown (-32%) from the ATH of the cycle, and precipitated a statistically significant capitulation amongst Short-Term Holders.
Futures liquidations fuelled the fire, with over $365m worth of contracts forced closed, and creating a 3 standard deviation reduction in open interest. This has led to a meaningful flush out of leverage, and paves the way for on-chain and spot market data to be of key importance for analysts assessing the recovery in the weeks to come.
Disclaimer: This report does not provide any investment advice. All data is provided for information and educational purposes only. No investment decision shall be based on the information provided here and you are solely responsible for your own investment decisions.
Exchange balances presented are derived from Glassnode’s comprehensive database of address labels, which are amassed through both officially published exchange information and proprietary clustering algorithms. While we strive to ensure the utmost accuracy in representing exchange balances, it is important to note that these figures might not always encapsulate the entirety of an exchange’s reserves, particularly when exchanges refrain from disclosing their official addresses. We urge users to exercise caution and discretion when utilizing these metrics. Glassnode shall not be held responsible for any discrepancies or potential inaccuracies. Please read our Transparency Notice when using exchange data.
- Join our Telegram channel
- For on-chain metrics, dashboards, and alerts, visit Glassnode Studio
- For automated alerts on core on-chain metrics and activity on exchanges, visit our Glassnode Alerts Twitter