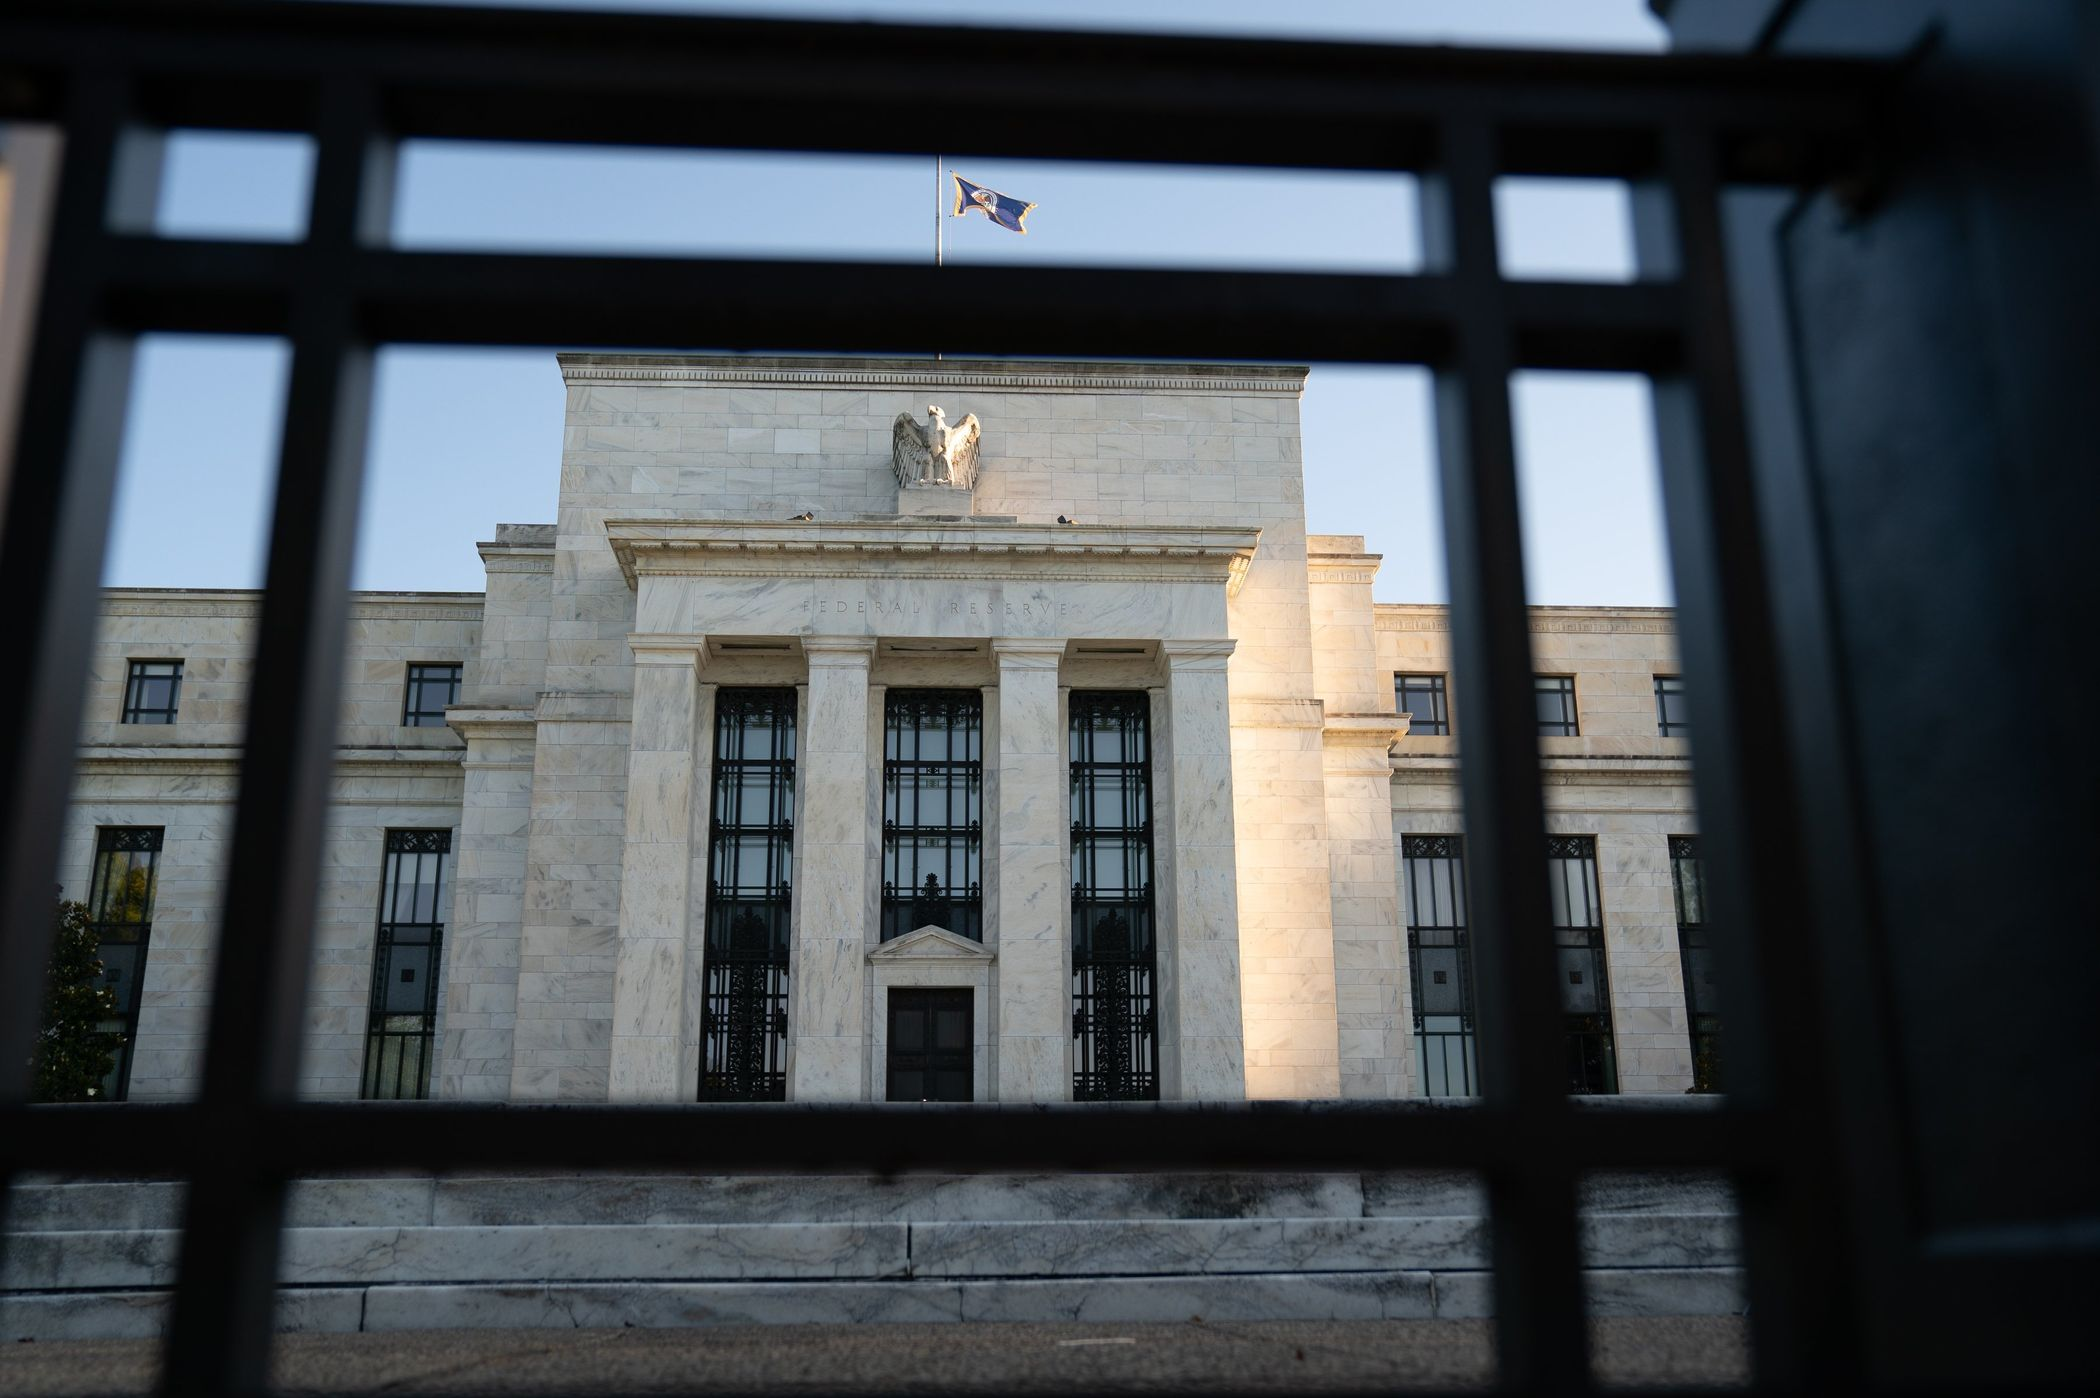
The Fed is striving to tame inflation, which is at different levels depending on how it is measured. PHOTO: ERIN SCOTT/BLOOMBERG NEWS
If core inflation came in just below 3%, the Federal Reserve would breathe a huge sigh of relief, stocks would head to the races and consumers could relax about the rising cost of living.
It isn’t merely a dream: Measure U.S. price changes the way Europe does, and inflation was already there in May. Measure them as the U.S. does, and on Wednesday new figures are predicted by economists to show core inflation far higher, at 5% for June.
The U.S. and Europe use different methods to calculate inflation data, but the Bureau of Labor Statistics calculates American price rises the European way too, although the statistic remains obscure.
Right now, measuring U.S. inflation using the two methods shows radically different results. Investors who think they have a handle on the current consensus—that underlying inflation is falling but not fast enough for the Fed—should be troubled by the alternative message coming from the much lower European version of the figures.
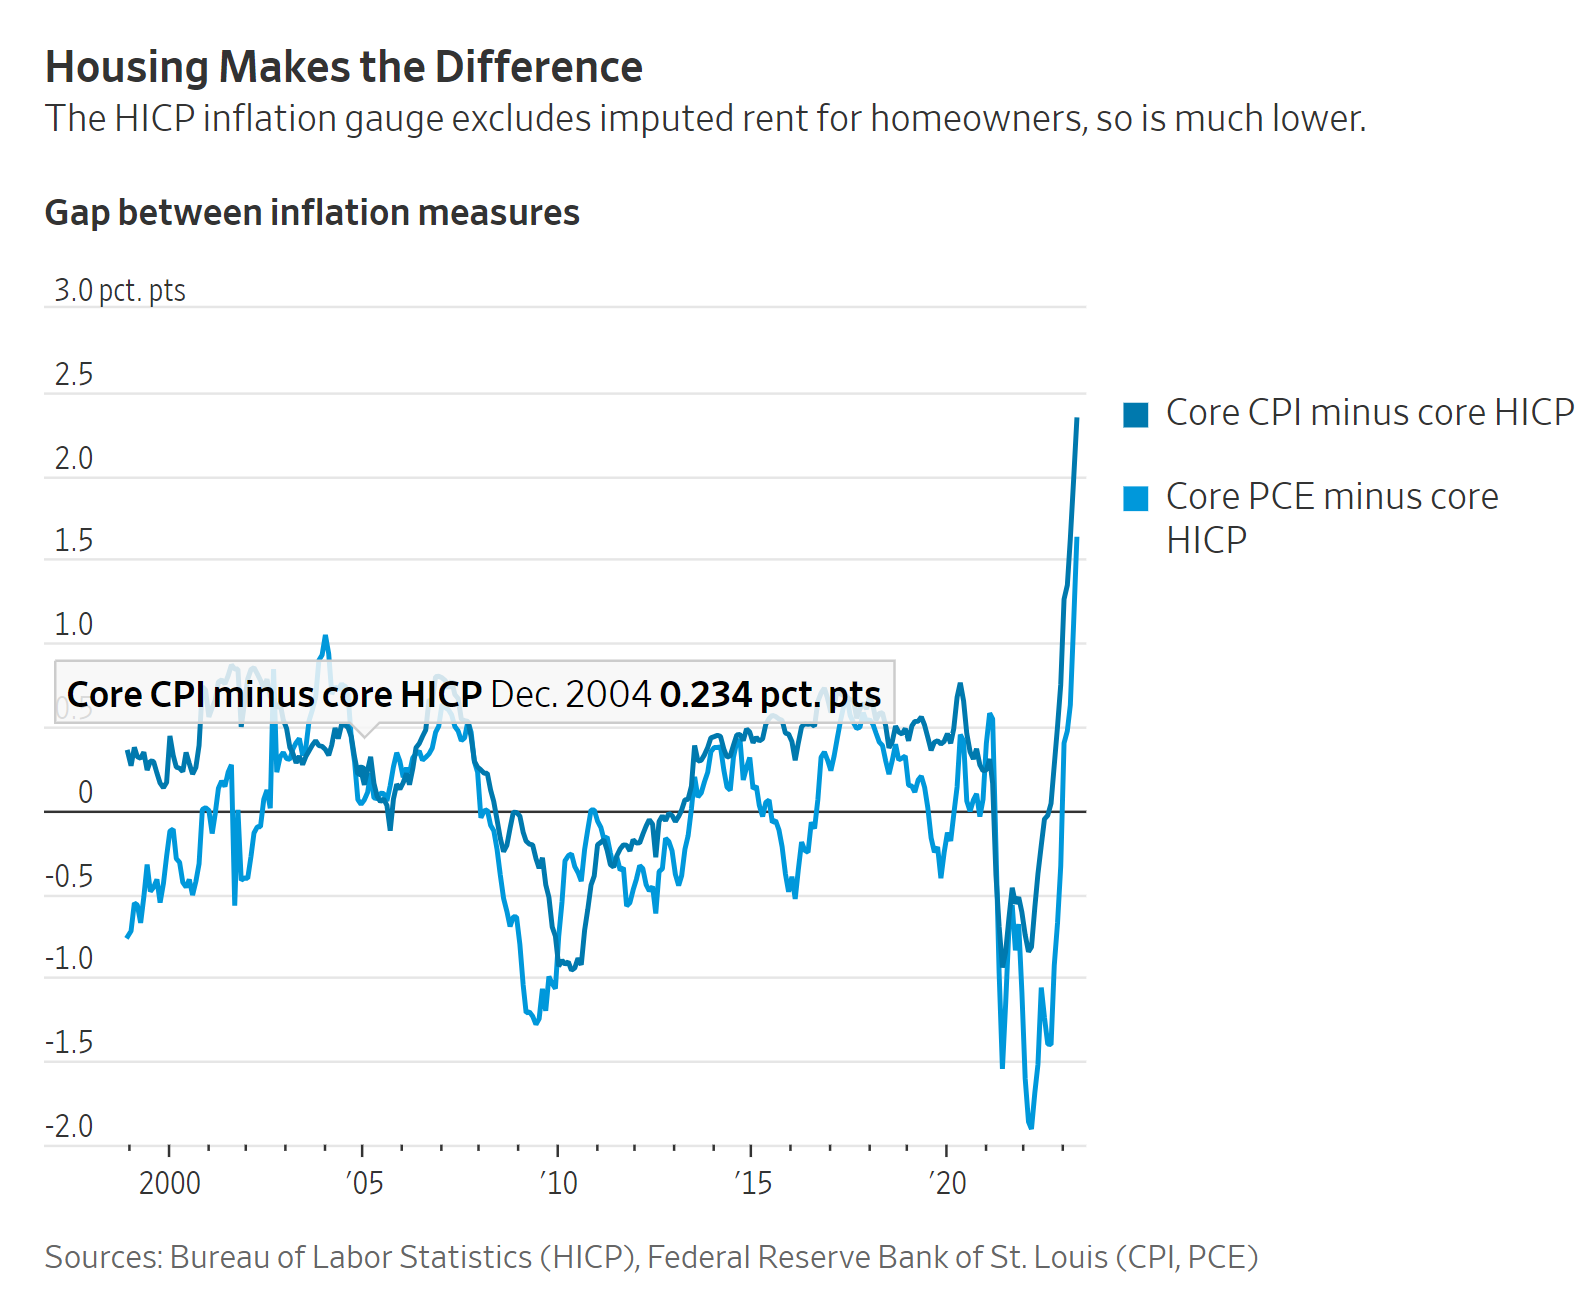
U.S. core inflation—which excludes volatile food and energy—measured using the standard consumer-price index was 2.3 percentage points higher than the European-style inflation, known as the harmonized index of consumer prices. It is the biggest gap there has ever been.
The main reason is that Europe’s measure, known as HICP, doesn’t include the imaginary cost of what a homeowner would pay to rent their house, which makes up about a third of the U.S. core CPI. Known as “owners’ equivalent rent” or imputed rent, the measure has long had its critics.
Exclude something that no one actually pays, and which is calculated from guesses by homeowners of the rental value of their house, and core inflation’s looking basically fine, at a fraction under 3%. I’ve concentrated on core inflation, because food and oil prices swing so much that they make it hard to tell if the economy is generating inflation pressures the central bank needs to tackle.
So why is everyone still so concerned about inflation?
The answer is partly about biases and partly about change, but it is mostly about worries that the economy is running too hot to be confident that inflation will come down to the 2% target.
The bias is that CPI is long established and widely used in the U.S. The Bureau of Labor Statistics produces its own HICP inflation data as an experimental measure; many economists and investors don’t even realize it is available.
To make matters even more confusing, CPI gets almost all the focus, even though the Fed sets its inflation target based on the personal-consumption expenditures price index, PCE, from the Bureau of Economic Analysis. PCE comes in lower than CPI, but still puts large weight on imputed rent that isn’t actually paid.
Even if the Fed thought HICP was better—and there is no sign it does—there is no way it could change the measure without drawing political heat. Inflation figures are already subject to deep skepticism from some economists, who point out that improvements to the indexes usually make inflation come in lower than on older methods.
The most important question that the gauges seek to answer is whether the underlying pressures are so strong that the economy needs to be restrained further. Will a strong jobs market mean workers flush with pay increases can consume more, keeping demand up and so allowing companies to raise prices?
If so, the Fed will have to keep raising rates. The lower core HICP inflation suggests the problem of a strong jobs market is less worrisome than on the CPI measure. But hawks are concerned that continued above-inflation pay increases will push inflation up, as companies pass on higher costs. Persistent inflation above 2% might push up expectations of inflation, in turn leading to more pay demands.
Alternatively, will companies facing more expensive borrowing trim spending, hire fewer people and resist pay demands? If so, wages will moderate, demand fall and the Fed relax—at least so long as slowdown doesn’t turn into recession. Doves point to tentative signs that jobs are less plentiful, with initial unemployment claims up and wage increases decelerating for the hourly, less-skilled and lower-paid workers who were most in demand. Doves are also reassured by inflation expectations from consumers and investors not far from the 2% target.
Indicators that have a history of moving in tandem often converge again after a period of moving apart. CPI and PCE might well come down toward HICP, because rent increases have slowed. Unfortunately, even if core inflation does drop more, it will still be too high for comfort on the CPI and PCE gauges that investors and the Fed focus on.
Inflation isn’t the only place where the economic signals are haywire. Lots of the usual indicators of what the economy is doing and where it is going are telling different stories, something I’ll come back to in the next Streetwise. Meanwhile, all of this leaves me concerned—and confused, never a good place to be when trying to figure out what the market will do next.