Bitcoin bounced more than 7% on the day, setting a local top at $29,088, its highest since early May.
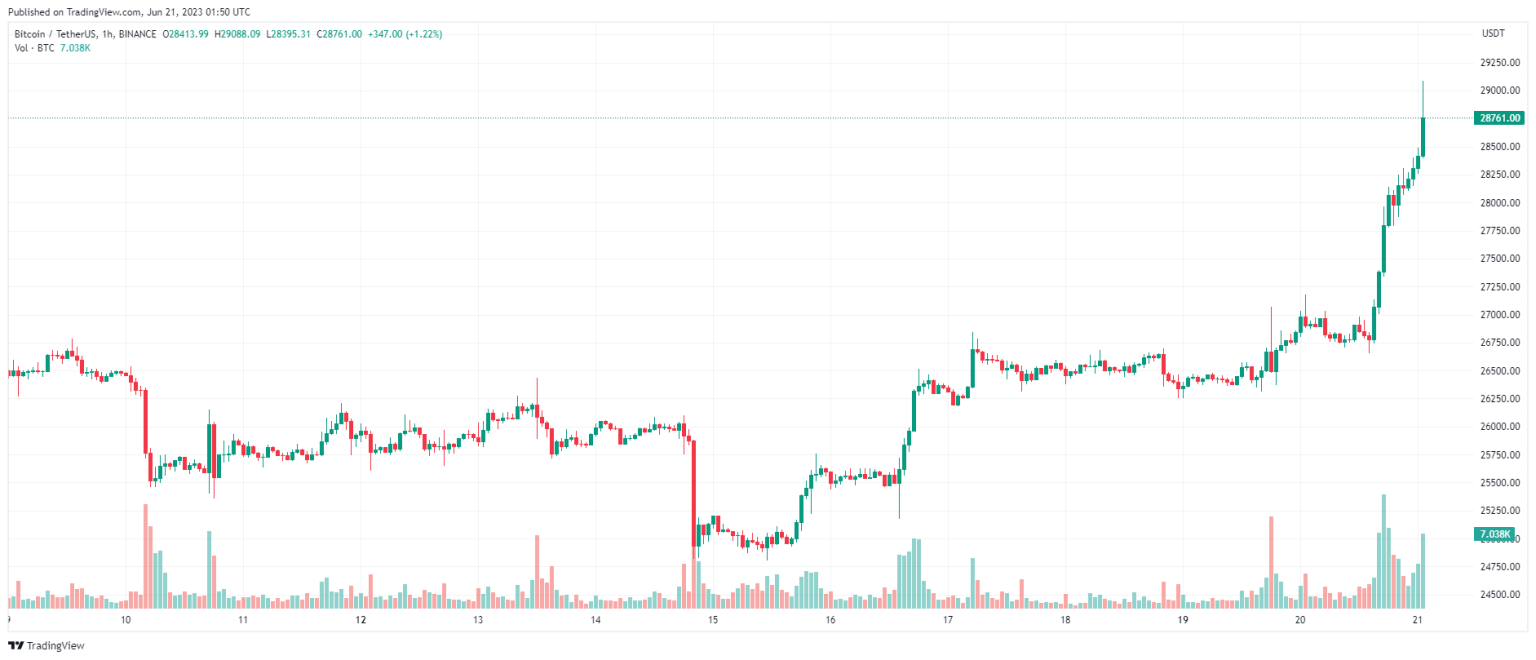
BTC Price Chart – 1 hour | Source: TradingView
US Stocks
US stocks fell back on June 20 after a strong rally last week.
The Dow Jones Industrial Average fell 245 points, or 0.72%, to 34,053.87, the S&P 500 fell 0.47% to 4,388.71, and the Nasdaq Composite lost 0.16% to 13,667. 29 points.
The number of losers was higher than the number of advancers on the NYSE, with a ratio of 2.2:1 on June 20. Energy was the biggest loser in the S&P 500, with a drop of more than 2%. And Intel, Nike and Boeing dragged down the Dow Jones, with each share falling more than 3%.
Meanwhile, housing stocks outperformed on July 20 after a stronger-than-expected housing report. PulteGroup, DR Horton and Lennar are all up more than 1%. Meanwhile, Nvidia also bucked the trend, bouncing up more than 2%.
Prior to that, US investors had just had a strong week, with the S&P 500 hitting its highest level since April 2022. The S&P 500 and Nasdaq Composite posted their biggest weekly gains since March 2023, with gains of 2.6% and 3.25%, respectively. This is also the 5th consecutive week of gains for the S&P 500.
Meanwhile, gold prices fell on Tuesday (June 21) on strong US housing starts data and a stronger dollar, while investors awaited the US Federal Reserve Chairman's hearing. (Fed), Jerome Powell, at Capitol Hill looking for signals on the interest rate path.
At the end of the session, the spot gold contract fell 0.7 percent to $1,936.98 an ounce, after losing as much as 1% at the beginning of the session. Gold futures contract lost 1.2% to 1,947.7 USD/oz.
Bitcoin and Altcoins
Glassnode explained that Bitcoin investors may still have to wait 8 to 18 months before the market can establish a new ATH.
In the short-term, Bitcoin has shown strong upside momentum as it bounced near 7% on the day, hitting a local top just above the $29,000 region.
According to its latest weekly report, the on-chain analytics firm has been trying to estimate how the BTC cycle might play out. To figure this out, Glassnode identified the different phases of a cycle and compared the times of these phases between each cycle.
The first stage is the “bull market”. Glassnode has chosen the cycle bottom as the starting point for this period and the cycle top as the end point. The second phase will be a “bear market”, which starts at the top and ends at the next bottom.
Finally, there is the “transition” phase, which occurs during the transition period between the new low and high of the cycle. Currently, this is the stage that investors need to pay attention to.
The following chart shows how long each of the above periods has lasted for the last few Bitcoin cycles and what the current cycle looks like.
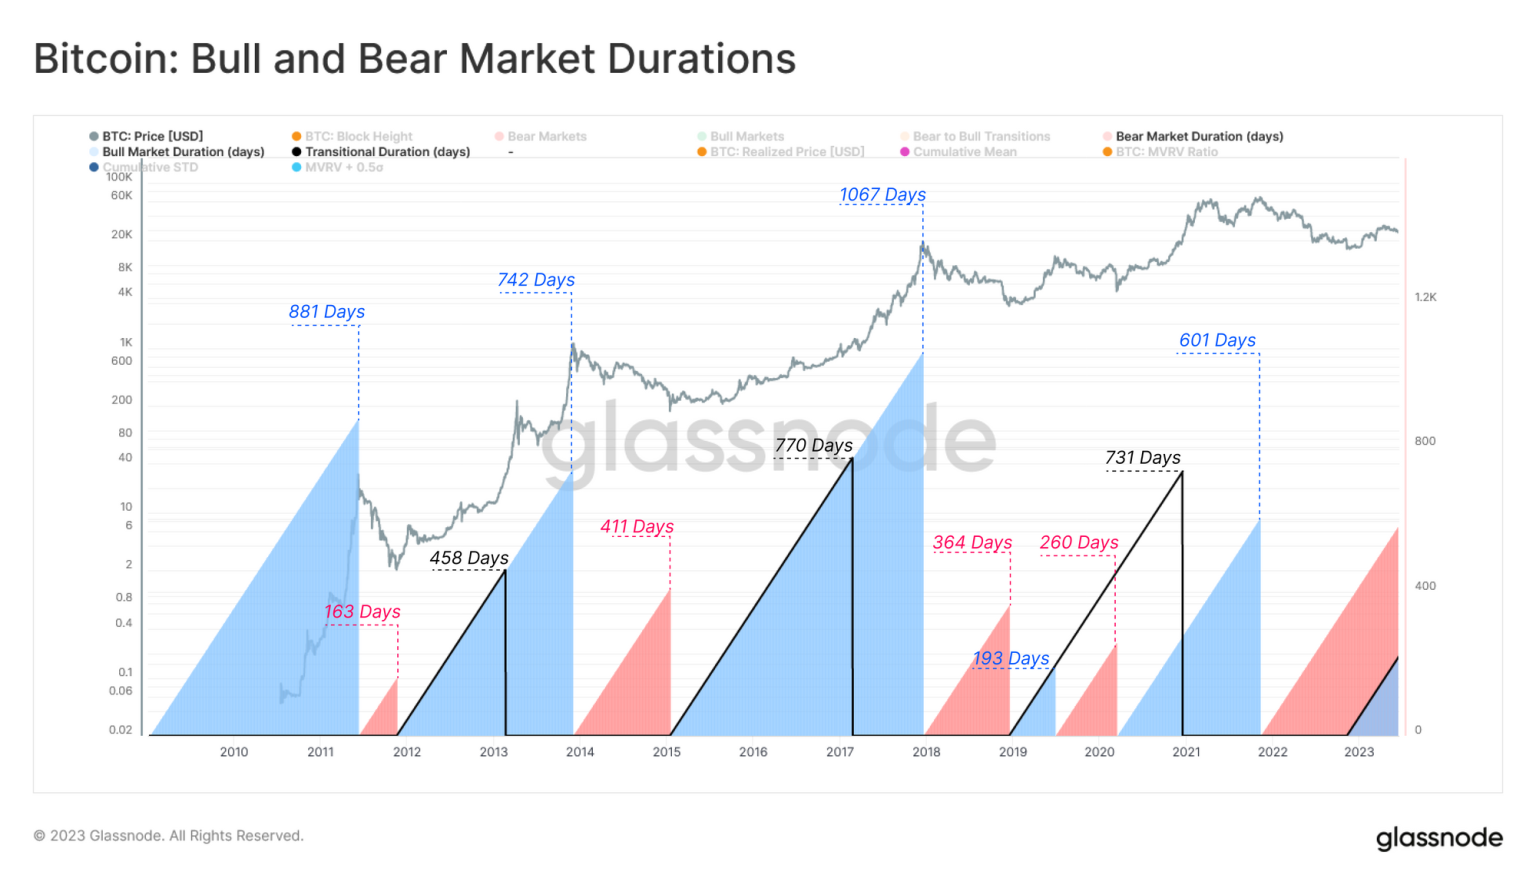
Source: Glassnode
The last three Bitcoin transition periods have different durations, with the first lasting 458 days, while the two more recent ones are 770 and 731 days, respectively.
Naturally, this means, cycles must go through this number of days after a bear market bottom is established before the price can reach a new ATH.
In the current cycle, it is still uncertain what stage the market is in. If counting from the low in November 2022 after the crash caused by the collapse of the FTX exchange, BTC will be in a transition phase at the moment.
So far, the cryptocurrency has spent about 221 days in the transition zone, much lower than the period in which similar periods of previous cycles have taken place.
If these transitions once lasted from 458 days to 770 days, the current market may still have another 8-18 months before the transition period ends and the price establishes a new all-time high.
Of course, this would only happen assuming that the market bottomed out in November 2022. Otherwise, the Bitcoin market will still be in a bearish phase.
The altcoin market bounced sharply in the short-term, as BTC hit the $29,000 mark.
Stacks (STX) is the project that recorded the highest profit in the top 100, when it bounced more than 20% during the day. On the weekly timeframe, this altcoin has bounced up to over 40%.
Followed by Conflux (CFX), Optimism (OP), Flow (FLOW), Injective (INJ), Pepe (PEPE), WOO Network (WOO) with over 10% growth.
Arbitrum (ARB), Kava (KAVA), Hedera (HBAR), Fantom (FTM), Dash (DASH), Synthetix (SNX)… also increased strongly from 6-9%.
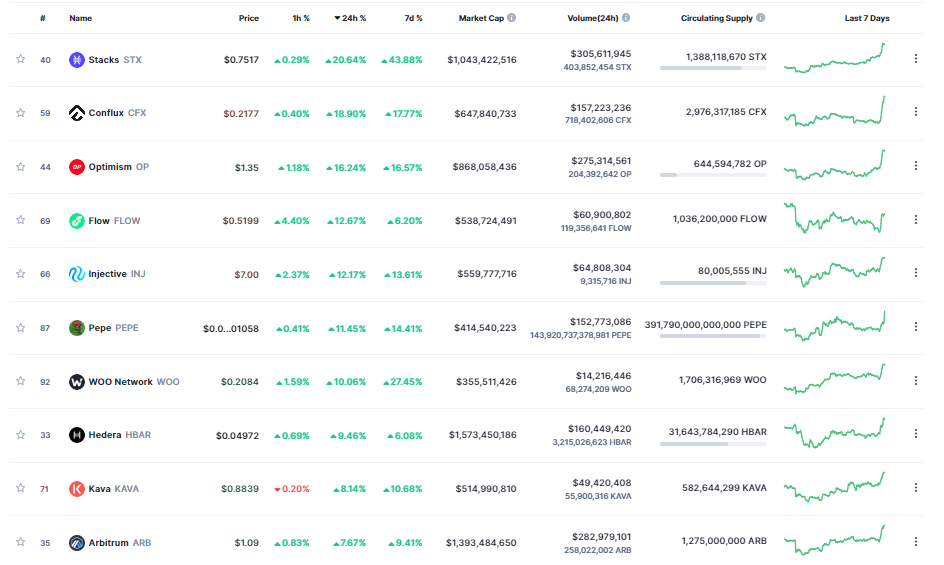
Source: Coinmarketcap
Ethereum (ETH) has also successfully reclaimed the $1,800 area, having established a local top at $1,828 and is currently trading around $1,807, up over 4% over the past 24 hours.
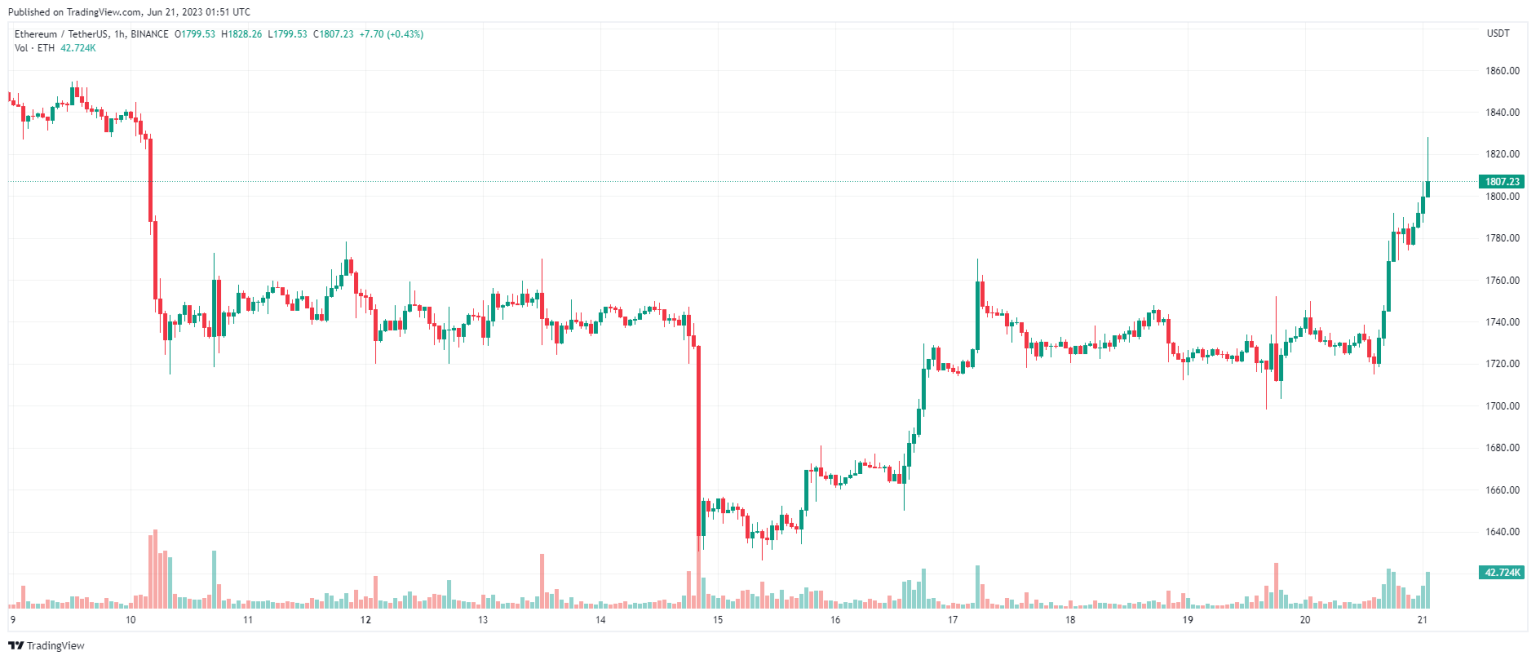
ETH price chart – 1 hour | Source: TradingView