Three signs that Bitcoin is finding its market bottom

cointelegraphPublished on 2025-12-24Last updated on 2025-12-24

Abstract

Bitcoin (BTC) may be approaching a local bottom after falling over 35% from its recent all-time high. Key signals suggest selling pressure is fading. The weekly Stochastic RSI has turned up from oversold levels—a pattern seen near major historical bottoms. A bullish divergence on the three-day chart, where price made a lower but momentum did not, further supports this. Miners are showing signs of capitulation, with a 4% drop in hash rate over 30 days—a historically bullish signal that has preceded strong medium-term returns. Macro conditions also hint at a potential reversal. The National Financial Conditions Index (NFCI) suggests a Bitcoin rally could begin within 4–6 weeks, similar to past cycles. Despite these positive signs, some analysts still predict further downside, with targets as low as $70,000–$25,000.

Bitcoin (BTC) may establish a local bottom after dropping by over 35% from its record high of around $126,200 established two months ago, based on a mix of technical and on-chain indicators.

Key takeaways:

  • Momentum, miner capitulation, and liquidity indicators point to fading selling pressure.

  • Macro liquidity suggests a BTC recovery could begin within the next 4–6 weeks.

Bitcoin sellers nearing exhaustion

As of December, Bitcoin’s weekly Stochastic RSI had turned up from oversold levels, a setup that has historically appeared near key inflexion points, before the price rebounded, as highlighted by trader Jesse in the chart below.

BTC/USD weekly chart. Source: TradingView/Jelle

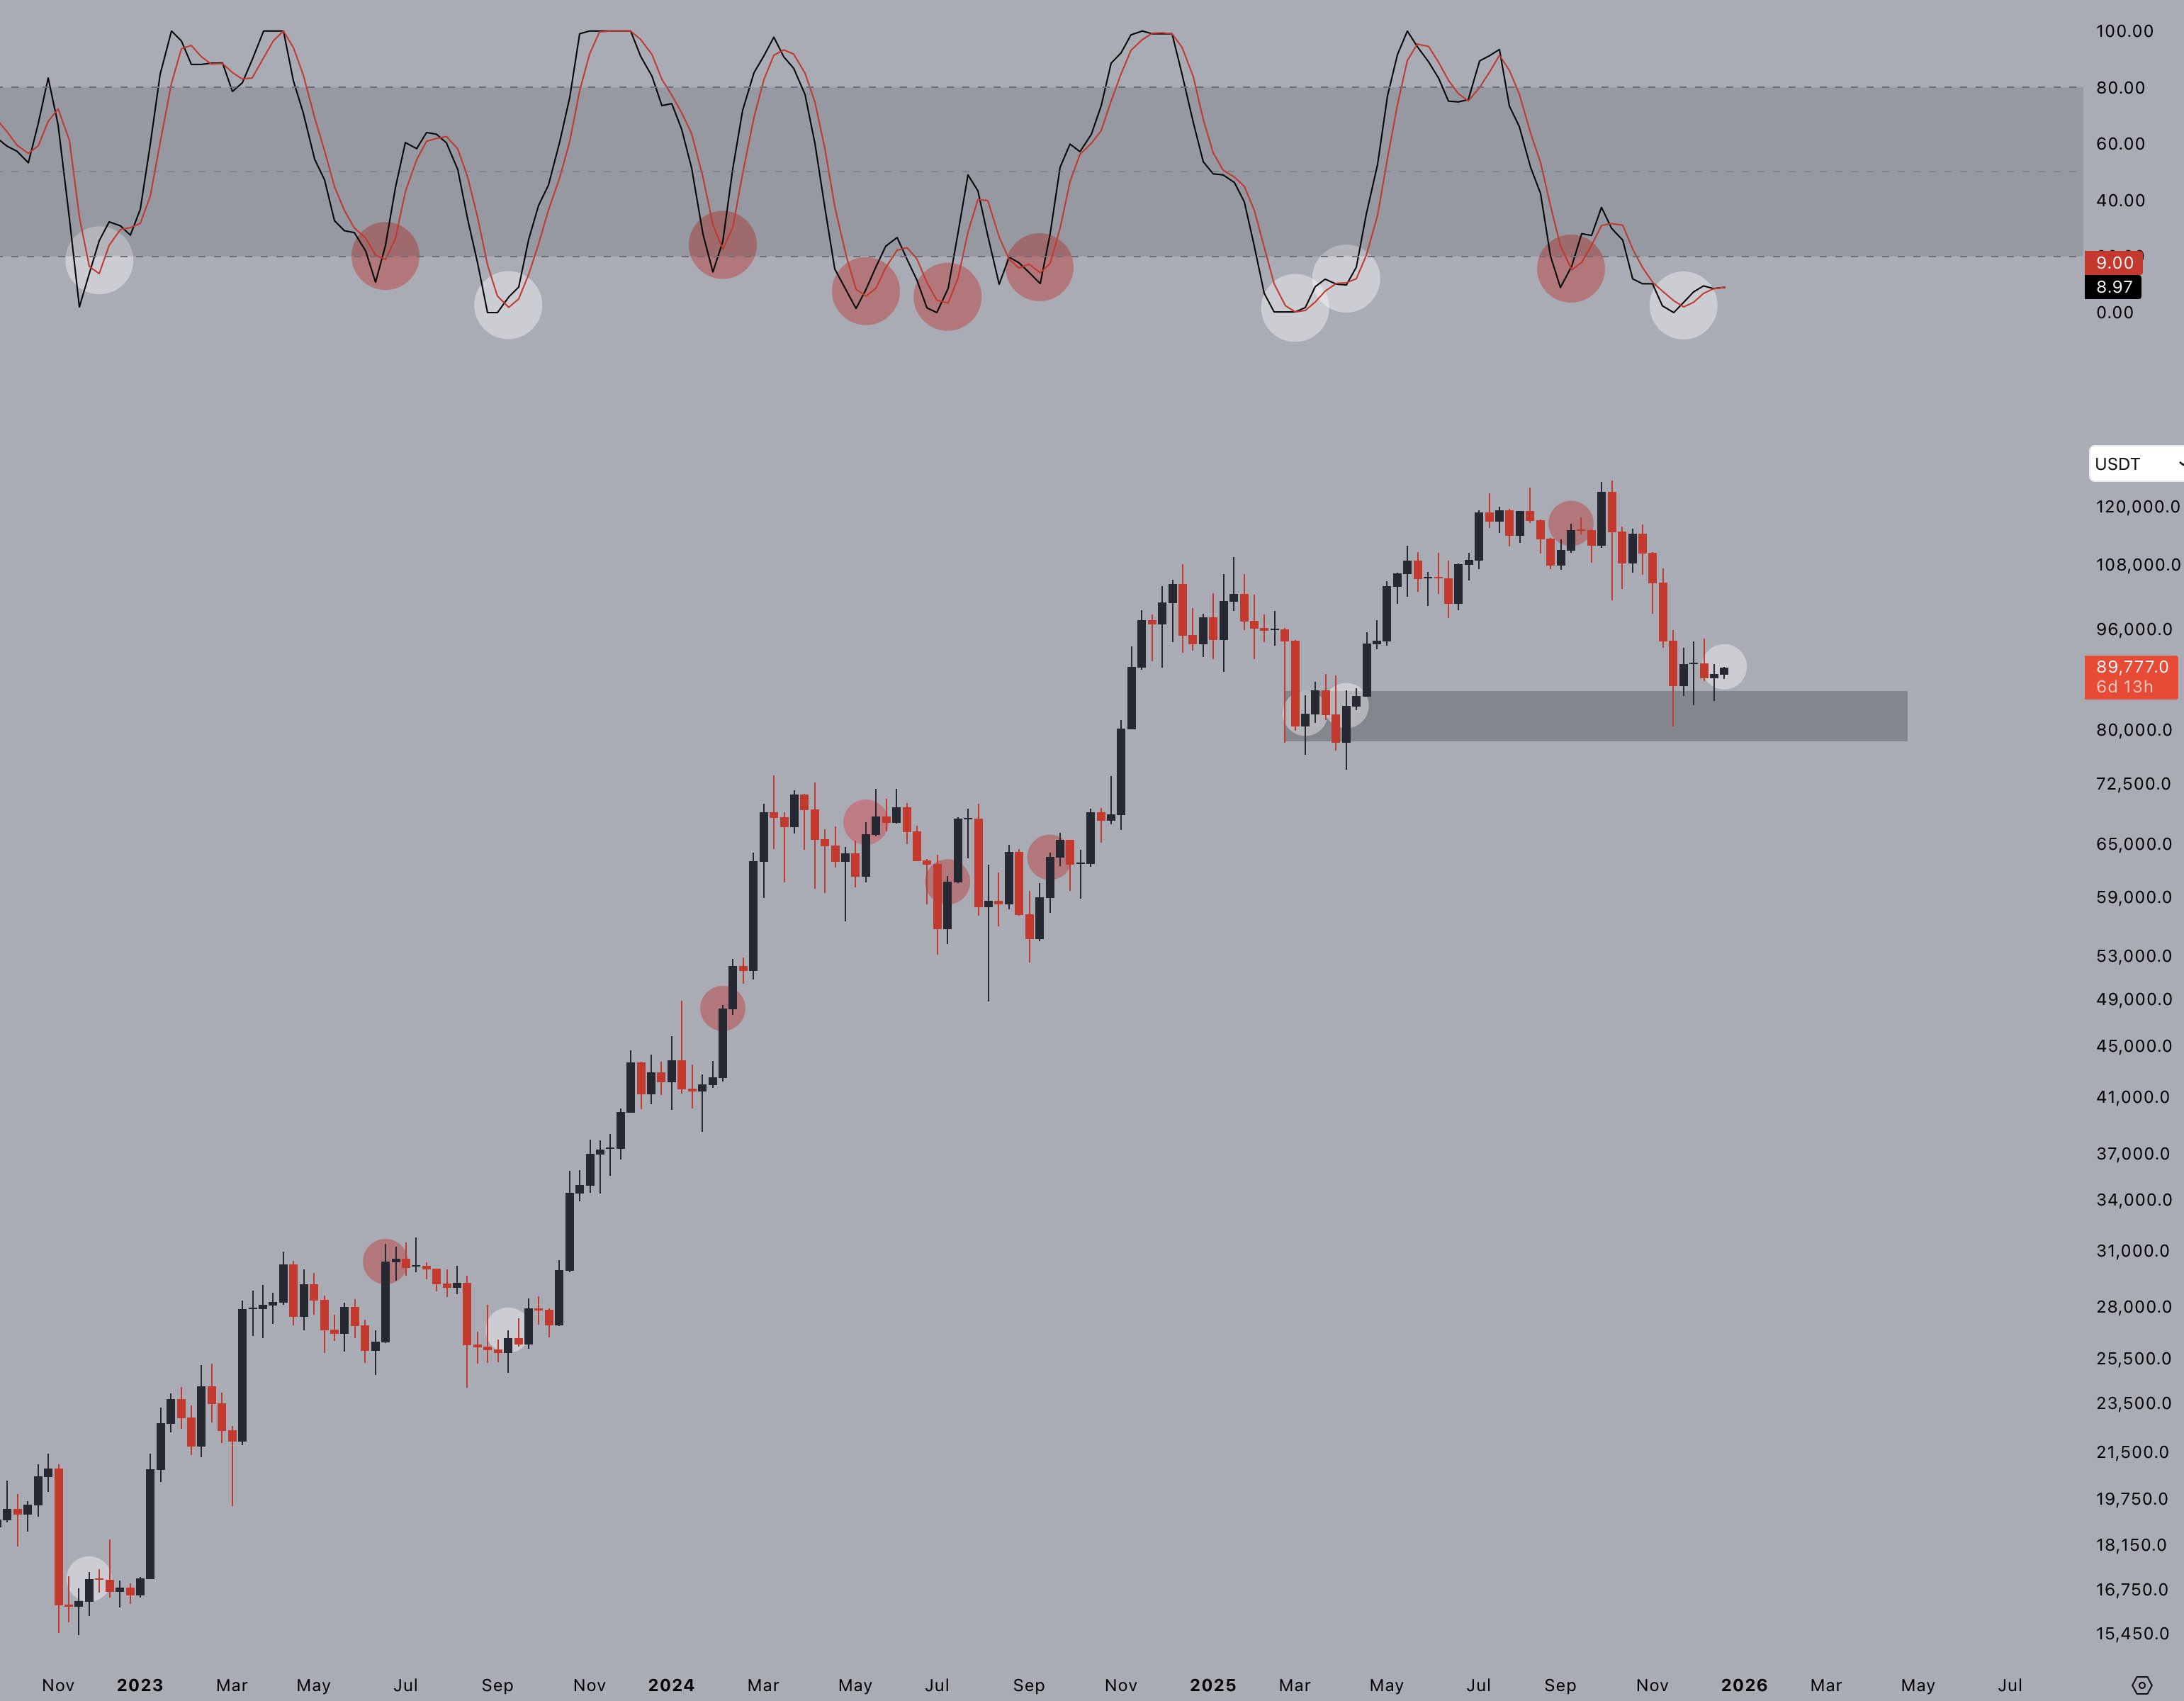
Similar bullish crosses emerged in early 2019 (after BTC bottomed near $3,200), March 2020 (the COVID crash low near $3,800), and late 2022 (around the $15,500 cycle low). In each case, momentum shifted first, while price lagged.

Adding to the signal, Bitcoin’s three-day chart is printing a bullish divergence where price made a lower low, but momentum did not.

BTC/USD three-day chart. Source: TradingView/Jelle

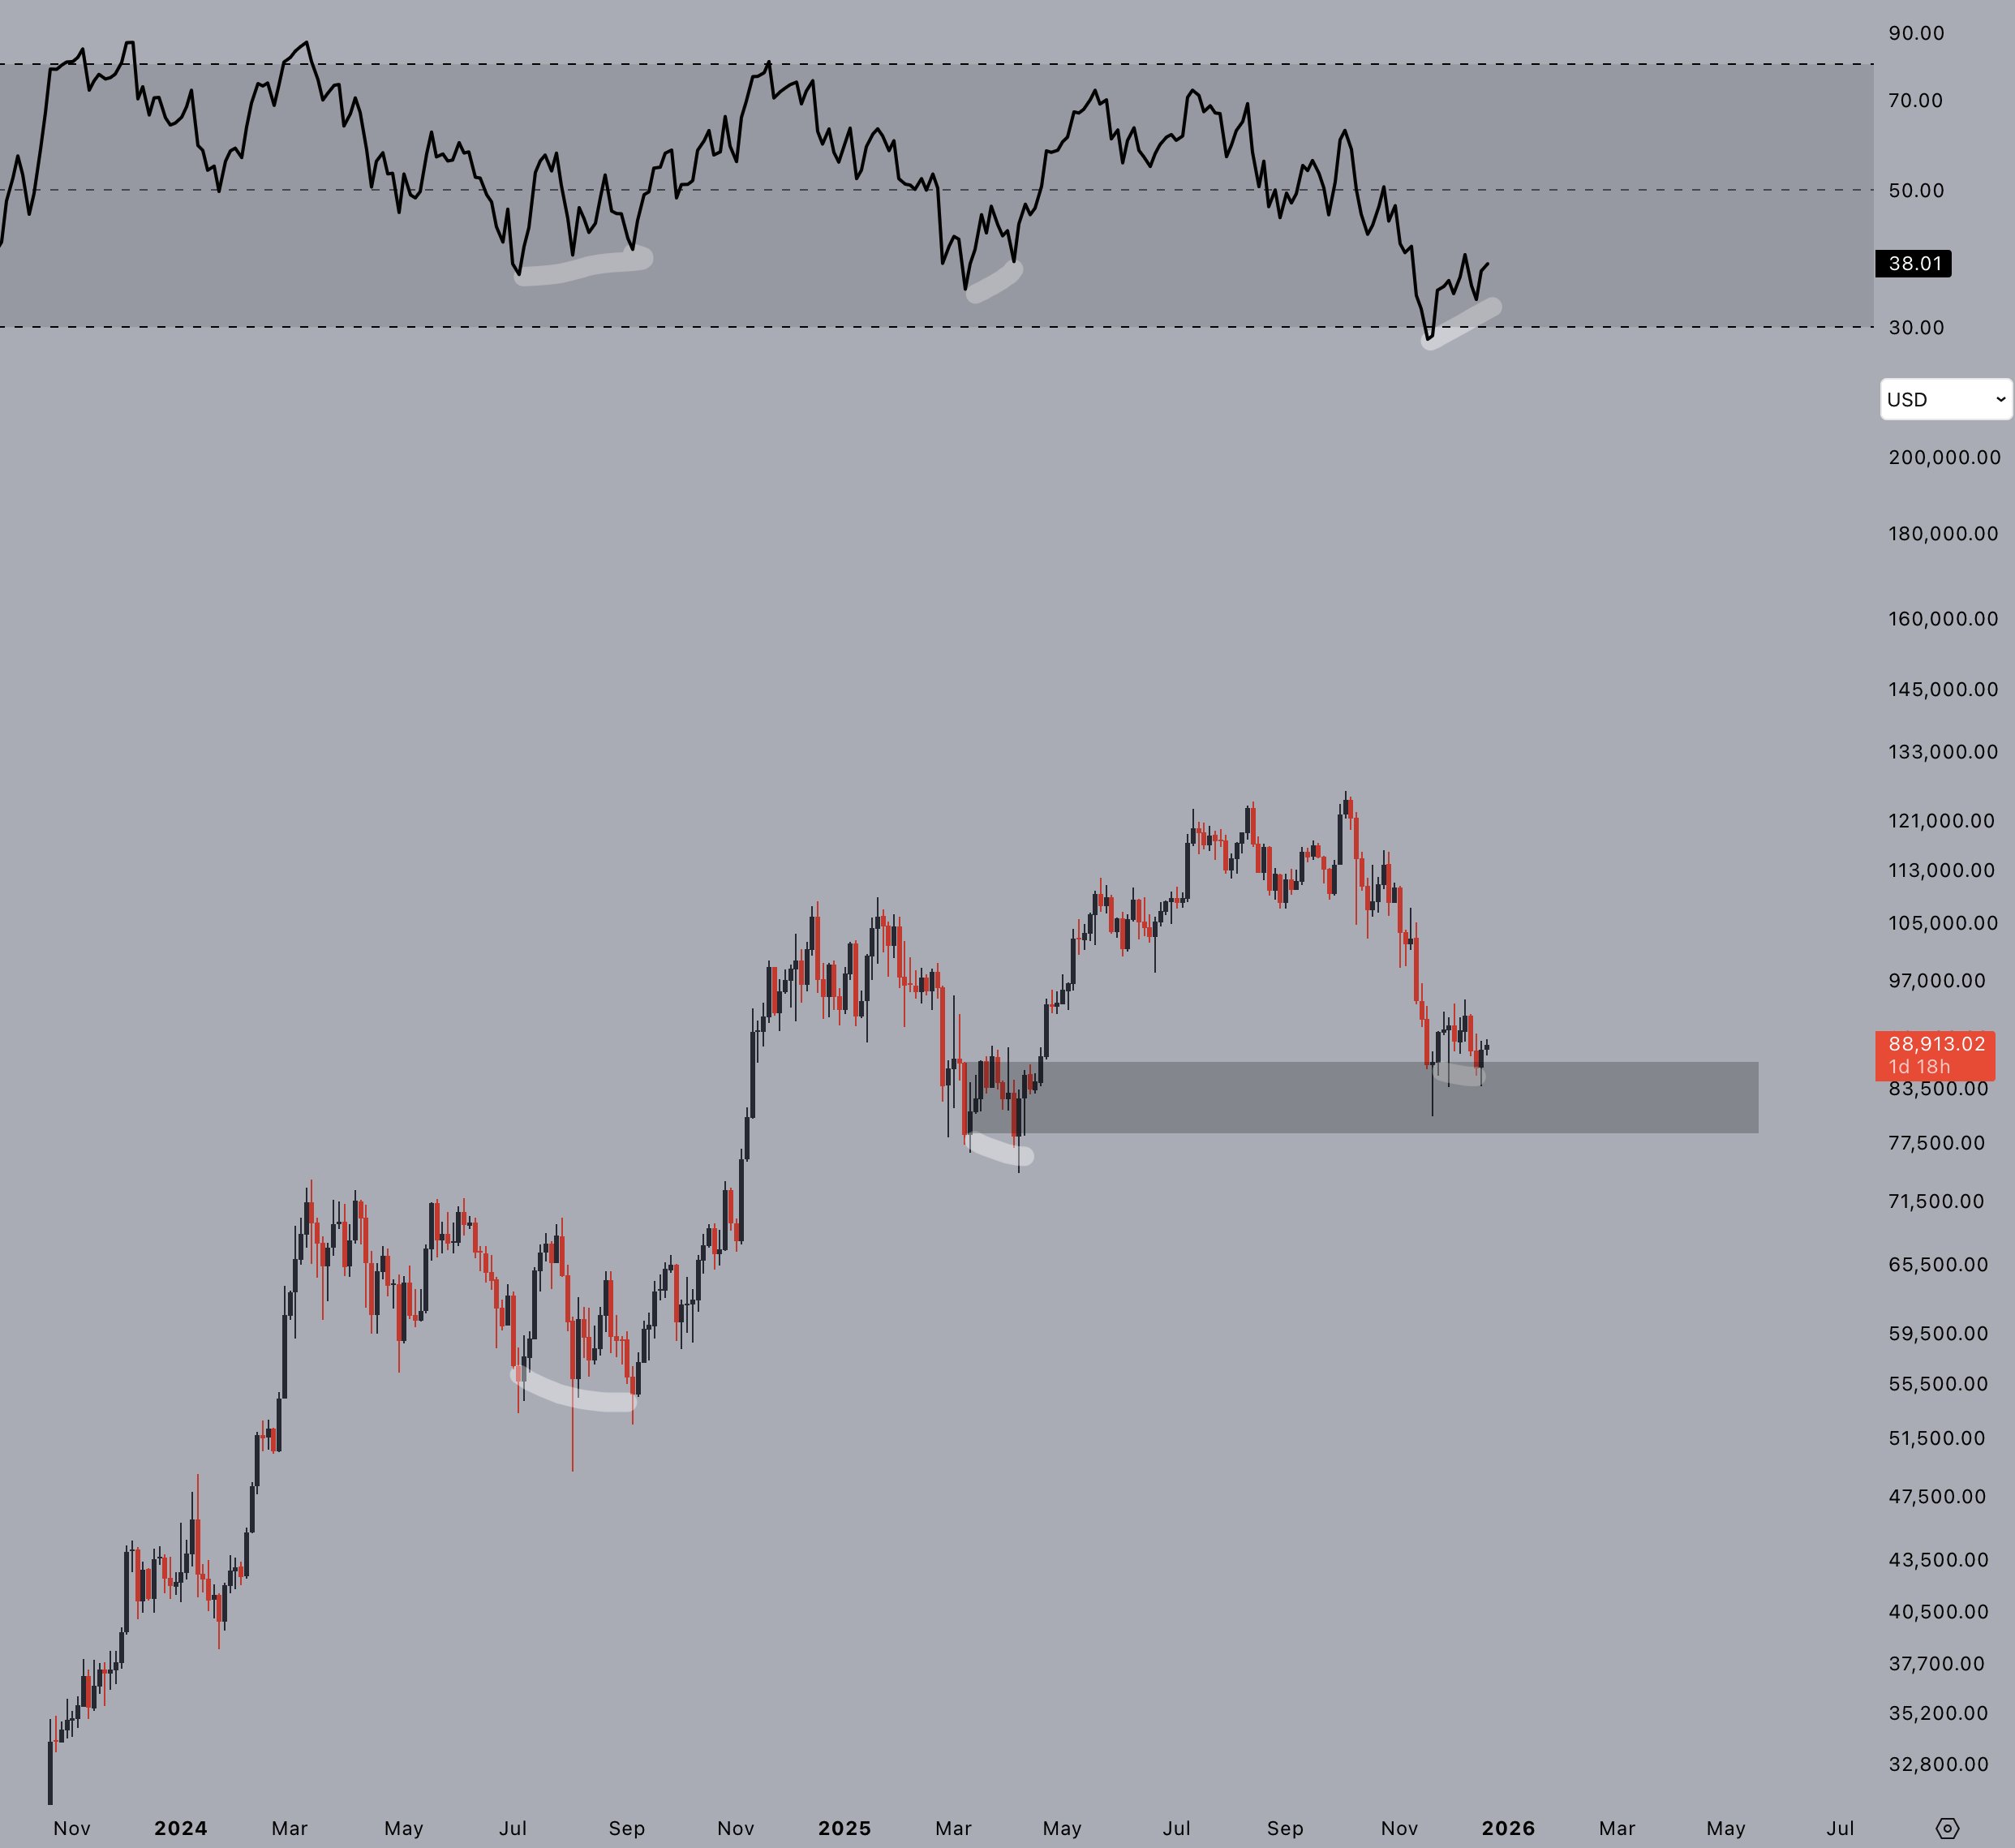
This pattern also appeared ahead of the mid-2021 correction low and the FTX-driven bottom in 2022, both of which preceded multi-month recoveries.

These signals suggest selling pressure in the Bitcoin market may be exhausted in the near future, a condition more typical of market bottoms than temporary relief rallies.

Bitcoin miner capitulation shows BTC bottom is in

Bitcoin’s hashrate fell 4% in the month to Dec. 15, a development VanEck analysts Matt Sigel and Patrick Bush viewed as “a bullish contrarian signal” linked to miner capitulation.

Periods of sustained hash rate compression have historically preceded stronger Bitcoin returns, they said, explaining that since 2014, BTC posted positive 90-day returns 65% of the time following 30-day hashrate declines.

Bitcoin mean hash rate vs. price. Source: Glassnode

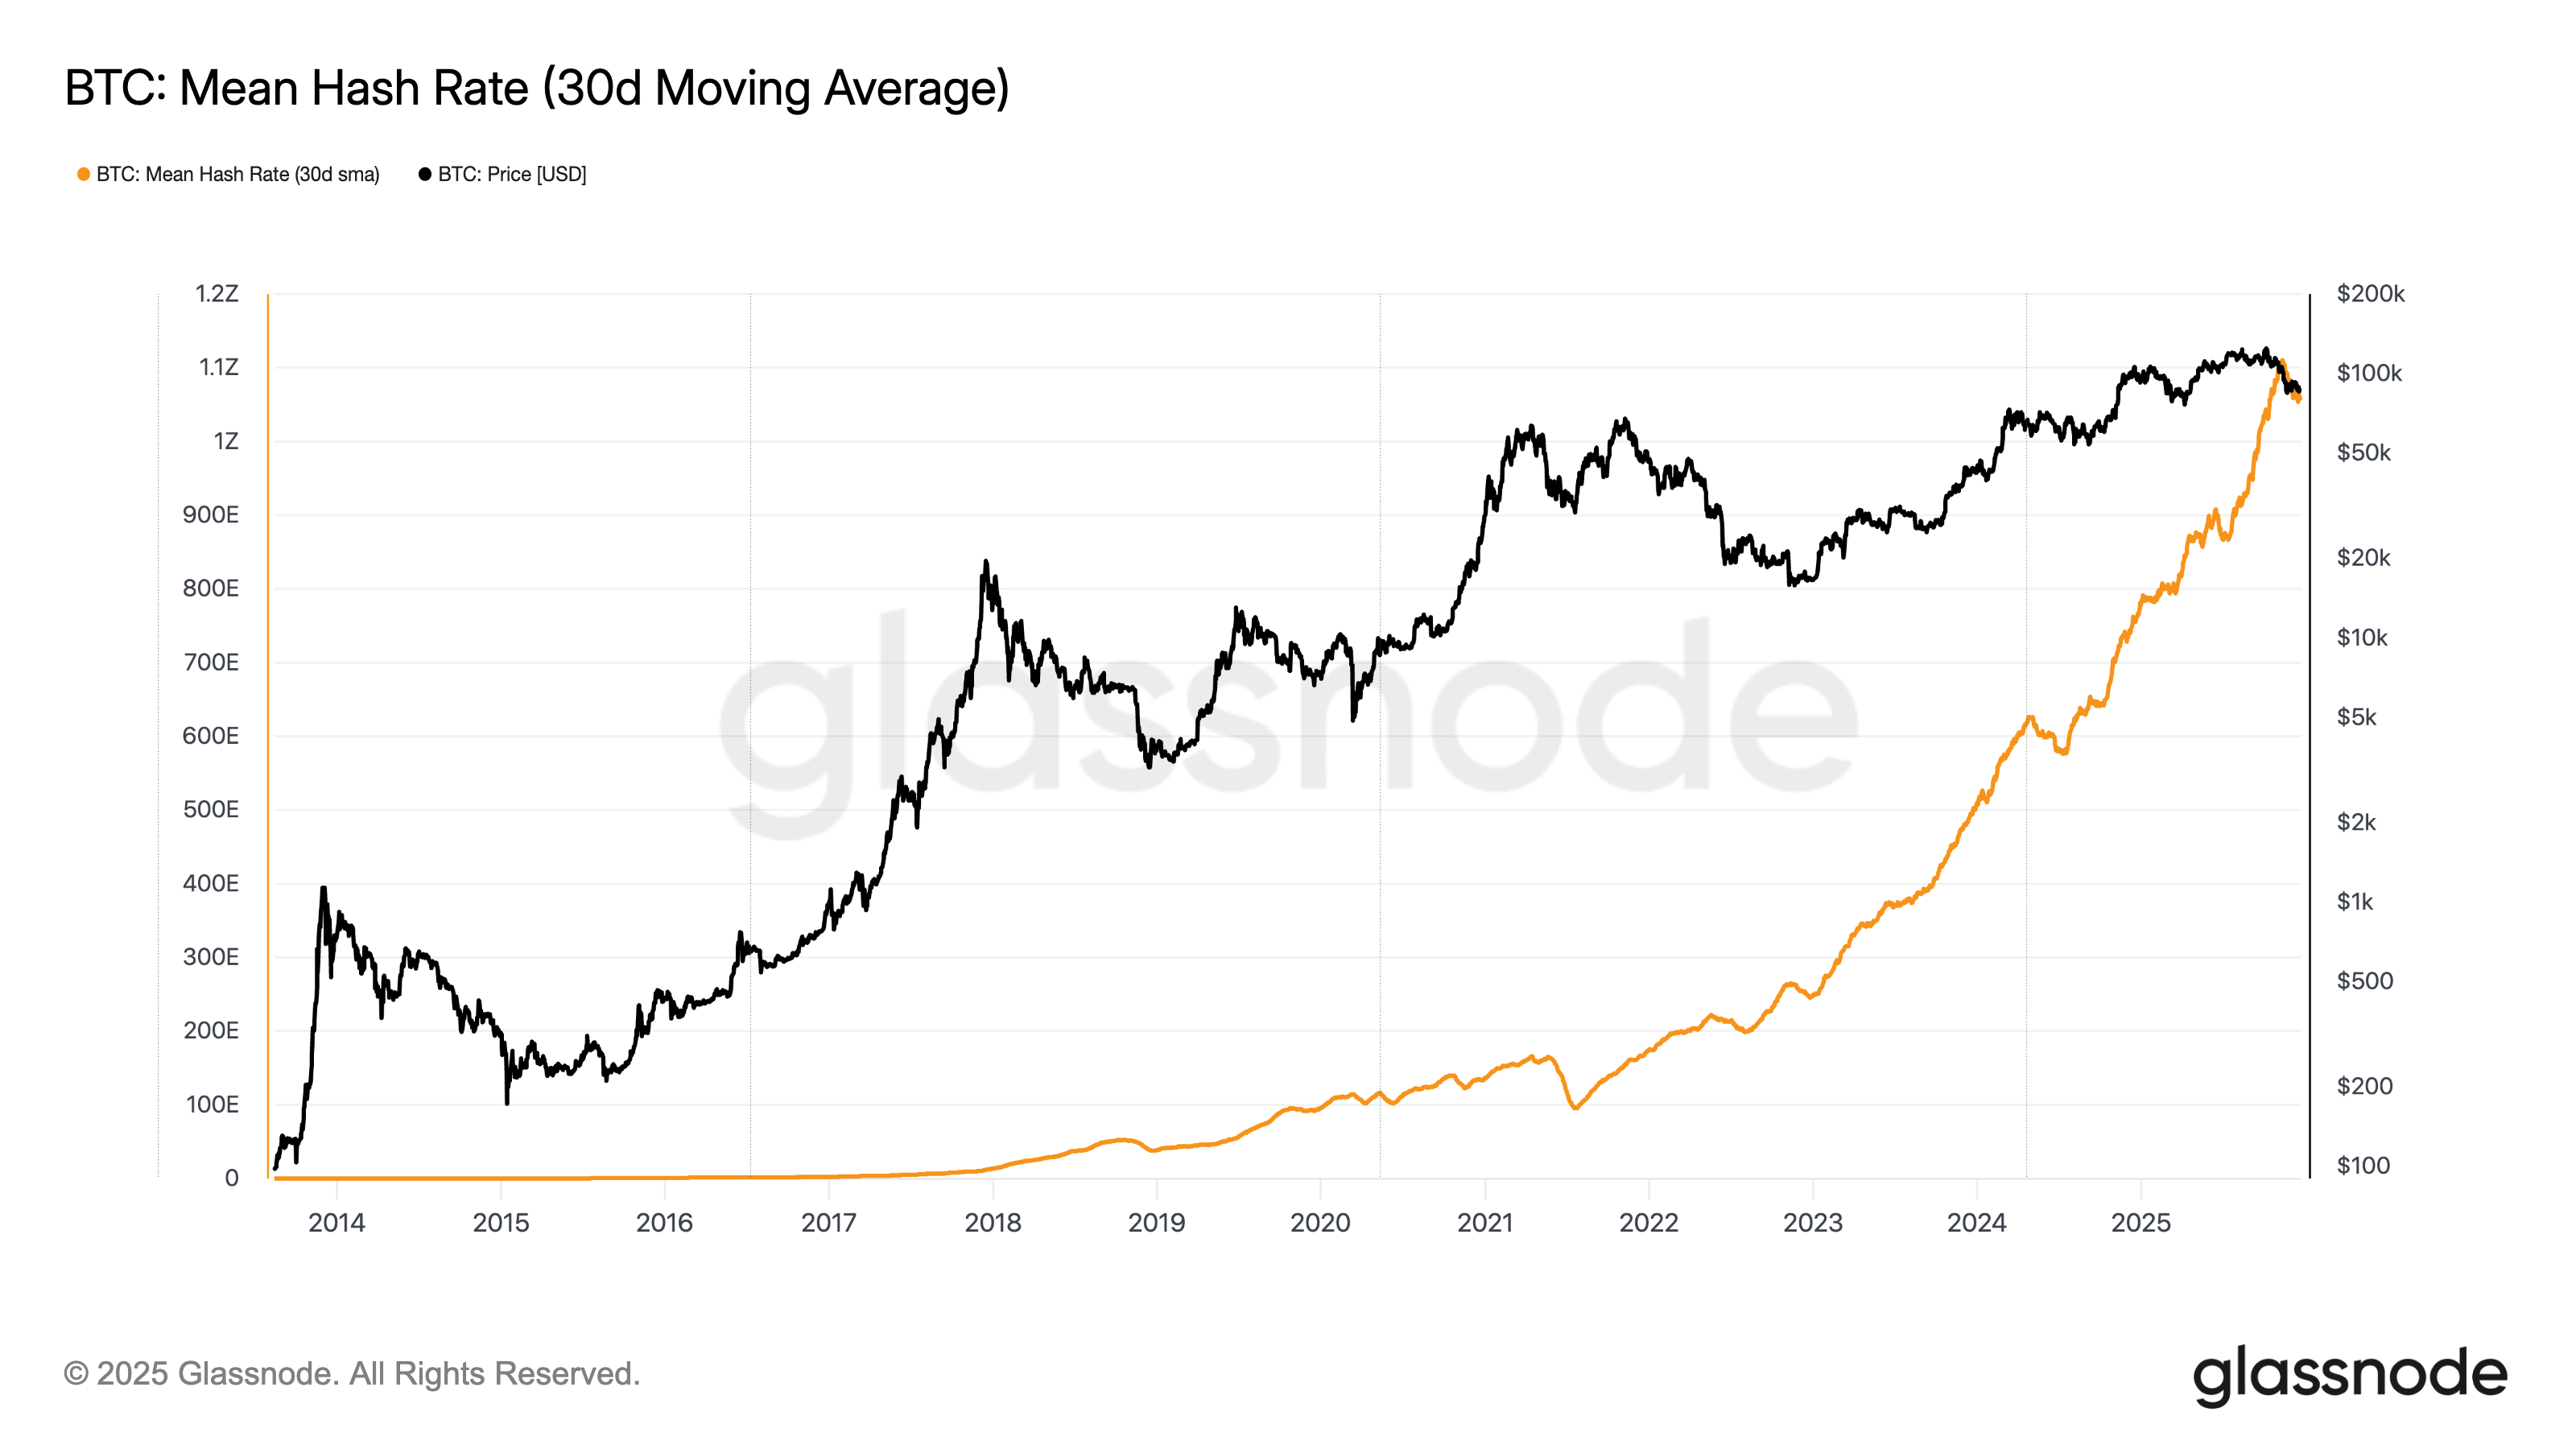
The signal strengthened over longer horizons, with positive 180-day returns 77% of the time and an average gain of 72%.

Related: Bitcoin sharks stack at fastest pace in 13 years, with BTC down 30%

Rising prices could also improve miner profitability and bring sidelined capacity back online.

Bitcoin may rally in 4-6 weeks, one macro indicator shows

Bitcoin may be nearing a bottom as liquidity conditions begin to improve, a factor that has historically led to major BTC reversals.

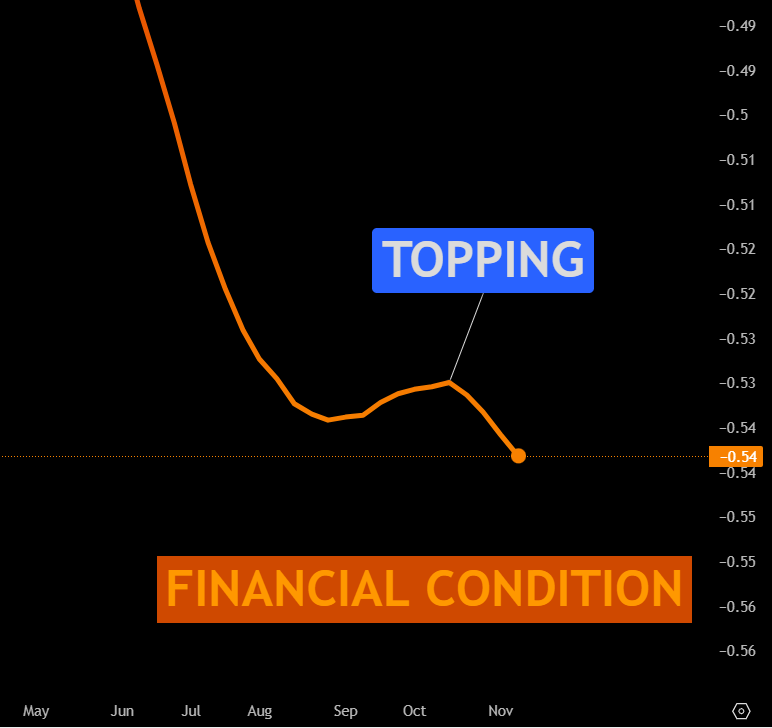
Analyst Miad Kasravi’s backtest of 105 indicators showed the National Financial Conditions Index’s (NFCI) top often leads a Bitcoin rally by four to six weeks.

Chicago Fed National Financial Conditions Index. Source: FRED

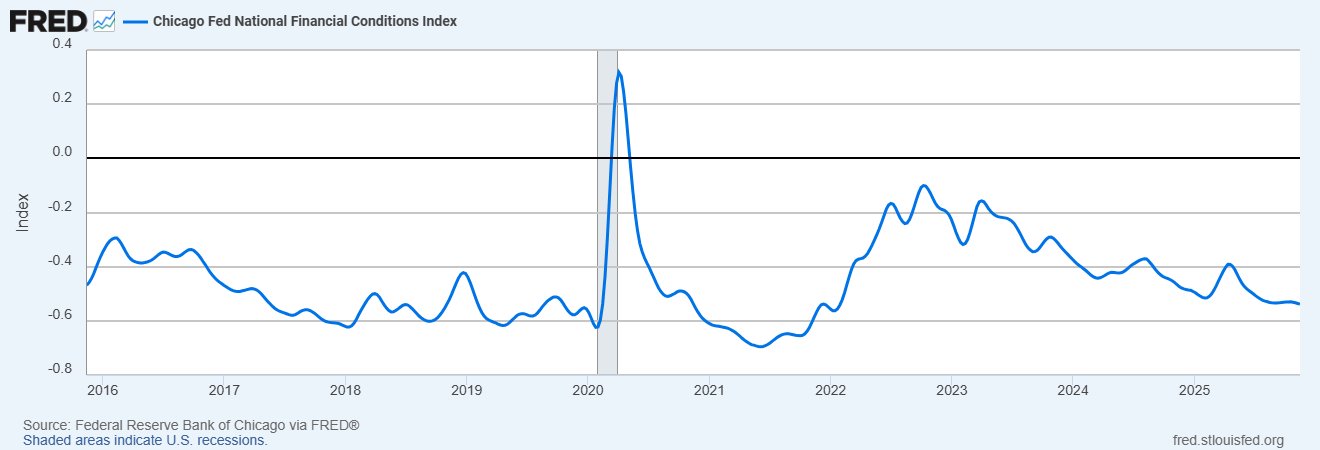
This signal appeared in late 2022 and mid-2024, both ahead of sharp rallies. Historically, each 0.10-point decline has aligned with roughly 15%–20% upside in Bitcoin, with deeper NFCI readings marking prolonged BTC uptrend phases.

NFCI Index vs. Bitcoin price. Source: X

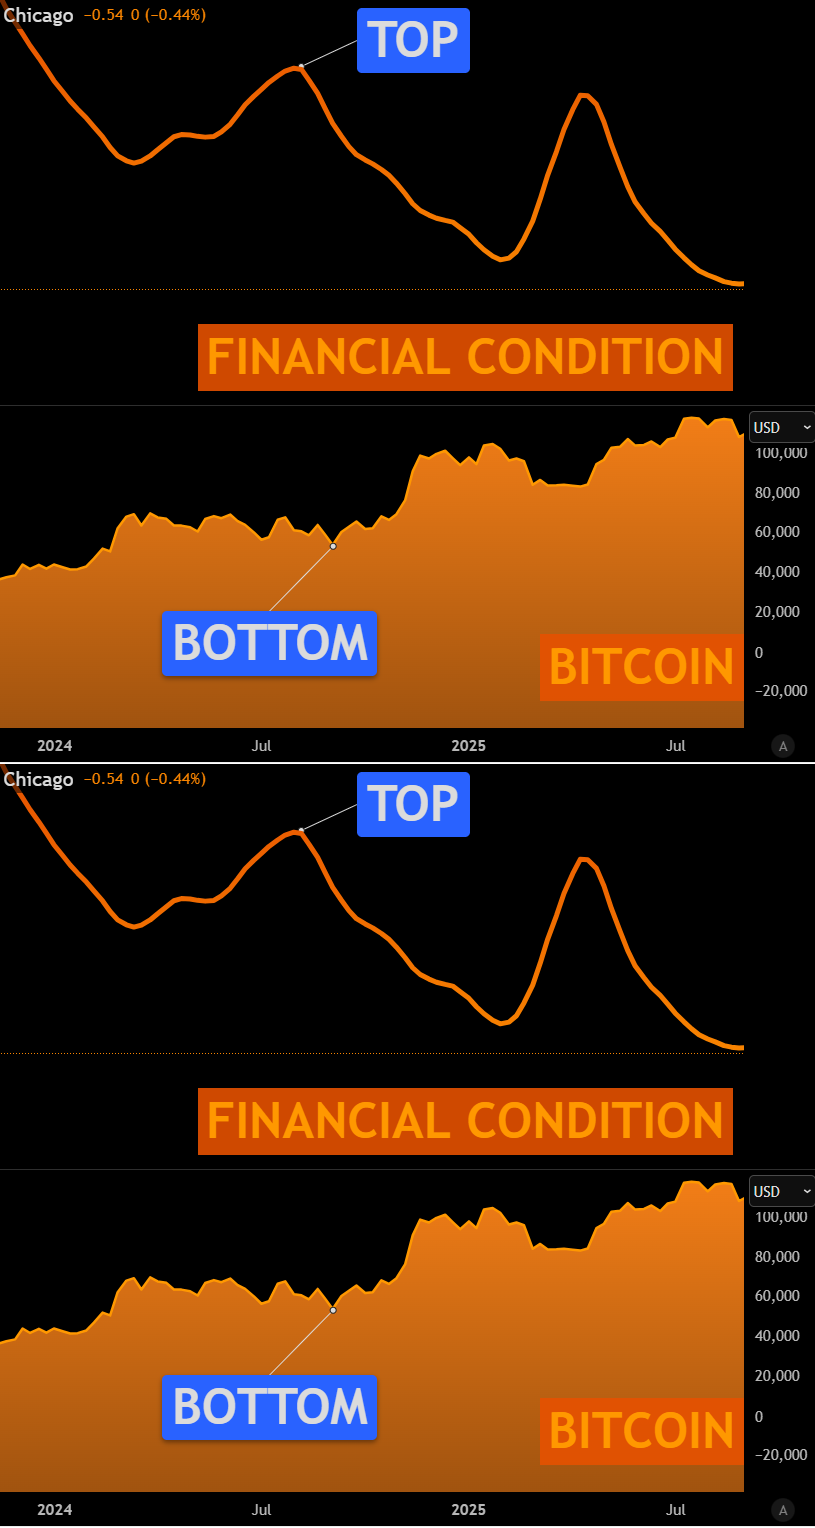
As of December, NFCI sat at -0.52 and was trending lower.

NFCI Index vs. Bitcoin price. Source: X

A potential catalyst is the Federal Reserve’s plan to rotate mortgage-backed securities into Treasury bills, a move Kasravi compared to the 2019 “not-QE” liquidity injection that preceded a 40% Bitcoin rally.

Despite these signals, many market watchers anticipate Bitcoin’s price to decline further, with their price targets ranging from $70,000 to $25,000.

This article does not contain investment advice or recommendations. Every investment and trading move involves risk, and readers should conduct their own research when making a decision. While we strive to provide accurate and timely information, Cointelegraph does not guarantee the accuracy, completeness, or reliability of any information in this article. This article may contain forward-looking statements that are subject to risks and uncertainties. Cointelegraph will not be liable for any loss or damage arising from your reliance on this information.

Related Questions

QWhat are the three key indicators suggesting that Bitcoin may be finding a market bottom?

AThe three key indicators are: 1) Technical momentum indicators showing bullish divergences and oversold rebounds, 2) Miner capitulation signaled by a 4% decline in hash rate, and 3) Improving macro liquidity conditions as measured by the National Financial Conditions Index (NFCI).

QHow has Bitcoin's weekly Stochastic RSI behaved historically near market bottoms?

AHistorically, Bitcoin's weekly Stochastic RSI turning up from oversold levels has appeared near key inflection points before price rebounds, such as in early 2019 (after the $3,200 bottom), March 2020 (COVID crash low near $3,800), and late 2022 (around the $15,500 cycle low).

QWhat is the significance of Bitcoin's hash rate declining by 4% in December?

AThe 4% decline in Bitcoin's hash rate over 30 days is viewed as a 'bullish contrarian signal' indicating miner capitulation. Historically, periods of sustained hash rate compression have preceded stronger Bitcoin returns, with positive 90-day returns occurring 65% of the time after such declines.

QHow does the National Financial Conditions Index (NFCI) relate to Bitcoin's price movements?

AThe NFCI's peaks often lead Bitcoin rallies by 4-6 weeks. Each 0.10-point decline in the NFCI has historically aligned with roughly 15-20% upside in Bitcoin, with deeper NFCI readings marking prolonged BTC uptrend phases. The NFCI was at -0.52 and trending lower as of December.

QWhat historical precedent does the article mention for the Federal Reserve's current plans regarding mortgage-backed securities?

AThe article compares the Federal Reserve's plan to rotate mortgage-backed securities into Treasury bills to the 2019 'not-QE' liquidity injection, which preceded a 40% Bitcoin rally.

Related Reads

a16z: AI's 'Amnesia', Can Continuous Learning Cure It?

The article "a16z: AI's 'Amnesia' – Can Continual Learning Cure It?" explores the limitations of current large language models (LLMs), which, like the protagonist in the film *Memento*, are trapped in a perpetual present—unable to form new memories after training. While methods like in-context learning (ICL), retrieval-augmented generation (RAG), and external scaffolding (e.g., chat history, prompts) provide temporary solutions, they fail to enable true internalization of new knowledge. The authors argue that compression—the core of learning during training—is halted at deployment, preventing models from generalizing, discovering novel solutions (e.g., mathematical proofs), or handling adversarial scenarios. The piece introduces *continual learning* as a critical research direction to address this, categorizing approaches into three paths: 1. **Context**: Scaling external memory via longer context windows, multi-agent systems, and smarter retrieval. 2. **Modules**: Using pluggable adapters or external memory layers for specialization without full retraining. 3. **Weights**: Enabling parameter updates through sparse training, test-time training, meta-learning, distillation, and reinforcement learning from feedback. Challenges include catastrophic forgetting, safety risks, and auditability, but overcoming these could unlock models that learn iteratively from experience. The conclusion emphasizes that while context-based methods are effective, true breakthroughs require models to compress new information into weights post-deployment, moving from mere retrieval to genuine learning.

marsbit2h ago

a16z: AI's 'Amnesia', Can Continuous Learning Cure It?

marsbit2h ago

Can a Hair Dryer Earn $34,000? Deciphering the Reflexivity Paradox in Prediction Markets

An individual manipulated a weather sensor at Paris Charles de Gaulle Airport with a portable heat source, causing a Polymarket weather market to settle at 22°C and earning $34,000. This incident highlights a fundamental issue in prediction markets: when a market aims to reflect reality, it also incentivizes participants to influence that reality. Prediction markets operate on two layers: platform rules (what outcome counts as a win) and data sources (what actually happened). While most focus on rules, the real vulnerability lies in the data source. If reality is recorded through a specific source, influencing that source directly affects market settlement. The article categorizes markets by their vulnerability: 1. **Single-point physical data sources** (e.g., weather stations): Easily manipulated through physical interference. 2. **Insider information markets** (e.g., MrBeast video details): Insiders like team members use non-public information to trade. Kalshi fined a剪辑师 $20,000 for insider trading. 3. **Actor-manipulated markets** (e.g., Andrew Tate’s tweet counts): The subject of the market can control the outcome. Evidence suggests Tate’sociated accounts coordinated to profit. 4. **Individual-action markets** (e.g., WNBA disruptions): A single person can execute an event to profit from their pre-placed bets. Kalshi and Polymarket handle these issues differently. Kalshi enforces strict KYC, publicly penalizes insider trading, and reports to regulators. Polymarket, with its anonymous wallet-based system, has historically been more permissive, arguing that insider information improves market accuracy. However, it cooperated with authorities in the "Van Dyke case," where a user traded on classified government information. The core paradox is reflexivity: prediction markets are designed to discover truth, but their financial incentives can distort reality. The more valuable a prediction becomes, the more likely participants are to influence the event itself. The market ceases to be a mirror of reality and instead shapes it.

marsbit3h ago

Can a Hair Dryer Earn $34,000? Deciphering the Reflexivity Paradox in Prediction Markets

marsbit3h ago

Trading

Spot
Futures

Hot Articles

What is $BITCOIN

DIGITAL GOLD ($BITCOIN): A Comprehensive Analysis Introduction to DIGITAL GOLD ($BITCOIN) DIGITAL GOLD ($BITCOIN) is a blockchain-based project operating on the Solana network, which aims to combine the characteristics of traditional precious metals with the innovation of decentralized technologies. While it shares a name with Bitcoin, often referred to as “digital gold” due to its perception as a store of value, DIGITAL GOLD is a separate token designed to create a unique ecosystem within the Web3 landscape. Its goal is to position itself as a viable alternative digital asset, although specifics regarding its applications and functionalities are still developing. What is DIGITAL GOLD ($BITCOIN)? DIGITAL GOLD ($BITCOIN) is a cryptocurrency token explicitly designed for use on the Solana blockchain. In contrast to Bitcoin, which provides a widely recognized value storage role, this token appears to focus on broader applications and characteristics. Notable aspects include: Blockchain Infrastructure: The token is built on the Solana blockchain, known for its capacity to handle high-speed and low-cost transactions. Supply Dynamics: DIGITAL GOLD has a maximum supply capped at 100 quadrillion tokens (100P $BITCOIN), although details regarding its circulating supply are currently undisclosed. Utility: While precise functionalities are not explicitly outlined, there are indications that the token could be utilized for various applications, potentially involving decentralized applications (dApps) or asset tokenization strategies. Who is the Creator of DIGITAL GOLD ($BITCOIN)? At present, the identity of the creators and development team behind DIGITAL GOLD ($BITCOIN) remains unknown. This situation is typical among many innovative projects within the blockchain space, particularly those aligning with decentralized finance and meme coin phenomena. While such anonymity may foster a community-driven culture, it intensifies concerns about governance and accountability. Who are the Investors of DIGITAL GOLD ($BITCOIN)? The available information indicates that DIGITAL GOLD ($BITCOIN) does not have any known institutional backers or prominent venture capital investments. The project seems to operate on a peer-to-peer model focused on community support and adoption rather than traditional funding routes. Its activity and liquidity are primarily situated on decentralized exchanges (DEXs), such as PumpSwap, rather than established centralized trading platforms, further highlighting its grassroots approach. How DIGITAL GOLD ($BITCOIN) Works The operational mechanics of DIGITAL GOLD ($BITCOIN) can be elaborated on based on its blockchain design and network attributes: Consensus Mechanism: By leveraging Solana’s unique proof-of-history (PoH) combined with a proof-of-stake (PoS) model, the project ensures efficient transaction validation contributing to the network's high performance. Tokenomics: While specific deflationary mechanisms have not been extensively detailed, the vast maximum token supply implies that it may cater to microtransactions or niche use cases that are still to be defined. Interoperability: There exists the potential for integration with Solana’s broader ecosystem, including various decentralized finance (DeFi) platforms. However, the details regarding specific integrations remain unspecified. Timeline of Key Events Here is a timeline that highlights significant milestones concerning DIGITAL GOLD ($BITCOIN): 2023: The initial deployment of the token occurs on the Solana blockchain, marked by its contract address. 2024: DIGITAL GOLD gains visibility as it becomes available for trading on decentralized exchanges like PumpSwap, allowing users to trade it against SOL. 2025: The project witnesses sporadic trading activity and potential interest in community-led engagements, although no noteworthy partnerships or technical advancements have been documented as of yet. Critical Analysis Strengths Scalability: The underlying Solana infrastructure supports high transaction volumes, which could enhance the utility of $BITCOIN in various transaction scenarios. Accessibility: The potential low trading price per token could attract retail investors, facilitating wider participation due to fractional ownership opportunities. Risks Lack of Transparency: The absence of publicly known backers, developers, or an audit process may yield skepticism regarding the project's sustainability and trustworthiness. Market Volatility: The trading activity is heavily reliant on speculative behavior, which can result in significant price volatility and uncertainty for investors. Conclusion DIGITAL GOLD ($BITCOIN) emerges as an intriguing yet ambiguous project within the rapidly evolving Solana ecosystem. While it attempts to leverage the “digital gold” narrative, its departure from Bitcoin's established role as a store of value underscores the need for a clearer differentiation of its intended utility and governance structure. Future acceptance and adoption will likely depend on addressing the current opacity and defining its operational and economic strategies more explicitly. Note: This report encompasses synthesised information available as of October 2023, and developments may have transpired beyond the research period.

363 Total ViewsPublished 2025.05.13Updated 2025.05.13

What is $BITCOIN

Discussions

Welcome to the HTX Community. Here, you can stay informed about the latest platform developments and gain access to professional market insights. Users' opinions on the price of BTC (BTC) are presented below.

活动图片