The Signal That Has Appeared Before Every BTC Bottom Since 2014, It Was Close This Time

marsbitPublished on 2026-07-13Last updated on 2026-07-13

Abstract

A valuation model tracking Bitcoin for 12 years has been updated. The new model shows a current score of 24.3, placing BTC in the historical bottom 20% range. However, analysis reveals that since 2014, every Bitcoin bear market bottom has seen this score drop *below 20* for a sustained period before turning around. The current cycle's low so far was 21.5 on July 1st. The author explains the model was rebuilt to address a flaw in its historical baseline, making it a more accurate "map" of current value. Two interpretations are offered: either the historically definitive washout has not yet occurred, or this cycle's bottom will be shallower, as each cycle has been less volatile than the last. The author's action plan involves automated buying triggered at specific score levels. A purchase was made at the cycle's cheapest reading (21.5), with more capital allocated for a potential drop below 20. The strategy emphasizes following a pre-written plan over emotion. Additional market context is provided: Bitcoin reclaimed its 200-week moving average, the BTC/Gold ratio is at a 3-year low showing capital preference for gold, and Bitcoin dominance remains high at 59%, indicating no "altcoin season." The summary concludes by noting the model's inconvenient implication—the market looks less like a bottom now—and poses a question to readers: at what score would they deploy their final capital?

Author: Jake Pahor

Compilation: Shenchao TechFlow

Shenchao Guide: A valuation model that has tracked Bitcoin's 12-year history has just been rebuilt. The new model shows a current reading of 24.3, in the bottom 20% historical range—but at the true bottom of every previous bear market, this number has fallen below 20. Either this time is different, or the real washout hasn't come yet. For those wanting to buy the dip, it's an uncomfortable but worthwhile signal to watch.

Two weeks ago I told you Bitcoin was in the bottom 3% range of its entire history. Today that score reads 24.3, bottom 20%.

The market hasn't moved 17 points. The model changed. Rather than quietly updating a number and hoping no one checks, I'd rather explain in plain English exactly what happened.

Because here's the thing: if you're using a score to make real-money decisions, you deserve to know when and why it changes. That's the difference between a system and a pitch.

Why the Score Moved But the Market Didn't

Our old model had a flaw we've known about. It compared today's price to Bitcoin's entire history, including the early years when BTC could swing thousands of percent in months. That volatility will never repeat. Because it was baked into the baseline, the score would read low and drift, and could never again reach the top of its own range. Useful, but drifting.

The rebuilt model (v4.1, now live) measures where price sits within a fair value band that projects forward with the asset, instead of being anchored to 2012. Same 0 to 100 scale. Same job. Better ruler. We validated it against 21 hand-labeled cycle tops and bottoms in Bitcoin's history, and it's about 35% more accurate at identifying those points than the old model. I'm not dumping the full methodology in a newsletter, but we've published the plain-English version on the site because a score you can't interrogate is just a feeling with numbers attached.

So what does the new ruler actually say?

This is where it gets interesting, and honestly a bit uncomfortable.

Since 2014, every Bitcoin bear market has ended the same way on this model: the score spends real time below 20 before the turn. The 2015 bottom printed around 7. December 2018 printed around 15. At the November 2022 price low of $15,742, the score read 18, and spent weeks below 20 around that time.
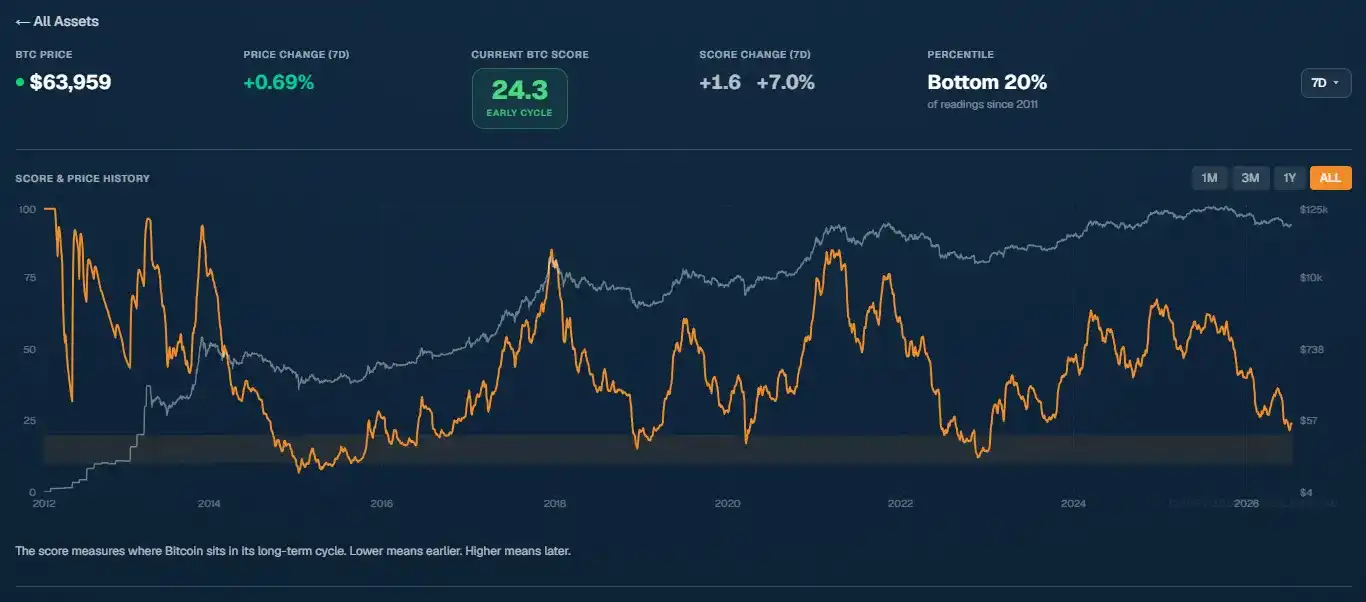
The lowest print of this cycle so far: 21.5, July 1st, with BTC at $58,550.

Close. But not there.

Take from that what you will, but here is my honest take: By the standard of every previous cycle, we have not yet seen the kind of washout that has historically marked the end. That is one possibility. The other possibility is that this cycle stays shallower, just as each prior cycle has been shallower than the last. Our October 2025 top printed a score of 59, well short of the 74+ readings of past manias. A compressed top could mean a compressed bottom. The past doesn't predict the future, and I won't pretend the model is a crystal ball. It's a map of where we are, not a prediction of where we're going.

What I actually did, because a score without a decision is just decoration:

I bought on July 1st. Not because I called a bottom (I didn't know it was a bottom, no one does). But because my plan had a trigger set at that price, and the trigger fired. It felt like a completely ordinary day. The score printed the cheapest reading of the entire cycle, and my phone didn't ring once. That's what real accumulation zones feel like: boring, quiet, slightly nauseating.

I still have a large chunk of capital left. Its deployment schedule is written in my plan, tied to score levels, not to how I feel on a given day. If the score prints below 20, my plan buys more aggressively. If it doesn't and the market turns anyway, my regular DCA already has me positioned. In either case, I don't need to be right. I just need to follow what I wrote when I was calm.

The rebuilt score is live in the app now, along with historical data, so you can check every claim I just made against the charts yourself.

CSH Risk Dashboard
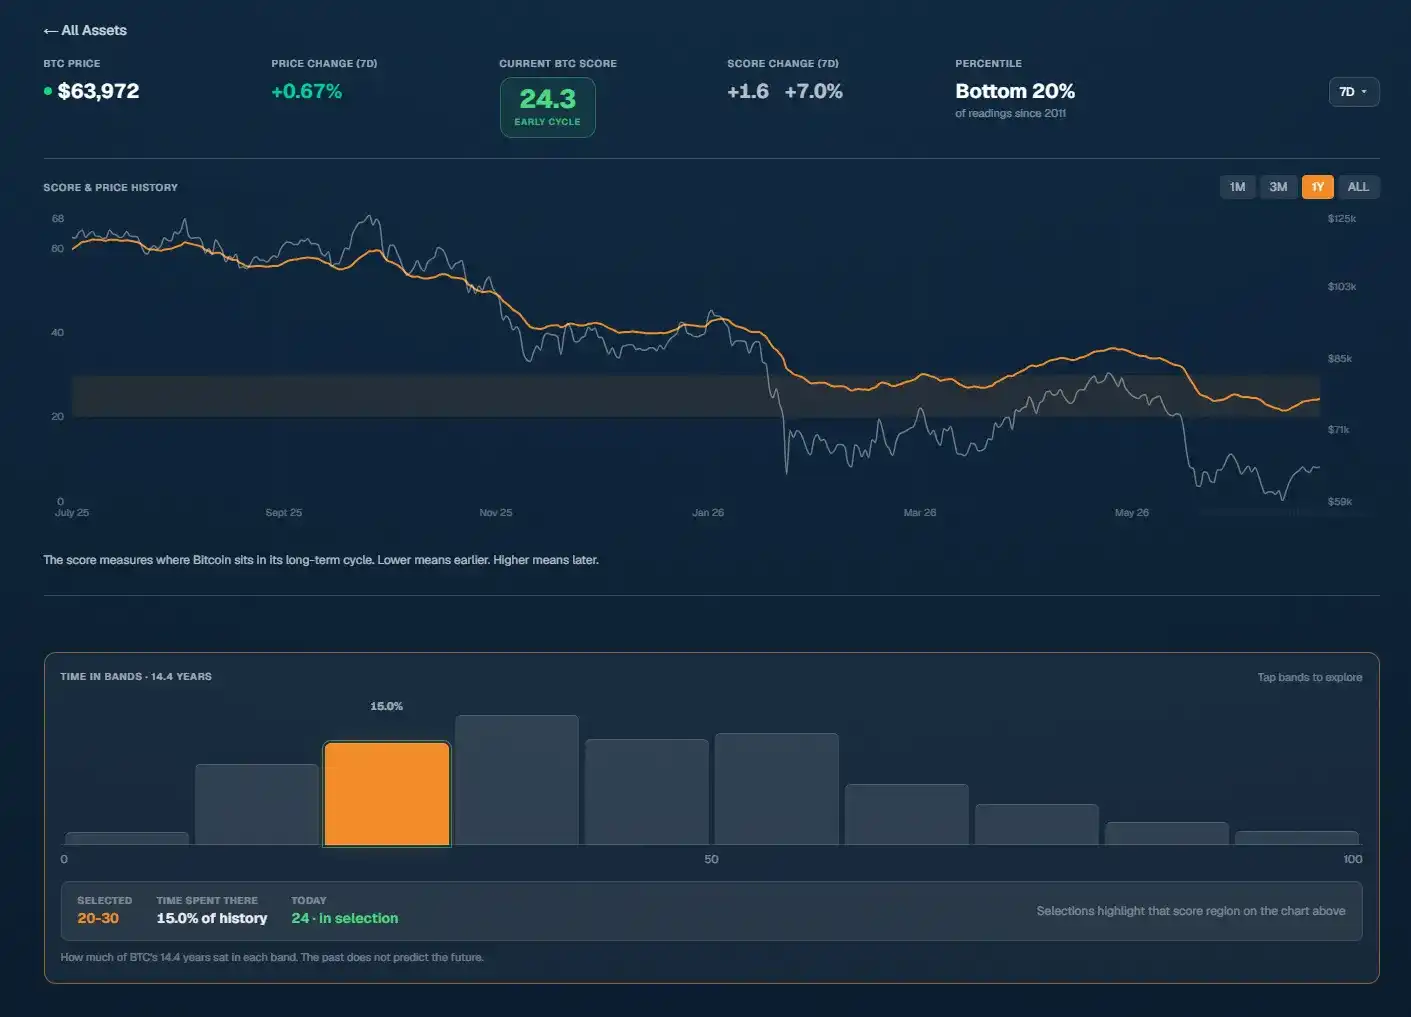
The numbers as of tonight:

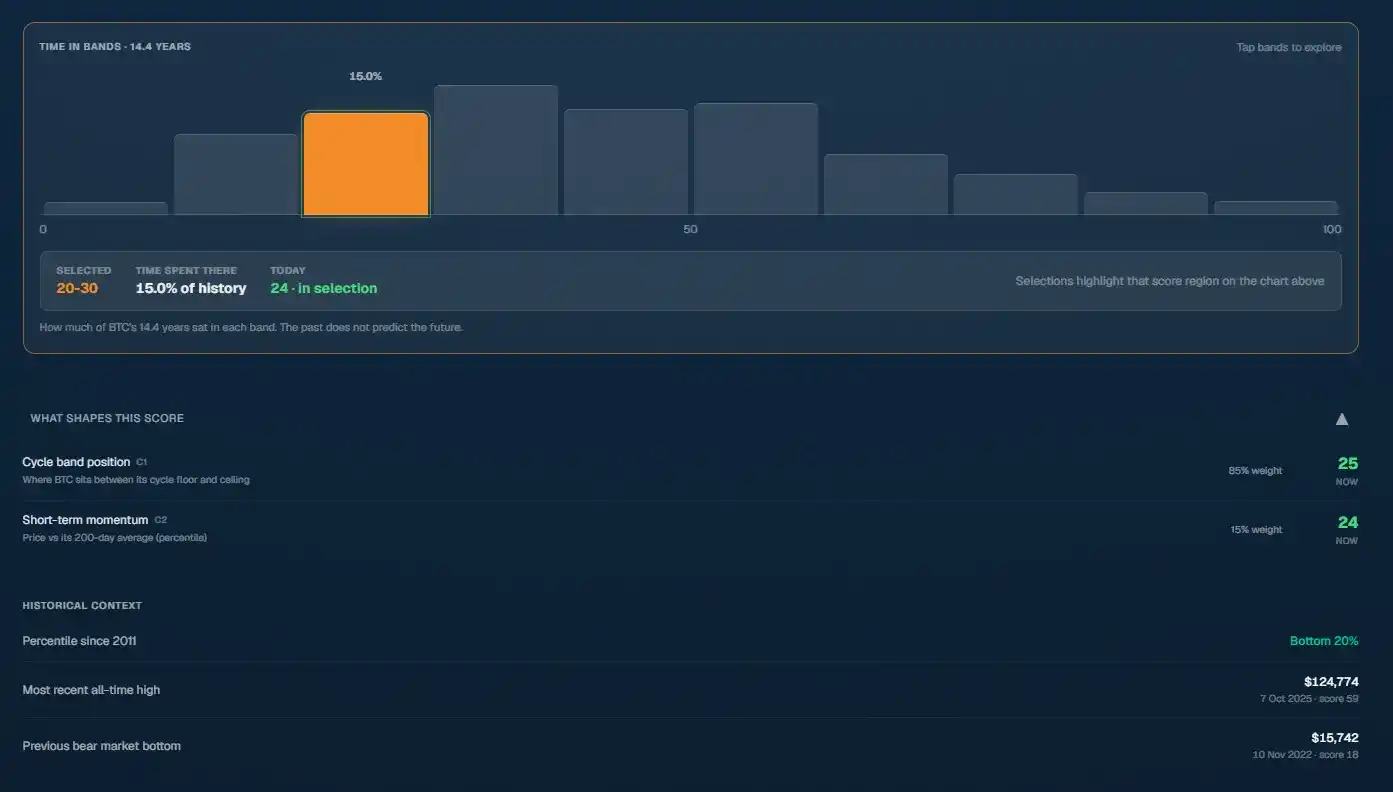
BTC $64,085, up 0.96% this week. The score sits at 24.3, up 1.6 points (7%) over the same period, in the bottom 20% of all readings since 2011. We're in the 20-30 band, where BTC has spent about 15% of its 14.4-year history.

To callback, because the system keeps receipts: The July 1st low at $58,550 printed the cheapest score of this cycle, 21.5. Since then, price is up about 9.5%, and the score has risen with it. None of this changes the plan. The next tier has its trigger, and the trigger hasn't moved.

BTC reclaimed its 200-week moving average this week, around $62.9k, after losing it on July 1st. So what: That line is the life/death line for long-term holders, and the past two bear markets ground below it for months. A quick reclaim is constructive. My plan doesn't trade moving averages, but this aligns with the shift the score's momentum reading captured this week.

One bitcoin now buys about 15.5 ounces of gold, the lowest in nearly three years. Gold has corrected hard, from near-record highs of ~$5,100 in January to around $4,120, but BTC has still lost ground relative to it: This ratio has roughly halved since the October top, when one coin bought nearly 30 ounces. So what: Hard money capital went to gold first this cycle. When the crypto cycle turns, this ratio will snap back fast. My plan doesn't trade this ratio, but there's no clearer picture of how unloved BTC is right now.

Bitcoin dominance at 59%. So what: Altseason isn't even on the radar. The playbook's bear market rule: Altcoins bleed longer and harder. Plan accumulates the index leader first, asks altcoin questions much later in the cycle.

Jake's Workbench: Launch Week

The biggest build week we've ever had. Tom is a machine:

CSH Score v4.1 is live for BTC, with ETH, SOL, and XRP to follow. The website ate a full UI overhaul, charts and mobile included. And we ran a full security audit ahead of something we've been working toward all year: The paid Founding Plan.
To be direct about that last thing: There will be exactly 100 Founding seats, discount priced and permanently locked. That cap is real, not marketing theater, so when it's full, it's full. If you want first look, create a free account, and you'll hear it from me before anyone else. For the price of a coffee or two a month, you get the score, the plan builder, and a dashboard that keeps you honest on the days you don't want to be.

An apology here: If you were using a live plan with triggers on the score this week, the model change moved your readings. I know that's annoying. Short-term pain, long-term sharper tool. Full changelog on the site.

Looking Ahead to Next Week

I'm watching three things, none requiring prediction:

The 200-week MA around $62.9K. We reclaimed it this week after losing it July 1st. Holding above it is the first good sign; losing it again puts lower support back in play.

The path of the score to 20. Every prior bear market printed below it before turning, but not this one yet. If it gets there, my plan buys harder. If it doesn't, DCA already has me positioned. Watch this number with me in the app.

The gold rotation. If the BTC/gold ratio stops declining, that's the earliest signal hard money capital is starting to look our way.

We rebuilt our own model 10 to 12 weeks before asking anyone to pay for it, and the new version makes today's market look less like a bottom, not more. That was the most commercially inconvenient possible result, and we shipped it anyway. Systems over hype was never meant to be a slogan.

My question for you this week, and I'll feature the best answers next issue: What score level would get you to deploy your final third of dry powder? Reply with a number. Mine is already written in my plan.

If this issue was useful, give it a heart. Substack decides who else to show it to based on that.

Talk next Sunday,

Thanks for reading. Share this with someone who would find it valuable.

Trending Cryptos

Related Questions

QAccording to the article, what is the key historical signal for Bitcoin bottoming out since 2014 that has not yet been fully met in the current cycle?

ASince 2014, every Bitcoin bear market has ended with the CSH Score valuation model reading remaining below 20 for a substantial period before the turn. The current cycle's lowest reading so far is 21.5, which is close but has not yet fallen below the 20 threshold.

QWhat major change was made to the CSH Score model (v4.1), and what was its purpose?

AThe model was rebuilt to measure the price's position within a projected fair value range that moves forward with the asset, rather than comparing today's price against Bitcoin's entire volatile history. This corrects a flaw in the old model where early extreme volatility made the score read lower and drift, providing a better and more accurate measuring tool.

QWhat action did the author take on July 1st, and why?

AThe author bought Bitcoin on July 1st when the price was $58,550. This was not an attempt to call the bottom, but because a pre-set trigger in his investment plan was activated at that price level, which coincided with the cycle's cheapest CSH Score reading of 21.5 at that time.

QWhat does the current Bitcoin-to-Gold ratio indicate about market sentiment towards BTC?

AThe current ratio of approximately 15.5 ounces of gold per Bitcoin is near a three-year low, having halved since the peak in October. This indicates that hard-money capital favored gold this cycle and that Bitcoin is currently deeply out of favor relative to gold.

QWhat is the author's stated investment strategy regarding potential further downside and his remaining capital?

AThe author has a significant portion of capital remaining. His deployment schedule is tied to specific CSH Score levels outlined in his plan, not daily emotions. If the score prints below 20, his plan dictates more aggressive buying. If it doesn't fall below 20 but the market turns anyway, his regular Dollar-Cost Averaging (DCA) already gives him exposure. The strategy is to follow the pre-written plan.

Related Reads

Must-Watch Events Next Week|CLARITY Act Could Face Senate Vote; SpaceX, Circle to Report Earnings (8.3-8.9)

**Summary: Key Events and Developments to Watch (August 3-9)** The upcoming week is marked by significant financial disclosures, key legislative deadlines, and notable product updates. **Major Financial Events:** Several companies are scheduled to release their Q2 2026 earnings. American Bitcoin (ABTC) will report on August 3, followed by SpaceX and Hut 8 Mining Corp. on August 4, and Circle on August 5. Notably, a significant portion of SpaceX shares (up to 12% of total shares) will be unlocked on August 6 following their earnings release. **Key Legislative Deadline:** The U.S. Senate faces an August 7 deadline to secure 60 votes for the CLARITY Act, a bipartisan bill aiming to establish a federal regulatory framework for cryptocurrencies. The Senate may hold a full vote on the bill during the week. **Economic Data:** The U.S. July Non-Farm Payrolls report will be released on August 7, providing crucial labor market data. **Technology & Product Updates:** * **Shutdowns:** DeFi portfolio tracker Zapper and wallet app Ctrl Wallet will cease operations on August 3. * **Upgrades:** LayerZero will deprecate its v1 relayers on August 3. XRP Ledger's new version 3.3.0, featuring five new functions, is expected next week. * **AI:** Elon Musk announced that the advanced Grok 4.6 AI model is set for release around August 7. * **Bitcoin:** The BIP-110 forced signaling for a potential Bitcoin network change is scheduled to begin around August 8. **Other Notable Events:** Chinese robotics firm Unitree Tech has set its preliminary price inquiry for its IPO for August 5. South Korean exchange Upbit will delist AQT and AERGO tokens on August 3.

marsbit9m ago

Must-Watch Events Next Week|CLARITY Act Could Face Senate Vote; SpaceX, Circle to Report Earnings (8.3-8.9)

marsbit9m ago

Stocks Are Plummeting More Sharply Than Cryptocurrencies. Where Has the Money Gone?

Stock Markets Plunge Deeper Than Cryptocurrencies: Where Did the Money Go? In late July, Seoul's Kospi index triggered circuit breakers for two consecutive days, plummeting over 40% from its June high. The collapse was led by heavyweight stocks like SK Hynix, whose record profits still disappointed investors, and devastating leveraged ETFs, with one major product losing over 83% of its value. This signaled a global, forced deleveraging targeting the most crowded trades. Interestingly, while stocks exhibited extreme volatility akin to crypto markets, Bitcoin rose nearly 15% in July after a prior steep drop. Analysis shows the money fleeing equities did not flow into Bitcoin. Instead, Bitcoin had already absorbed its sell-off in May-June, when U.S. spot Bitcoin ETFs saw historic outflows. The true safe-haven beneficiary was gold, whose price rose over 20% year-on-year, highlighting a decoupling between Bitcoin and gold as "digital gold." The sell-off was a targeted unwinding of leveraged positions in tech and semiconductors, accelerated by broker-dealer risk management and shifts in the AI narrative, including new competition from Chinese memory chipmakers. The retreat path was clear: from high-valuation tech stocks to cash and U.S. Treasuries, then to gold. For Bitcoin to attract sustained institutional inflows, conditions like eased global liquidity pressure, a "soft-landing" Fed rate cut, and U.S. regulatory clarity via legislation like the stalled CLARITY Act are needed. Currently, Bitcoin is not a safe haven but an already-cleared asset. Its low correlation with tech stocks, however, makes it a potential diversification play for institutional portfolios once the storm passes. The money isn't here yet, but the positioning is underway.

marsbit9m ago

Stocks Are Plummeting More Sharply Than Cryptocurrencies. Where Has the Money Gone?

marsbit9m ago

In Conversation with Ray Dalio: We Are Currently in an AI Bubble, with 1% of My Portfolio in Bitcoin

Ray Dalio, founder of Bridgewater Associates, warns in an interview that the current AI boom shows classic bubble characteristics, which could lead to significant economic downturns as seen in past cycles like 1929 or 2000. He explains that speculative enthusiasm, fueled by debt and overvaluation, often precedes a crash when rising rates or taxation force asset sales, causing widespread losses and recession. Dalio also outlines his "Big Cycle" theory, describing an approximate 80-year pattern where widening wealth gaps, massive government deficits, and shifting geopolitical power (like China's rise) create internal conflict and global instability. He emphasizes that we are in a late-cycle, transitional phase where traditional powers like the US and UK face decline. For personal wealth protection, Dalio advises diversification beyond cash into assets like stocks, bonds, real estate, and particularly gold, which he prefers over Bitcoin. While he holds about 1% of his portfolio in Bitcoin as a non-printable hard asset, he views gold as more secure from technological or governmental threats. Regarding AI's impact, Dalio believes it will disproportionately benefit capital owners, worsening inequality by replacing both physical and cognitive labor. He suggests that human intuition and emotional intelligence, combined with AI, will be key for future workers. On taxation, Dalio argues that wealth taxes are impractical and risk triggering asset sell-offs, reducing productive investment. He points to the UK as a cautionary example of debt, low productivity, and political strife. Geopolitically, Dalio foresees a more regionalized world, with the US showing weakness in prolonged conflicts like with Iran, akin to past imperial declines. The ideal outcome, he suggests, is coexisting powerful blocs (e.g., Americas, China-Asia Pacific) without major war.

marsbit4h ago

In Conversation with Ray Dalio: We Are Currently in an AI Bubble, with 1% of My Portfolio in Bitcoin

marsbit4h ago

Daily 7.2 Trillion KRW: Foreign Capital's Record Net Buying on Friday! Wall Street Says Headwinds for Korean Stock Fund Flows Have Subsided

South Korean stock market sees a dramatic shift in fund flows. On July 31, foreign investors made a record net purchase of approximately KRW 7.2 trillion in KOSPI stocks, marking a fundamental reversal from the persistent large-scale net outflows seen in previous months. This contributed to a significant narrowing of foreign net selling in July to KRW 9.8 trillion, down sharply from KRW 48.4 trillion in June and KRW 44.5 trillion in May. Simultaneously, domestic institutional pressure eased. South Korean pension funds and asset managers turned to a net buying position in July, purchasing KRW 1.0 trillion worth of KOSPI shares, contrasting with net sales in May and June. Market volatility is expected to be dampened by new financial regulations. Effective July 31, the Financial Services Commission tightened access for retail investors to single-stock leveraged ETFs by raising the minimum cash deposit requirement. Trading volumes for these products subsequently dropped to about 50% of their monthly average. Citigroup Research maintains its year-end KOSPI target of 10,000 points. The firm cites several supportive factors: the substantial easing of headwinds from capital outflows, a robust fundamental outlook for the semiconductor sector, historically low market valuations, strong economic fundamentals, and the potential for policy support from financial authorities if needed.

marsbit4h ago

Daily 7.2 Trillion KRW: Foreign Capital's Record Net Buying on Friday! Wall Street Says Headwinds for Korean Stock Fund Flows Have Subsided

marsbit4h ago

Trading

Spot

Hot Articles

What is $BITCOIN

DIGITAL GOLD ($BITCOIN): A Comprehensive Analysis Introduction to DIGITAL GOLD ($BITCOIN) DIGITAL GOLD ($BITCOIN) is a blockchain-based project operating on the Solana network, which aims to combine the characteristics of traditional precious metals with the innovation of decentralized technologies. While it shares a name with Bitcoin, often referred to as “digital gold” due to its perception as a store of value, DIGITAL GOLD is a separate token designed to create a unique ecosystem within the Web3 landscape. Its goal is to position itself as a viable alternative digital asset, although specifics regarding its applications and functionalities are still developing. What is DIGITAL GOLD ($BITCOIN)? DIGITAL GOLD ($BITCOIN) is a cryptocurrency token explicitly designed for use on the Solana blockchain. In contrast to Bitcoin, which provides a widely recognized value storage role, this token appears to focus on broader applications and characteristics. Notable aspects include: Blockchain Infrastructure: The token is built on the Solana blockchain, known for its capacity to handle high-speed and low-cost transactions. Supply Dynamics: DIGITAL GOLD has a maximum supply capped at 100 quadrillion tokens (100P $BITCOIN), although details regarding its circulating supply are currently undisclosed. Utility: While precise functionalities are not explicitly outlined, there are indications that the token could be utilized for various applications, potentially involving decentralized applications (dApps) or asset tokenization strategies. Who is the Creator of DIGITAL GOLD ($BITCOIN)? At present, the identity of the creators and development team behind DIGITAL GOLD ($BITCOIN) remains unknown. This situation is typical among many innovative projects within the blockchain space, particularly those aligning with decentralized finance and meme coin phenomena. While such anonymity may foster a community-driven culture, it intensifies concerns about governance and accountability. Who are the Investors of DIGITAL GOLD ($BITCOIN)? The available information indicates that DIGITAL GOLD ($BITCOIN) does not have any known institutional backers or prominent venture capital investments. The project seems to operate on a peer-to-peer model focused on community support and adoption rather than traditional funding routes. Its activity and liquidity are primarily situated on decentralized exchanges (DEXs), such as PumpSwap, rather than established centralized trading platforms, further highlighting its grassroots approach. How DIGITAL GOLD ($BITCOIN) Works The operational mechanics of DIGITAL GOLD ($BITCOIN) can be elaborated on based on its blockchain design and network attributes: Consensus Mechanism: By leveraging Solana’s unique proof-of-history (PoH) combined with a proof-of-stake (PoS) model, the project ensures efficient transaction validation contributing to the network's high performance. Tokenomics: While specific deflationary mechanisms have not been extensively detailed, the vast maximum token supply implies that it may cater to microtransactions or niche use cases that are still to be defined. Interoperability: There exists the potential for integration with Solana’s broader ecosystem, including various decentralized finance (DeFi) platforms. However, the details regarding specific integrations remain unspecified. Timeline of Key Events Here is a timeline that highlights significant milestones concerning DIGITAL GOLD ($BITCOIN): 2023: The initial deployment of the token occurs on the Solana blockchain, marked by its contract address. 2024: DIGITAL GOLD gains visibility as it becomes available for trading on decentralized exchanges like PumpSwap, allowing users to trade it against SOL. 2025: The project witnesses sporadic trading activity and potential interest in community-led engagements, although no noteworthy partnerships or technical advancements have been documented as of yet. Critical Analysis Strengths Scalability: The underlying Solana infrastructure supports high transaction volumes, which could enhance the utility of $BITCOIN in various transaction scenarios. Accessibility: The potential low trading price per token could attract retail investors, facilitating wider participation due to fractional ownership opportunities. Risks Lack of Transparency: The absence of publicly known backers, developers, or an audit process may yield skepticism regarding the project's sustainability and trustworthiness. Market Volatility: The trading activity is heavily reliant on speculative behavior, which can result in significant price volatility and uncertainty for investors. Conclusion DIGITAL GOLD ($BITCOIN) emerges as an intriguing yet ambiguous project within the rapidly evolving Solana ecosystem. While it attempts to leverage the “digital gold” narrative, its departure from Bitcoin's established role as a store of value underscores the need for a clearer differentiation of its intended utility and governance structure. Future acceptance and adoption will likely depend on addressing the current opacity and defining its operational and economic strategies more explicitly. Note: This report encompasses synthesised information available as of October 2023, and developments may have transpired beyond the research period.

1.4k Total ViewsPublished 2025.05.13Updated 2025.05.13

What is $BITCOIN

Discussions

Welcome to the HTX Community. Here, you can stay informed about the latest platform developments and gain access to professional market insights. Users' opinions on the price of BTC (BTC) are presented below.

活动图片















