Stellar (XLM) price prediction – Here’s why another 14% hike may be next

ambcryptoPublished on 2026-03-26Last updated on 2026-03-26

Abstract

Stellar (XLM) surged over 9% in 24 hours, outperforming major cryptocurrencies like Bitcoin and Ethereum, with its trading volume jumping 49% to $217 million. This indicates strong market interest. XLM broke the key $0.18 resistance level, a point it had struggled to sustain since February 2026. A daily close above $0.18 could trigger a further 14% rally toward $0.21, but failure may lead to a decline. The RSI at 61.01 suggests it's nearing overbought territory. Derivatives data shows bullish sentiment, with open interest up 35.97% to $120.55 million and significant long positions, indicating growing bullish conviction and whale activity.

Stellar (XLM) surged by over 9% and emerged as among the top gainers after the wider crypto market recovered over the last 24 hours. This price jump has not only helped it outperform major assets like Bitcoin (BTC), Ethereum (ETH), and Solana (SOL), but it has also opened the door for further upside potential in XLM.

At the time of writing, XLM was trading at $0.1802. Not only has the price increased, but strong market participation has also been seen, as reflected by XLM’s trading volume. It surged by over 49% to $217 million over the same period.

This hike in volume might reinforce XLM’s latest upside since it suggested that investors and traders may be interested in the prevailing trend. It is in this context that recently, a popular crypto expert, shared a post on X stating – “XLM has reached its first sell wall.” As expected, this post has raised questions about the crypto’s recent gains.
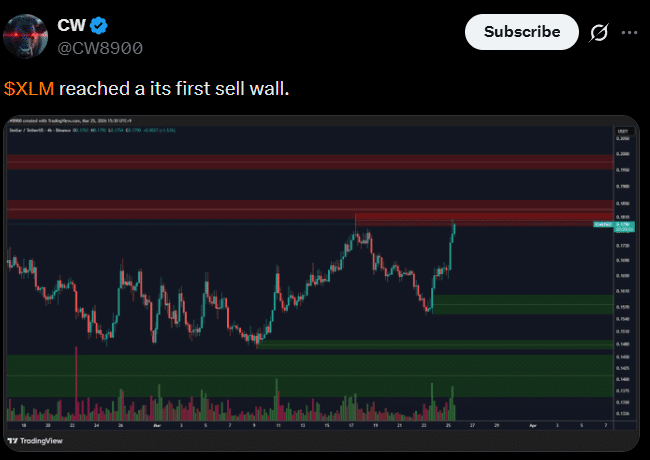
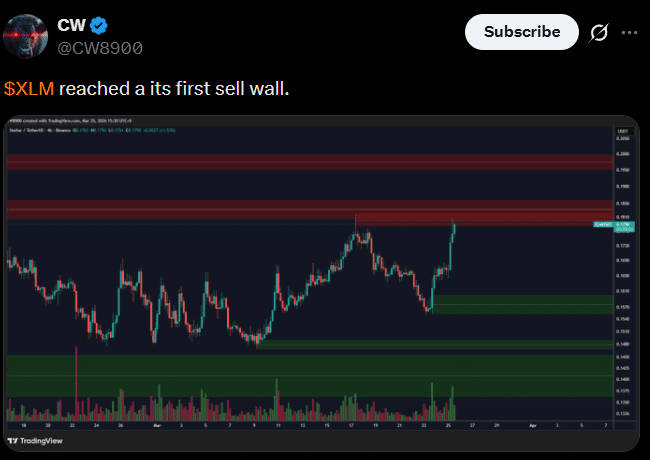
Source: X/CW8900

XLM price action and key levels to watch

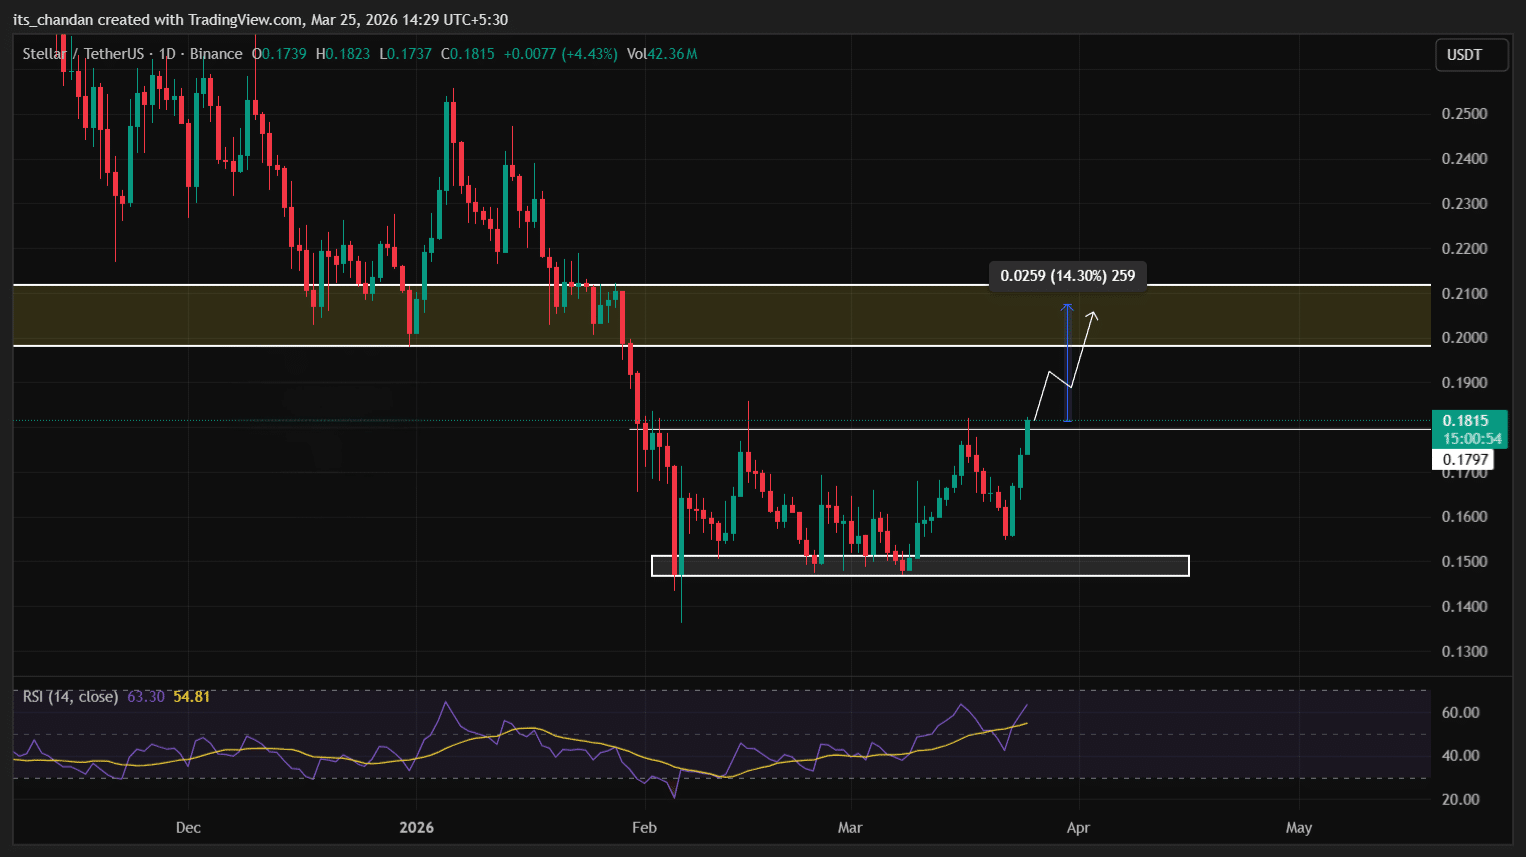
On the daily chart, XLM appeared to be bullish as it broke out of the key resistance level of $0.18 – A level that had been holding firm since 1 February 2026. In the past, the crypto has previously attempted to breach this level. However, it failed to sustain the move, resulting in sharp declines across the board.
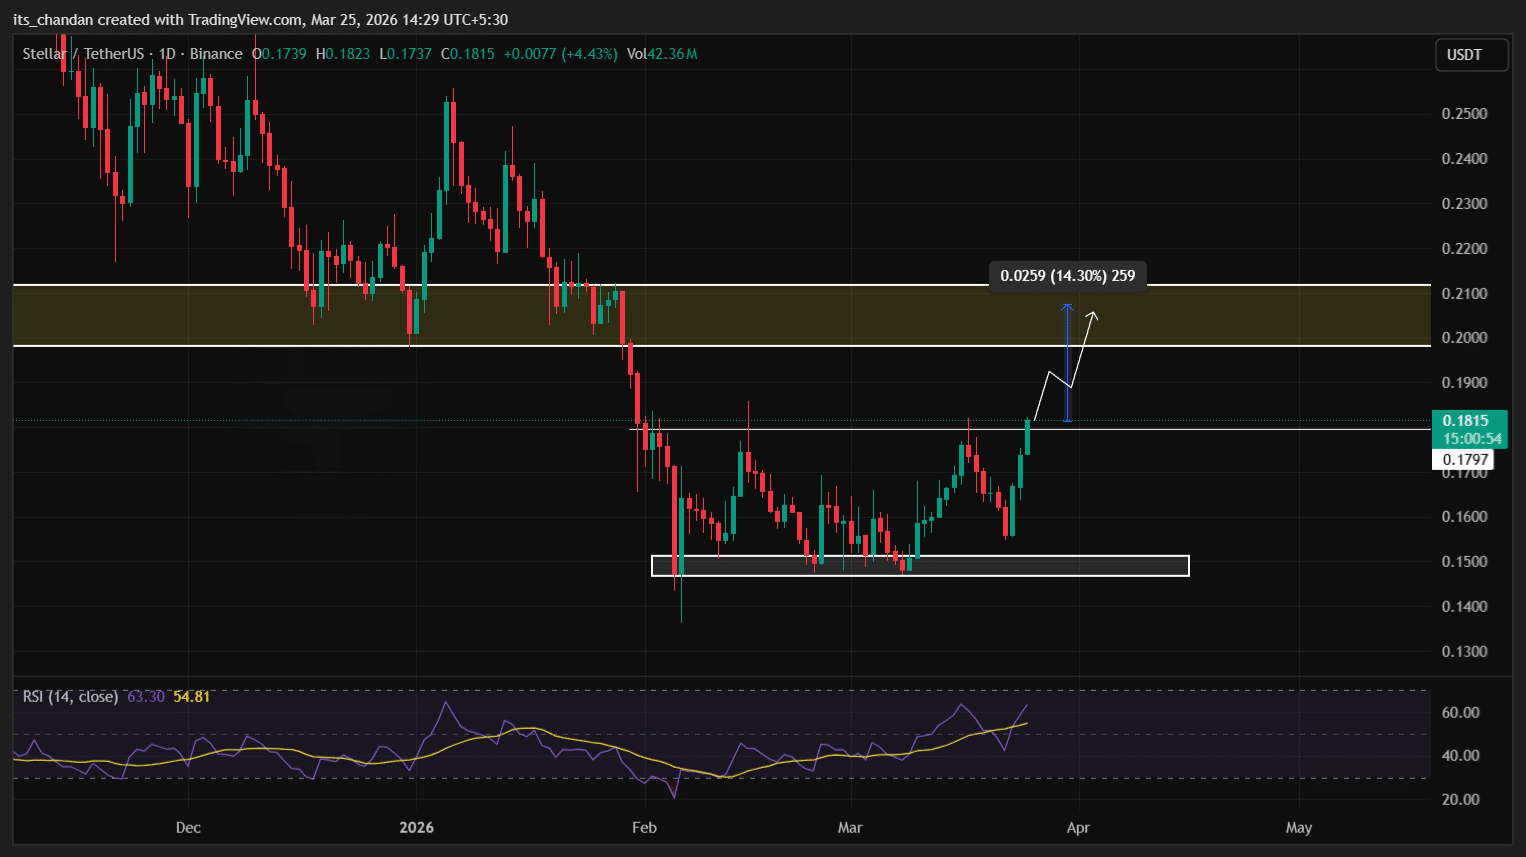
Source: TradingView

The altcoin’s press time price action suggested that XLM’s breakout can only be confirmed if it closes a daily candle above the $0.18-level. If this happens, the asset could see a price uptick of 14% and may reach the $0.21 level in the coming days. However, if it fails to close a daily candle above this key level, history may repeat itself, and a downside move could occur.

Meanwhile, the technical indicator Relative Strength Index (RSI) stood at 61.01, indicating that XLM may be approaching the overbought zone.

Are derivative tools turning bullish?

Finally, despite the price being at a make-or-break level, intraday traders seemed to be placing bullish bets.

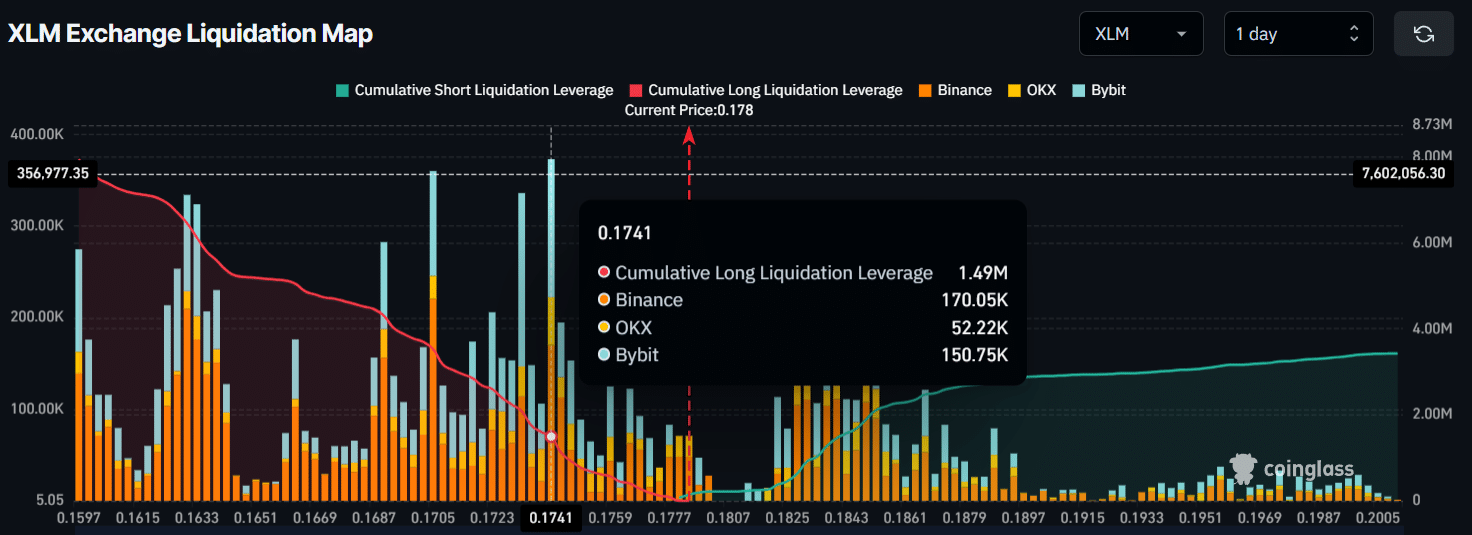
Data showed that $0.1741 and $0.1831 were two major liquidation levels on either side, where traders built $1.49 million worth of long-leveraged positions and $917.85K worth of short-leveraged positions. These bets hinted at the dominance of XLM bulls in the face of bears possibly losing momentum.
Source: Coinglass

The data further showed that traders have been increasingly taking long positions, with XLM’s Open Interest (OI) surging by 35.97% in 24 hours to $120.55 million. This alluded to a significant buildup of leveraged long positions and growing bullish conviction.

Also, CryptoQuant revealed that the average order size in the spot market has been trending upwards over the past few days – A sign of consistent participation from whales and large investors.


Final Thoughts

  • Stellar (XLM) jumped by 9.25% in 24 hours, outperforming major assets like BTC, ETH, and SOL.
  • Price action at a make-or-break level, and a daily candle close above $0.18 could trigger a further 14% price rally.


Trending Cryptos

Related Questions

QWhat was the percentage increase in Stellar (XLM) price over the last 24 hours mentioned in the article?

AStellar (XLM) surged by over 9% in the last 24 hours.

QWhat is the key resistance level that XLM needs to close a daily candle above to confirm a breakout?

AThe key resistance level is $0.18.

QAccording to the article, what potential price target could XLM reach if it successfully breaks above the $0.18 level?

AXLM could see a price uptick of 14% and may reach the $0.21 level.

QWhat does the RSI value of 61.01 indicate about XLM's market condition?

AAn RSI of 61.01 indicates that XLM may be approaching the overbought zone.

QHow much did XLM's Open Interest (OI) increase in 24 hours, and what does this suggest?

AXLM's Open Interest surged by 35.97% to $120.55 million, indicating a significant buildup of leveraged long positions and growing bullish conviction.

Related Reads

Will the Fed Definitely Raise Interest Rates in September? How Will Crypto and U.S. Stocks Withstand the Pressure?

The market's expectation for a September Fed rate hike surged dramatically in early August, jumping from under 50% to over 80% within a week. This shift followed a contentious July FOMC meeting, where a 9-3 vote to hold rates revealed growing dissent from hawkish members advocating for an immediate hike to combat persistent inflation. The primary catalyst for this repricing is rising oil prices, driven by renewed geopolitical tensions around the Strait of Hormuz, which threaten global supply. Energy costs directly influence inflation metrics, making the upcoming July CPI report (due August 12th) a critical data point. If it shows inflation reaccelerating, the probability of a September hike will solidify. For Bitcoin and crypto assets, this is typically bearish news. Bitcoin continues to behave as a high-beta, liquidity-sensitive risk asset. A rate hike raises the opportunity cost of holding non-yielding assets and could drive capital toward money markets, pressuring crypto prices in the short term. However, historical patterns suggest that if a hike is perceived as the end of a tightening cycle rather than the start, any negative price impact may be brief. U.S. stocks, particularly crypto-linked equities like Coinbase and growth-oriented tech stocks, are also vulnerable. Higher rates increase discount rates in valuation models, putting pressure on high-multiple companies. This coincides with a pivotal tech earnings season where investor focus has shifted from massive AI capital expenditure to tangible revenue and cash flow generation. Companies with negative cash flow and weak growth narratives could face heightened volatility if borrowing costs rise in September. In summary, a September Fed hike has evolved into a mainstream market scenario. Key factors to watch are oil prices, the July CPI report, and Fed communications, which will determine the final decision and its impact on volatile crypto and equity markets.

marsbit4m ago

Will the Fed Definitely Raise Interest Rates in September? How Will Crypto and U.S. Stocks Withstand the Pressure?

marsbit4m ago

A 'Overlooked' Market Event: Joint US-Japan-South Korea Intervention, Rare US Treasury Involvement, and Bessent's Quiet 'Market Rescue'?

Summary: The United States, Japan, and South Korea executed their largest coordinated foreign exchange intervention in nearly 30 years. The action targeted depreciation pressure on the Japanese yen and South Korean won. This move is seen as a significant effort by the US to stabilize the financial markets of its key allies and prevent the spillover of risks. Key details: * Japan reportedly intervened on July 30 using approximately 8.45 trillion yen (about $52.8 billion). South Korean authorities also intervened that day, selling dollars to support the won. * Notably, the US Treasury Department intervened directly in yen markets for the first time in roughly 30 years. The New York Fed, reportedly acting on behalf of the Treasury, sold euros to buy yen via Goldman Sachs and Morgan Stanley on July 31. Analysts view the use of the euro-yen pair as a way to alleviate yen pressure without adding selling pressure to the US dollar. * Prior to the action, the New York Fed conducted "rate checks" on both USD/JPY and EUR/JPY, a newer signaling tool that falls between verbal and physical intervention. The intervention is interpreted as going beyond traditional currency stabilization. Analysts, such as Michael Hartnett of Bank of America, suggest it resembles a "Price Keeping Operation" for the AI era. The core US objectives are perceived to be: 1. Preventing rapid yen depreciation from triggering a sharp rise in Japanese government bond yields. 2. Containing financial stress from spreading across Asian markets like South Korea and Japan. 3. Reducing the risk of disorderly capital flows impacting the US bond market. This coordinated action underscores the importance of Japan and South Korea as critical partners in the US semiconductor and AI supply chain. Stabilizing their financial markets is seen as vital to mitigating risks to the broader tech industry and the US market itself. The intervention coincides with market pressures, including the KOSDAQ index hitting a low since October 2022. While seen as a move to control volatility, some analysts caution it may not fundamentally reverse existing market trends.

marsbit7m ago

A 'Overlooked' Market Event: Joint US-Japan-South Korea Intervention, Rare US Treasury Involvement, and Bessent's Quiet 'Market Rescue'?

marsbit7m ago

Will the Federal Reserve Definitely Raise Interest Rates in September? How Will Cryptocurrencies and US Stocks Bear the Pressure?

In early August 2024, market expectations for a September Federal Reserve rate hike surged dramatically, from below 50% to over 80%, driven by renewed inflation concerns. This shift followed a contentious July FOMC meeting where a 9-3 vote to hold rates revealed a growing hawkish faction advocating for an immediate hike, citing prolonged above-target inflation. The key catalyst is escalating conflict near the Strait of Hormuz, which has pushed oil prices up approximately 20% in July, threatening to reignite inflation. The next critical data point is the July CPI report on August 12th; a hot reading could solidify hike expectations. For crypto assets, particularly Bitcoin, this represents near-term pressure. Bitcoin continues to exhibit high-beta, risk-on characteristics, making it sensitive to tightening liquidity and higher opportunity costs. However, historical precedent suggests that if a hike is perceived as the cycle's end rather than its start, the negative impact may be brief, with markets quickly pivoting to anticipate future rate cuts. U.S. stocks, especially crypto-linked equities like Coinbase and high-valuation tech stocks, face amplified volatility. Higher rates increase discount rates in valuation models, pressuring growth stocks. This coincides with a pivotal tech earnings season where investor focus has shifted from massive AI capital expenditures to demonstrable revenue and cash flow generation. Companies with negative cash flows and weak growth narratives could see severe pressure if a September hike materializes, as financing costs would rise. Key indicators to watch include oil prices, upcoming inflation data, and Fed commentary at events like the Jackson Hole symposium.

Odaily星球日报7m ago

Will the Federal Reserve Definitely Raise Interest Rates in September? How Will Cryptocurrencies and US Stocks Bear the Pressure?

Odaily星球日报7m ago

Trading

Spot

Hot Articles

How to Buy XLM

Welcome to HTX.com! We've made purchasing Stellar (XLM) simple and convenient. Follow our step-by-step guide to embark on your crypto journey.Step 1: Create Your HTX AccountUse your email or phone number to sign up for a free account on HTX. Experience a hassle-free registration journey and unlock all features.Get My AccountStep 2: Go to Buy Crypto and Choose Your Payment MethodCredit/Debit Card: Use your Visa or Mastercard to buy Stellar (XLM) instantly.Balance: Use funds from your HTX account balance to trade seamlessly.Third Parties: We've added popular payment methods such as Google Pay and Apple Pay to enhance convenience.P2P: Trade directly with other users on HTX.Over-the-Counter (OTC): We offer tailor-made services and competitive exchange rates for traders.Step 3: Store Your Stellar (XLM)After purchasing your Stellar (XLM), store it in your HTX account. Alternatively, you can send it elsewhere via blockchain transfer or use it to trade other cryptocurrencies.Step 4: Trade Stellar (XLM)Easily trade Stellar (XLM) on HTX's spot market. Simply access your account, select your trading pair, execute your trades, and monitor in real-time. We offer a user-friendly experience for both beginners and seasoned traders.

5.1k Total ViewsPublished 2024.03.29Updated 2026.06.02

How to Buy XLM

Discussions

Welcome to the HTX Community. Here, you can stay informed about the latest platform developments and gain access to professional market insights. Users' opinions on the price of XLM (XLM) are presented below.

活动图片