Solana Trades at $83 Amid Extreme Fear Index

TheNewsCryptoPublished on 2026-02-20Last updated on 2026-02-20

Abstract

Solana is currently trading at $83.70, marking a 2.85% increase in the past 24 hours. Despite recent weekly gains of 4.7%, the token has experienced a significant 34% drop over the last month. The overall market cap stands at $47.53 billion, with a 24-hour trading volume of $3.23 billion. While major cryptocurrencies, excluding Ethereum and XRP, saw upward movement, the crypto fear and greed index remains at an "extreme fear" level of 12, indicating widespread investor selling. Technical analysis presents a mixed outlook: oscillators suggest a buy, but moving averages strongly indicate a sell. Key EMAs are all in sell territory. An analyst warns that if Solana fails to break the $85 resistance, it could fall to the $50-$30 range. Conversely, long-term predictions are highly bullish, suggesting a potential rally to $10,000, with an intermediate target of $9,270.

Solana, the 7th latest cryptocurrency by market cap, is now trading at $83.70, being 2.85% higher in the past 24 hours. The token is around 4.7% up in the last week, whereas it is 34% down in the last month.

With this, the overall market capitalisation stood at $47.53 billion, and the 24-hour trading volume also faced a 6.18% gain to reach $3.23 billion.

Major cryptocurrencies except Ethereum and XRP also witnessed an uptick in the past 24 hours. Despite this movement in the upward direction, the crypto fear and greed index remains at 12, representing the extreme fear state, indicating that most of the investors are still selling their assets rapidly.

Solana’s 24-hour high remains at $84.64, and on the other hand, the low slips to $79.75. The token is still 71.44% lower than its all-time high of $294.33, recorded a year ago on January 19, 2025. Also, it gained an astonishing 16538.53% from its all-time low of $0.50 recorded on May 12, 2020, and has never witnessed such a low price in the past six years.

24-Hour Technicals
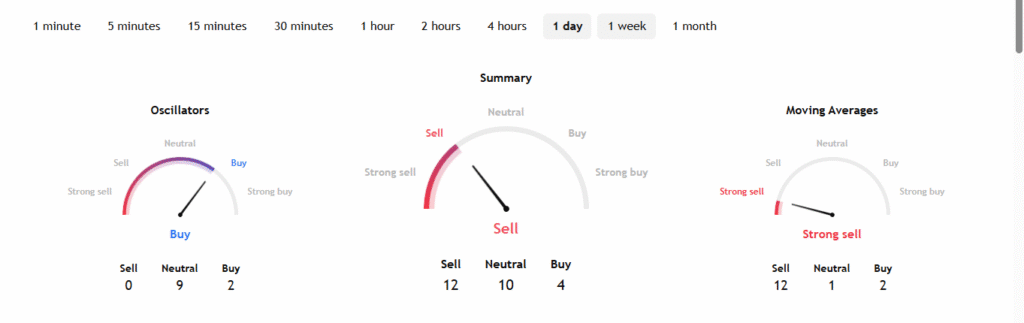
If we go through the 24-hour technical chart, the oscillators suggest a buy state, while moving averages show a strong sell situation. Overall, the summary goes in favour of selling. The 20, 50 and 100-day exponential moving averages stand at $90.58, $106.65 and $124.17, respectively, all showing a selling state.

An analyst has predicted that if Solana is not able to break $85, its price could slip into the $50-$30 range, widening its decline in the last two years. He has also anticipated that once the price reaches $1,000, SOL could rally strongly and gradually toward $10,000.

He has signified $9,270 as the upcoming long-term target, showing a rally of approx 27,660%.

Highlighted Crypto News Today:

Momentum Weakens for Ethena (ENA): Will the Bears Deliver Another Blow?

TagsPriceAnalysisSolanaSolana Price

Trending Cryptos

Related Questions

QWhat is the current price of Solana and how has it performed in the last 24 hours?

ASolana is currently trading at $83.70, which is a 2.85% increase in the past 24 hours.

QWhat does the crypto fear and greed index of 12 indicate about the current market sentiment?

AA crypto fear and greed index of 12 represents an 'extreme fear' state, indicating that most investors are still selling their assets rapidly.

QAccording to the 24-hour technical analysis, what is the overall summary for Solana's trading signals?

AThe overall summary of the 24-hour technical analysis is in favor of selling, with oscillators suggesting a buy but moving averages showing a strong sell situation.

QHow far is Solana's current price from its all-time high, and what was that value?

ASolana's current price is 71.44% lower than its all-time high of $294.33, which was recorded on January 19, 2025.

QWhat is the analyst's prediction for Solana's price if it fails to break the $85 level?

AAn analyst predicted that if Solana is not able to break the $85 level, its price could slip into the $50-$30 range.

Related Reads

ChangXin's "Peer": The Fate of Fujian Jinhua Integrated Circuit Co., Ltd. Is Regrettable

China's DRAM industry saw a pivotal moment with ChangXin's (CXMT) successful IPO. However, the fate of its 2016 counterpart, Fujian Jinhua Integrated Circuit, offers a stark contrast. Both were founded the same year with similar missions, massive investment, and 12-inch wafer fab goals to break into the DRAM market dominated by Samsung, SK Hynix, and Micron. Fujian Jinhua initially progressed faster by partnering with Taiwan's United Microelectronics Corporation (UMC) for 32nm DRAM technology. This strategy, however, led to a protracted legal battle. In 2017, Micron sued UMC and Jinhua for trade secret theft. The situation escalated in October 2018 when the U.S. Commerce Department added Fujian Jinhua to its Entity List, citing its imminent mass production as a threat. This resulted in an immediate halt of equipment, software, and technical support from American suppliers, followed by UMC suspending cooperation. Although Jinhua was eventually cleared of criminal charges in late 2023 after a nearly six-year legal saga, it missed the critical industry growth window. In contrast, ChangXin took a different path from the start, focusing on building its own R&D system and securing intellectual property, notably through a license for former Qimonda patents. While also facing U.S. scrutiny and initial heavy losses, ChangXin benefited from a more mature domestic supply chain when it reached mass production. It achieved profitability in 2025 and represents the rise of China's DRAM industry. Jinhua's story is a crucial lesson. It was the first Chinese DRAM company to confront the complex realities of international IP disputes, export controls, and supply chain vulnerabilities. Today, it has resumed operations with a 40,000 wafers-per-month capacity, aiming for 60,000. While it missed its initial opportunity, its experience informed the strategic evolution of later Chinese semiconductor firms.

marsbit18m ago

ChangXin's "Peer": The Fate of Fujian Jinhua Integrated Circuit Co., Ltd. Is Regrettable

marsbit18m ago

Crypto Fear and Greed Index Rises Over Last 24 Hours! Has It Exited the Fear Zone? Here are the Details

The Crypto Fear and Greed Index, a key indicator measuring investor sentiment in the cryptocurrency market, showed a limited recovery over the past 24 hours. According to data from CoinMarketCap, the index rose by 2 points to reach 37. Despite this increase, the indicator remains in the "Fear" zone, reflecting a continued cautious approach among investors. The index, which ranges from 0 (extreme fear) to 100 (extreme greed), suggests that while there is a slight improvement in investor confidence, market participants are still largely risk-averse. CoinMarketCap calculates the index by considering factors such as the price movements of the top 10 cryptocurrencies, overall market volatility, derivatives market data (like put/call ratios), stablecoin supply ratios, and user search data. Analysts note that the modest index rise points to a slight easing of market panic. However, its persistence in the fear zone indicates ongoing investor caution due to macroeconomic events, interest rate policies, and regulatory uncertainty. Experts suggest that for a sustained improvement in sentiment, increased trading volumes and stronger institutional capital inflows are necessary. Key factors expected to influence market mood in the coming period include capital flows into spot Bitcoin and Ethereum ETFs and developments in global monetary policy. While the index alone is not a sufficient tool for investment decisions, its potential to exit the fear zone is seen as a significant signal for the future direction of the crypto market.

cryptonews.ru18m ago

Crypto Fear and Greed Index Rises Over Last 24 Hours! Has It Exited the Fear Zone? Here are the Details

cryptonews.ru18m ago

Playing the "Decoupling" Card Again? Domestic Optical Modules Face a Stress Test

The U.S. Federal Communications Commission (FCC) is reportedly drafting a ban on importing new models of Chinese-made optical transceiver modules, with a potential implementation target of 2026. This "decoupling" move comes as Chinese firms, led by industry leaders like Zhongji Innolight and Eoptolink, dominate the global optical module market with over 60% share, and hold an even larger position in the high-speed 800G and 1.6T segments critical for AI data centers. Market reactions were mixed: U.S. optical module stocks initially rose, while Chinese A-shares opened lower but largely recovered by the close. Analysis suggests a complete U.S. decoupling from Chinese modules faces significant hurdles. North American cloud giants (Meta, Google, Microsoft, Amazon) and NVIDIA have massive demand for high-speed modules, estimated at around 40 million units in 2026. U.S. manufacturers' combined monthly production capacity for these modules is less than one-fifth that of a single major Chinese player like Zhongji Innolight, which reported production of 23.76 million units in 2025. Chinese companies are heavily reliant on the U.S. market, with over 90% of revenue for top firms coming from overseas, primarily the U.S. However, they have begun mitigating risks by establishing assembly plants in Southeast Asia and Mexico. Industry observers note the final impact depends on whether any potential U.S. restrictions target specific companies or products based on origin. Past U.S. sanctions on Chinese tech firms have often spurred increased domestic R&D and market diversification. Despite initial stock volatility, shares of major Chinese optical module companies pared losses, indicating market belief in the sector's resilience and the practical difficulties of abruptly replacing Chinese supply.

marsbit1h ago

Playing the "Decoupling" Card Again? Domestic Optical Modules Face a Stress Test

marsbit1h ago

Trading

Spot

Hot Articles

Discussions

Welcome to the HTX Community. Here, you can stay informed about the latest platform developments and gain access to professional market insights. Users' opinions on the price of SOL (SOL) are presented below.

活动图片