Smart Money Still Selling Ethereum? Futures CVD Shows $5.7B Bearish Pressure

bitcoinistPublished on 2026-03-14Last updated on 2026-03-14

Abstract

Ethereum is testing key resistance levels as the broader crypto market shows signs of stabilization. Despite a slight daily advantage for buyers in futures, with a positive Taker Delta of $7.15 million, the broader 90-day Smart Money CVD remains deeply negative at -$5.71 billion. This indicates sustained aggressive selling pressure has dominated over the past three months. However, analysts note that large buyers may be absorbing this selling through limit orders, potentially setting the stage for a future momentum shift if the pressure subsides.

Ethereum is currently testing key resistance levels as the broader cryptocurrency market attempts to recover from the recent period of volatility and downward pressure. After weeks of corrective price action, ETH has begun to stabilize, with buyers gradually pushing the asset higher as traders reassess market conditions and liquidity flows across digital assets.

While price action suggests the possibility of a short-term rebound, derivatives market data indicate that bigger structural changes may be unfolding beneath the surface. According to a recent analysis from CryptoQuant analyst Arab Chain, the ETH Binance Futures Smart Money CVD (90D) indicator is beginning to reflect notable shifts in the demand dynamics within Ethereum’s derivatives market on Binance.

The indicator tracks the cumulative difference between aggressive buy orders and aggressive sell orders executed through market orders in the futures market. Because these orders represent traders willing to immediately execute trades, the metric provides valuable insight into real-time demand pressure from more active market participants.

According to the latest data, aggressive buying volume in Ethereum futures on Binance recently reached approximately $4.583 billion, while aggressive selling volume totaled around $4.576 billion. As a result, the daily Taker Delta recorded a positive value of roughly $7.15 million, indicating a slight advantage for buyers during that session as the market attempted to regain momentum.

Smart Money CVD Still Reflects Dominant Selling Pressure

Despite the recent session showing a slight advantage for buyers, the broader structure of Ethereum’s derivatives market remains tilted toward selling pressure. According to the analysis, the 90-day rolling Smart Money CVD still registers a negative reading of approximately -$5.71 billion, indicating that aggressive selling activity has outweighed aggressive buying over the past three months.
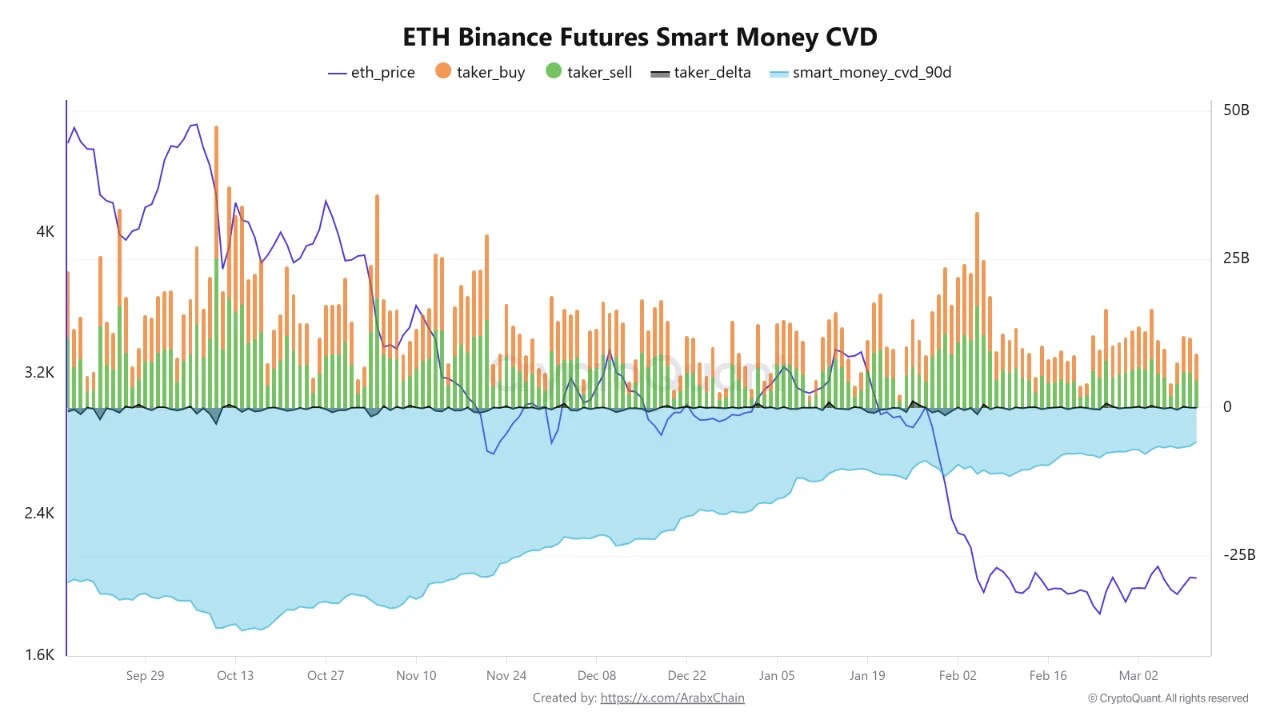
Ethereum Binance Futures Smart Money CVD | Source: CryptoQuant

In practical terms, this means that market participants using market orders have been more willing to sell Ethereum than to accumulate it during that period. Because the CVD tracks the cumulative difference between buy and sell orders executed directly in the market, sustained negative values typically reflect a market environment dominated by sellers closing positions or initiating short trades.

However, analysts note that negative CVD readings do not automatically translate into immediate downward price movement. Market dynamics can sometimes produce a different outcome through a mechanism known as liquidity absorption.

In such situations, large buyers place substantial limit orders in the order book, allowing them to absorb selling pressure without significantly pushing the price higher in the short term. This behavior can create a temporary equilibrium where aggressive sellers continue to hit bids while patient buyers gradually accumulate supply.

If this absorption process persists, it may eventually reduce sell-side pressure and lay the groundwork for a potential shift in market momentum.


Trending Cryptos

Related Questions

QWhat does the negative 90-day Smart Money CVD reading of -$5.71 billion indicate for Ethereum's derivatives market?

AIt indicates that aggressive selling activity has significantly outweighed aggressive buying over the past three months, reflecting a market environment dominated by sellers closing positions or initiating short trades.

QAccording to the article, what was the daily Taker Delta value and what does it signify?

AThe daily Taker Delta recorded a positive value of roughly $7.15 million, indicating a slight advantage for buyers during that specific trading session as the market attempted to regain momentum.

QHow does the Smart Money CVD indicator measure market activity on Binance?

AIt tracks the cumulative difference between aggressive buy orders and aggressive sell orders executed through market orders, providing insight into real-time demand pressure from active traders willing to immediately execute trades.

QWhat mechanism can allow for a negative CVD reading without causing an immediate price drop, as mentioned in the analysis?

ALiquidity absorption, where large buyers place substantial limit orders to absorb selling pressure without significantly pushing the price higher in the short term, creating a temporary equilibrium.

QWhat are the recent aggressive buying and selling volumes for Ethereum futures on Binance as cited in the article?

AAggressive buying volume was approximately $4.583 billion, while aggressive selling volume totaled around $4.576 billion.

Related Reads

Will the Fed Definitely Raise Interest Rates in September? How Will Crypto and U.S. Stocks Withstand the Pressure?

The market's expectation for a September Fed rate hike surged dramatically in early August, jumping from under 50% to over 80% within a week. This shift followed a contentious July FOMC meeting, where a 9-3 vote to hold rates revealed growing dissent from hawkish members advocating for an immediate hike to combat persistent inflation. The primary catalyst for this repricing is rising oil prices, driven by renewed geopolitical tensions around the Strait of Hormuz, which threaten global supply. Energy costs directly influence inflation metrics, making the upcoming July CPI report (due August 12th) a critical data point. If it shows inflation reaccelerating, the probability of a September hike will solidify. For Bitcoin and crypto assets, this is typically bearish news. Bitcoin continues to behave as a high-beta, liquidity-sensitive risk asset. A rate hike raises the opportunity cost of holding non-yielding assets and could drive capital toward money markets, pressuring crypto prices in the short term. However, historical patterns suggest that if a hike is perceived as the end of a tightening cycle rather than the start, any negative price impact may be brief. U.S. stocks, particularly crypto-linked equities like Coinbase and growth-oriented tech stocks, are also vulnerable. Higher rates increase discount rates in valuation models, putting pressure on high-multiple companies. This coincides with a pivotal tech earnings season where investor focus has shifted from massive AI capital expenditure to tangible revenue and cash flow generation. Companies with negative cash flow and weak growth narratives could face heightened volatility if borrowing costs rise in September. In summary, a September Fed hike has evolved into a mainstream market scenario. Key factors to watch are oil prices, the July CPI report, and Fed communications, which will determine the final decision and its impact on volatile crypto and equity markets.

marsbit1m ago

Will the Fed Definitely Raise Interest Rates in September? How Will Crypto and U.S. Stocks Withstand the Pressure?

marsbit1m ago

A 'Overlooked' Market Event: Joint US-Japan-South Korea Intervention, Rare US Treasury Involvement, and Bessent's Quiet 'Market Rescue'?

Summary: The United States, Japan, and South Korea executed their largest coordinated foreign exchange intervention in nearly 30 years. The action targeted depreciation pressure on the Japanese yen and South Korean won. This move is seen as a significant effort by the US to stabilize the financial markets of its key allies and prevent the spillover of risks. Key details: * Japan reportedly intervened on July 30 using approximately 8.45 trillion yen (about $52.8 billion). South Korean authorities also intervened that day, selling dollars to support the won. * Notably, the US Treasury Department intervened directly in yen markets for the first time in roughly 30 years. The New York Fed, reportedly acting on behalf of the Treasury, sold euros to buy yen via Goldman Sachs and Morgan Stanley on July 31. Analysts view the use of the euro-yen pair as a way to alleviate yen pressure without adding selling pressure to the US dollar. * Prior to the action, the New York Fed conducted "rate checks" on both USD/JPY and EUR/JPY, a newer signaling tool that falls between verbal and physical intervention. The intervention is interpreted as going beyond traditional currency stabilization. Analysts, such as Michael Hartnett of Bank of America, suggest it resembles a "Price Keeping Operation" for the AI era. The core US objectives are perceived to be: 1. Preventing rapid yen depreciation from triggering a sharp rise in Japanese government bond yields. 2. Containing financial stress from spreading across Asian markets like South Korea and Japan. 3. Reducing the risk of disorderly capital flows impacting the US bond market. This coordinated action underscores the importance of Japan and South Korea as critical partners in the US semiconductor and AI supply chain. Stabilizing their financial markets is seen as vital to mitigating risks to the broader tech industry and the US market itself. The intervention coincides with market pressures, including the KOSDAQ index hitting a low since October 2022. While seen as a move to control volatility, some analysts caution it may not fundamentally reverse existing market trends.

marsbit5m ago

A 'Overlooked' Market Event: Joint US-Japan-South Korea Intervention, Rare US Treasury Involvement, and Bessent's Quiet 'Market Rescue'?

marsbit5m ago

Will the Federal Reserve Definitely Raise Interest Rates in September? How Will Cryptocurrencies and US Stocks Bear the Pressure?

In early August 2024, market expectations for a September Federal Reserve rate hike surged dramatically, from below 50% to over 80%, driven by renewed inflation concerns. This shift followed a contentious July FOMC meeting where a 9-3 vote to hold rates revealed a growing hawkish faction advocating for an immediate hike, citing prolonged above-target inflation. The key catalyst is escalating conflict near the Strait of Hormuz, which has pushed oil prices up approximately 20% in July, threatening to reignite inflation. The next critical data point is the July CPI report on August 12th; a hot reading could solidify hike expectations. For crypto assets, particularly Bitcoin, this represents near-term pressure. Bitcoin continues to exhibit high-beta, risk-on characteristics, making it sensitive to tightening liquidity and higher opportunity costs. However, historical precedent suggests that if a hike is perceived as the cycle's end rather than its start, the negative impact may be brief, with markets quickly pivoting to anticipate future rate cuts. U.S. stocks, especially crypto-linked equities like Coinbase and high-valuation tech stocks, face amplified volatility. Higher rates increase discount rates in valuation models, pressuring growth stocks. This coincides with a pivotal tech earnings season where investor focus has shifted from massive AI capital expenditures to demonstrable revenue and cash flow generation. Companies with negative cash flows and weak growth narratives could see severe pressure if a September hike materializes, as financing costs would rise. Key indicators to watch include oil prices, upcoming inflation data, and Fed commentary at events like the Jackson Hole symposium.

Odaily星球日报5m ago

Will the Federal Reserve Definitely Raise Interest Rates in September? How Will Cryptocurrencies and US Stocks Bear the Pressure?

Odaily星球日报5m ago

Trading

Spot

Hot Articles

Discussions

Welcome to the HTX Community. Here, you can stay informed about the latest platform developments and gain access to professional market insights. Users' opinions on the price of ETH (ETH) are presented below.

活动图片