Returning to $70,000: Is Bitcoin's Violent Rebound a Trend Restart or a Bull Trap?

比推Published on 2026-02-09Last updated on 2026-02-09

Abstract

Bitcoin experienced a violent rebound from $60,000 to over $70,000 within 24 hours, erasing a recent 14% crash. However, the rally was not driven by strong spot buying but rather by a combination of macro market stabilization and forced short-covering amid extreme fear sentiment in derivatives markets. Key factors behind the earlier selloff included expectations of liquidity tightening due to Trump’s potential Fed appointment, pressure on miner profitability, and spillover from tech stock and metals volatility. Despite the sharp recovery, options traders are heavily hedging against a potential retest of the $50,000–$60,000 range by late February. Sustaining $70,000 depends on continued macro stability, reduced ETF outflows, and normalized derivatives sentiment. The rebound appears more of a mechanical squeeze than a conviction-driven reversal.

Author: CryptoSlate

Compiled by: Deep Tide TechFlow

Original title: Bitcoin Returns to $70K, Rebound or Real Trap?


Deep Tide Insights:

After a violent rebound from $60,000 to $70,000 within 24 hours, Bitcoin appears to have recovered its losses. However, underlying logic reveals that this was not driven by firm spot buying but rather by a forced repositioning and short squeeze triggered by a recovery in the macro market. This article delves into the causes of the "hair-raising turmoil" in early February 2026: from liquidity contraction expectations following Trump's appointment of Kevin Warsh to the pressure on miners' profits hitting a historical low. Although the price has returned above $70,000, options traders are heavily betting on a potential second dip to $50,000–$60,000 by the end of February, revealing the still fragile sentiment and complex financial博弈 beneath the surface of the "violent rebound."

Bitcoin surged from $60,000 to above $70,000 in less than 24 hours, erasing the brutal 14% decline that had tested all "buy-the-dip" theories in the market.

The speed of this reversal—a 12% single-day rebound and a 17% recovery from the intraday low—was so intense that it felt like the dust had cleared after a liquidation. However, the mechanism behind the rebound tells another story: it was more a combination of cross-asset stabilization and forced position rebalancing rather than conviction-driven large-scale spot demand.

Meanwhile, the derivatives market remains crowded with bearish protection positions, with pricing suggesting that $70,000 may be just a waystation rather than a true bottom.

Liquidation Wave Meets Macro Pressure

On February 5, the market opened near $73,100, briefly rallied, then collapsed, closing at $62,600. According to CoinGlass data, the single-day decline led to the liquidation of approximately $1 billion in leveraged Bitcoin positions.

This figure alone illustrates the chain reaction of forced selling, but the broader context was even worse.

CoinGlass data shows that Bitcoin futures open interest had already dropped from about $61 billion to $49 billion last week, meaning the market had begun deleveraging before the final wave of冲击 hit.

The trigger was not internal to cryptocurrency. Media reports characterized the sell-off as a deterioration in risk sentiment, primarily driven by a tech stock sell-off and volatility in precious metals—silver once plunged 18% to around $72.21, dragging down all related risk assets.

Deribit's research confirmed this spillover effect, noting that derivatives sentiment had turned extremely bearish: negative funding rates, an inverted implied volatility term structure, and the 25-delta risk-reversal skew depressed to around -13%.

This is a classic state of "extreme fear," where positioning amplifies price swings in both directions.

Policy narratives added fuel to the fire. According to Reuters, the market reacted violently to elected President Donald Trump's choice of Kevin Warsh as Fed chair, with traders interpreting it as a signal of future balance sheet contraction and liquidity tightening.

Meanwhile, miners faced significant profit pressure. According to TheMinerMag, the hash price fell below $32 per PH/s, and network difficulty was expected to drop by about 13.37% in two days. However, this relief mechanism had not yet taken effect before prices broke below support levels.

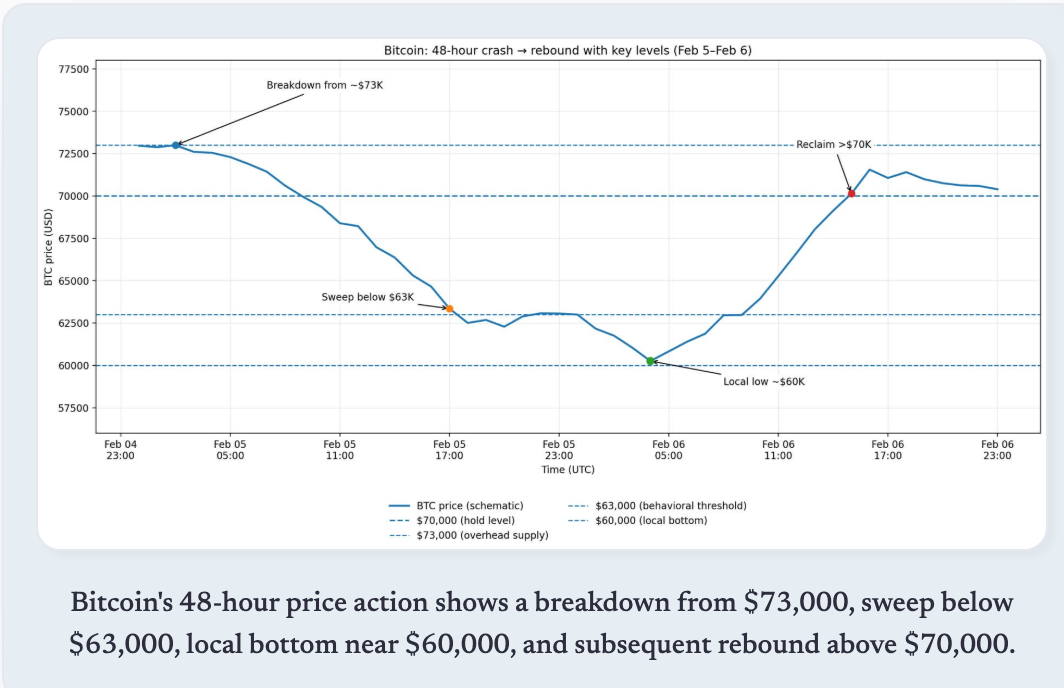
Bitcoin's price action over 48 hours, showing the crash from $73,000, the break below $63,000 triggering stop-losses, local bottoming near $60,000, and the subsequent rebound to above $70,000.

Macro Reversal and Squeeze Mechanism

On February 6, the market opened at the previous day's close, then fell to an intraday low near $60,000 before skyrocketing to a high of $71,422. After three failed attempts to break above this level, the price retreated below $70,000.

The catalyst did not originate from within the crypto industry but from a sharp turnaround in cross-asset movements. Wall Street performed strongly: the S&P 500 rose 1.97%, the Nasdaq gained 2.18%, the Dow Jones increased by 2.47%, and the Philadelphia Semiconductor Index (SOX) surged 5.7%.

Metal prices rebounded猛烈ly, with gold up 3.9% and silver up 8.6%, while the U.S. dollar index fell 0.2%, signaling a loosening of financial conditions.

Bitcoin moved mechanically with this shift. The correlation was evident: as tech stocks stabilized and metals rebounded, Bitcoin was pulled up through common risk exposures.

However, the violence of this rebound also reflected derivatives positioning. A skew near -13%, negative funding rates, and an inverted volatility structure created conditions where any macro-positive catalyst could trigger short-covering and forced repositioning.

This rebound was essentially driven by a liquidity event and amplified by the unwinding of crowded short positions.

Nonetheless, forward-looking signals remain bearish. Data from Deribit shows that for options expiring on February 27, put open interest is heavily concentrated at strike prices between $60,000 and $50,000.

Deribit's Sean Dawson told Reuters that demand for downside protection was "extreme." This is not hindsight analysis but rather traders explicitly hedging against the next drop, even after the rebound.

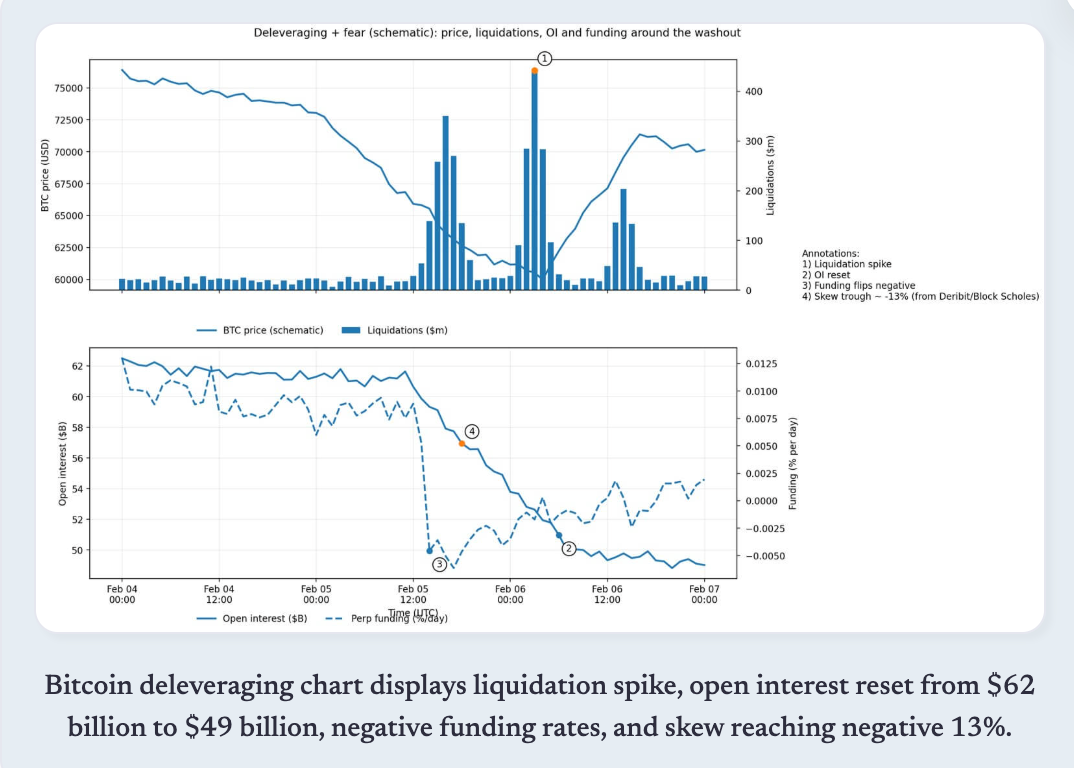
Bitcoin deleveraging chart, showing the surge in liquidations, open interest reset from $62 billion to $49 billion, negative funding rates, and skew hitting -13%.

Can $70K Hold? Analytical Framework

The logic for holding $70,000 is based on three conditions.

First, the macro rebound needs to be sustained, with tech stocks continuing to stabilize and U.S. Treasury yields and the dollar not tightening again. This rebound was clearly a cross-asset联动; if U.S. stocks turn lower again, Bitcoin will not be immune.

Second, leverage needs to continue cooling off with no new forced selling. Open interest has already dropped significantly, reducing the risk of a "vacuum drop."

Third, miner pressure needs to be substantially alleviated when the difficulty adjustment takes effect. If prices can hold steady within the adjustment window, the expected 13.37% difficulty reduction will reduce marginal selling pressure and allow the hash rate to stabilize.

Arguments supporting another washout also have three reasons:

First, options positioning remains bearish. The largest put concentrations for late February are at $60,000–$50,000, a forward-looking signal embedded in the market's implied probabilities, not lagging sentiment.

Second, derivatives signals remain fragile. Extreme skew, recently frequent negative funding rates, and an inverted volatility structure are more consistent with a "relief rally" within a fear regime than a trend reversal.

Third, ETF flow data shows持续outflows. As of February 5, monthly net outflows for Bitcoin ETFs had reached $690 million. Although data for February 6 is not yet available, existing patterns suggest institutional allocators have not shifted from "de-risking" to "re-engagement."
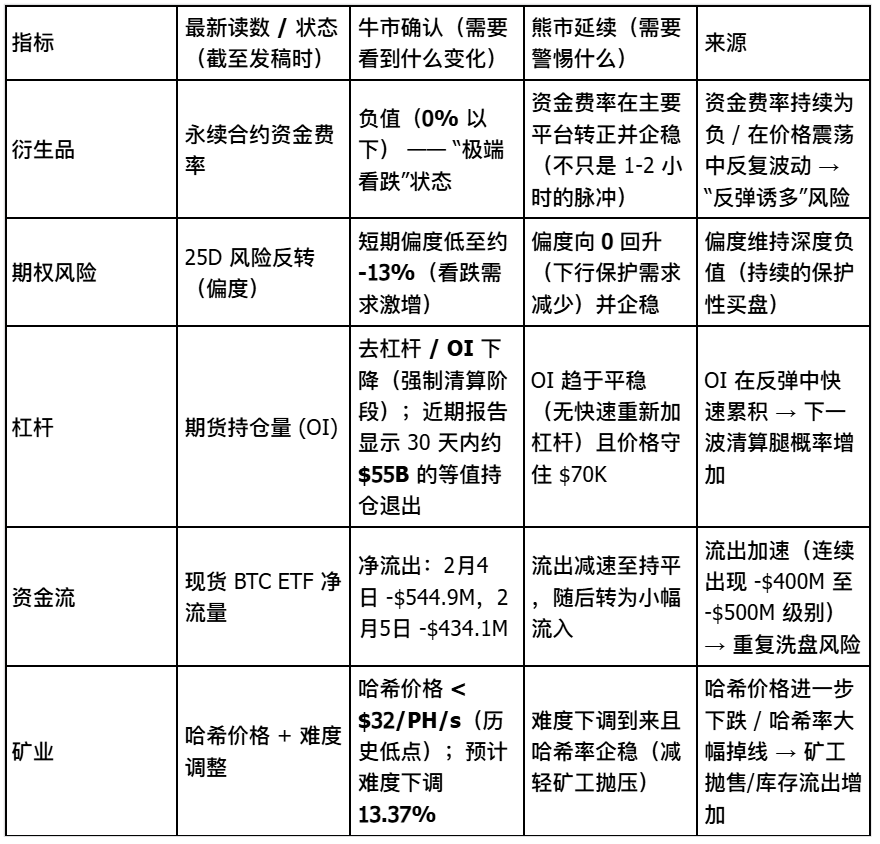
Signal Dashboard

The True Significance of $70K

This price level itself holds no magic. Its importance lies in its position above the on-chain absorption cluster of $66,900 to $70,600 identified by Glassnode.

Holding $70,000 means this cluster has absorbed enough supply to temporarily stabilize prices. However, holding firm requires not only technical support but also the return of spot demand, the unwinding of derivatives hedge positions, and the stabilization of institutional flows.

The rebound from $60,000 was real, but its composition is crucial. If macro conditions change, cross-asset stability will reverse.

Forced position unwinding created a mechanical rebound, which does not necessarily translate into a sustained trend. Options traders are still pricing in a significant probability of a drop toward $50,000–$60,000 within the next three weeks.

Bitcoin has reclaimed $70,000 but is currently consolidating below it. This suggests a pause before the next test, and the outcome of that test depends on three conditions occurring sequentially: maintained macro risk appetite, a slowdown or reversal in ETF outflows, and normalized derivatives sentiment.

The market delivered a violent snapback, but the forward curve and flow data indicate that traders are not yet betting on its persistence. $70,000 is not the endgame; it is merely the baseline that will determine the winner of the next phase of the debate.


Twitter:https://twitter.com/BitpushNewsCN

BitPush TG Discussion Group:https://t.me/BitPushCommunity

BitPush TG Subscription: https://t.me/bitpush

Original article link:https://www.bitpush.news/articles/7610357

Trending Cryptos

Related Questions

QWhat were the main factors that triggered Bitcoin's violent rebound from $60,000 to $70,000?

AThe rebound was primarily driven by a cross-asset stabilization and forced rebalancing of positions, not strong spot buying. It was amplified by a macro market recovery, including strong performance in tech stocks (S&P 500 up 1.97%, Nasdaq up 2.18%), a rebound in metals (gold up 3.9%, silver up 8.6%), and a short squeeze due to extreme bearish derivatives positioning with negative funding rates and inverted volatility structures.

QWhy did the options market indicate a bearish outlook despite the price rebound to $70,000?

AOptions traders were heavily hedging against further downside risk, with significant put open interest concentrated at strike prices between $50,000 and $60,000 for late February expiries. This reflected embedded market expectations of a potential second drop, rather than confidence in the sustainability of the rebound.

QWhat role did miners play in the market dynamics during Bitcoin's price crash and recovery?

AMiners faced severe profit pressure as the hash price dropped below $32 per PH/s, and the network difficulty was expected to decrease by about 13.37%. This created selling pressure from miners, though the difficulty adjustment had not yet taken effect at the time of the crash, contributing to the market's fragility.

QWhat conditions are necessary for Bitcoin to sustainably hold above $70,000 according to the analysis?

AThree key conditions are needed: 1) sustained macro rebound with stable tech stocks and relaxed financial conditions (lower U.S. Treasury yields and dollar strength), 2) continued cooling of leverage without new forced selling, and 3) relief in miner pressure post-difficulty adjustment to reduce marginal selling. Additionally, ETF flows need to stabilize or reverse from outflows to inflows.

QHow did external macroeconomic events influence Bitcoin market sentiment and price action?

AExternal events significantly impacted sentiment: a sell-off in tech stocks and metals (e.g., silver dropping 18%) initially triggered risk-off sentiment. Later, rumors of Donald Trump appointing Kevin Warsh as Fed chair raised fears of liquidity tightening and balance sheet contraction, exacerbating the crash. The subsequent rebound was tied to a macro reversal, including equity gains and metal recoveries, showing Bitcoin's correlation with broader financial markets.

Related Reads

Playnance’s $GCOIN Lists on KoinBX Amid Rapid Growth in India

Playnance's native token, $GCOIN, has been listed on the cryptocurrency exchange KoinBX as of June 18. This move aims to enhance accessibility for its rapidly growing community, particularly in India, where the blockchain-powered Web3 iGaming ecosystem has gained significant traction. Over 130 partners in Playnance's "Be the Boss" program have built communities engaging thousands of active players in the region. The "Be the Boss" model allows participants to create and manage their own gaming communities, earning rewards tied to community activity. CEO Pini Peter noted India's high engagement, with community leaders successfully building player networks. One partner, Dr. Nicolas, reported earning over $57,000 through the program in recent months, highlighting both the financial rewards and the opportunity to grow an engaged community. $GCOIN serves as the ecosystem's core utility token, incentivizing participation and aligning the interests of players and community leaders ("Bosses"). The listing on KoinBX is part of Playnance's strategy to expand globally, increasing the token's utility and accessibility by combining community ownership, gamified engagement, and blockchain-based incentives. Founded in 2020, Playnance is a Web3 iGaming infrastructure company focused on creating live, non-custodial, on-chain products to onboard mainstream users. It currently processes approximately one million transactions daily, aiming to simplify the user experience while maintaining full on-chain transparency.

TheNewsCrypto18m ago

Playnance’s $GCOIN Lists on KoinBX Amid Rapid Growth in India

TheNewsCrypto18m ago

STRC Hits Historic Low, Saylor's Perpetual Motion Machine Grinds to a Halt

STRC, the perpetual preferred stock issued by MicroStrategy to fund its Bitcoin purchases, hit a historic low of $85.32, a 17% discount to its $100 par value. Designed as a "digital credit engine" to trade stably near par and enable continuous share issuance for buying Bitcoin, its plunge signals a breakdown in this model. Three key factors drove the decline: 1. Bitcoin's price fell over 50% from its peak, trading around $63,000 amid hawkish Fed signals. 2. MicroStrategy's cash reserves were depleted after a $1.5 billion convertible note repayment, slashing the dividend coverage for STRC's 11.5% yield to ~7 months. The company then sold 32 BTC to cover dividends—Michael Saylor's first Bitcoin sale since 2022—damaging the "never sell" narrative. 3. A competing Bitcoin-backed preferred stock, Strive's SATA, offers a higher yield (~13%) and daily dividends, drawing investors away from STRC. The drop triggers a negative cycle: STRC below par halts ATM share issuances, cutting off a key funding source for Bitcoin buys and potentially forcing more BTC sales for dividends, further eroding confidence. While Saylor argues the model is mathematically sound—needing only 2.3% annual Bitcoin growth to sustain itself—the market is testing the resilience of the leveraged Bitcoin treasury strategy in a bear market. The STRC price now reflects rising skepticism about this financial machinery's durability during downturns.

marsbit38m ago

STRC Hits Historic Low, Saylor's Perpetual Motion Machine Grinds to a Halt

marsbit38m ago

A Guide to Grayscale’s ‘Bottom Fishing’: Using Cash Flow to Assess Cryptocurrency Value

**Title:** Grayscale's Guide to Bottom-Fishing: Valuing Cryptoassets Using Cash Flows **Summary:** This report by Grayscale Research presents a fundamental valuation framework for cryptocurrency assets, moving beyond pure speculation to analyze those with underlying cash flows. It distinguishes between "commodity-like" assets (e.g., Bitcoin) and "cash-flow" assets, primarily within DeFi. Using the leading decentralized lending protocol Aave as a case study, the analysis applies traditional financial methodologies like Discounted Cash Flow (DCF) and Price-to-Earnings (P/E) multiples. Key findings indicate that AAVE tokens are currently undervalued. Despite recent challenges, the protocol's strong revenue growth, ~50% net profit margin, and diversified treasury support a fundamental valuation range of $80-$100 per token (compared to a ~$75 market price at the time of writing). In a base-case scenario driven by stablecoin adoption and regulatory clarity, the fair value could rise to around $175 within a year. The report emphasizes that protocol success does not automatically translate to token value. It critically examines the "value capture" mechanisms—such as buybacks, burns, and staking rewards—that channel protocol profits to token holders. Furthermore, it addresses the legal and governance complexities of Decentralized Autonomous Organizations (DAOs), noting their difference from traditional corporate equity but highlighting how robust, transparent governance can align protocol economics with holder interests. The conclusion is that the crypto market is maturing, with capital increasingly flowing towards projects with demonstrable fundamentals, real adoption, and disciplined capital allocation, creating opportunities for value-based investors.

marsbit1h ago

A Guide to Grayscale’s ‘Bottom Fishing’: Using Cash Flow to Assess Cryptocurrency Value

marsbit1h ago

After semiconductors lead the gains, are funds buying into AI orders or a macroeconomic rebound?

After US-Iran talks led to a temporary ceasefire and framework for reopening the strategic Strait of Hormuz, U.S. stocks rose on June 18, with the Nasdaq gaining 1.9%. The semiconductor and AI hardware sectors outperformed. This rally stemmed primarily from reduced geopolitical risk, which lowered oil prices and inflation expectations, easing discount rate pressure on high-valuation growth stocks like tech. The key question is not whether tech rebounded, but the nature of the rebound. The market appears to be selectively repricing AI infrastructure plays rather than broadly chasing AI narratives. Gains were concentrated in chips, optical interconnects, memory, and domestic manufacturing—segments tied to tangible data center build-outs and capital expenditure. Intel's ~10% surge, fueled by a Trump statement about potential Apple collaboration, exemplifies this mixed dynamic. It reflects policy catalysts and domestic manufacturing sentiment more than confirmed fundamentals. Meanwhile, strong earnings from companies like Astera Labs (revenue up 93% YoY) provided concrete evidence of AI-driven demand in hardware. In essence, the rally represents a risk-premium recalibration. Lower Middle East tensions opened a valuation repair window, and capital flowed first into AI infrastructure segments with visible near-term revenue streams. The sustainability of this move hinges on upcoming Q2 earnings, specifically continued strength in cloud provider capex, AI server orders, and hardware company guidance. Policy hopes alone are insufficient; the cycle needs validation from orders and financials.

marsbit1h ago

After semiconductors lead the gains, are funds buying into AI orders or a macroeconomic rebound?

marsbit1h ago

Trading

Spot
Futures

Hot Articles

What is $BITCOIN

DIGITAL GOLD ($BITCOIN): A Comprehensive Analysis Introduction to DIGITAL GOLD ($BITCOIN) DIGITAL GOLD ($BITCOIN) is a blockchain-based project operating on the Solana network, which aims to combine the characteristics of traditional precious metals with the innovation of decentralized technologies. While it shares a name with Bitcoin, often referred to as “digital gold” due to its perception as a store of value, DIGITAL GOLD is a separate token designed to create a unique ecosystem within the Web3 landscape. Its goal is to position itself as a viable alternative digital asset, although specifics regarding its applications and functionalities are still developing. What is DIGITAL GOLD ($BITCOIN)? DIGITAL GOLD ($BITCOIN) is a cryptocurrency token explicitly designed for use on the Solana blockchain. In contrast to Bitcoin, which provides a widely recognized value storage role, this token appears to focus on broader applications and characteristics. Notable aspects include: Blockchain Infrastructure: The token is built on the Solana blockchain, known for its capacity to handle high-speed and low-cost transactions. Supply Dynamics: DIGITAL GOLD has a maximum supply capped at 100 quadrillion tokens (100P $BITCOIN), although details regarding its circulating supply are currently undisclosed. Utility: While precise functionalities are not explicitly outlined, there are indications that the token could be utilized for various applications, potentially involving decentralized applications (dApps) or asset tokenization strategies. Who is the Creator of DIGITAL GOLD ($BITCOIN)? At present, the identity of the creators and development team behind DIGITAL GOLD ($BITCOIN) remains unknown. This situation is typical among many innovative projects within the blockchain space, particularly those aligning with decentralized finance and meme coin phenomena. While such anonymity may foster a community-driven culture, it intensifies concerns about governance and accountability. Who are the Investors of DIGITAL GOLD ($BITCOIN)? The available information indicates that DIGITAL GOLD ($BITCOIN) does not have any known institutional backers or prominent venture capital investments. The project seems to operate on a peer-to-peer model focused on community support and adoption rather than traditional funding routes. Its activity and liquidity are primarily situated on decentralized exchanges (DEXs), such as PumpSwap, rather than established centralized trading platforms, further highlighting its grassroots approach. How DIGITAL GOLD ($BITCOIN) Works The operational mechanics of DIGITAL GOLD ($BITCOIN) can be elaborated on based on its blockchain design and network attributes: Consensus Mechanism: By leveraging Solana’s unique proof-of-history (PoH) combined with a proof-of-stake (PoS) model, the project ensures efficient transaction validation contributing to the network's high performance. Tokenomics: While specific deflationary mechanisms have not been extensively detailed, the vast maximum token supply implies that it may cater to microtransactions or niche use cases that are still to be defined. Interoperability: There exists the potential for integration with Solana’s broader ecosystem, including various decentralized finance (DeFi) platforms. However, the details regarding specific integrations remain unspecified. Timeline of Key Events Here is a timeline that highlights significant milestones concerning DIGITAL GOLD ($BITCOIN): 2023: The initial deployment of the token occurs on the Solana blockchain, marked by its contract address. 2024: DIGITAL GOLD gains visibility as it becomes available for trading on decentralized exchanges like PumpSwap, allowing users to trade it against SOL. 2025: The project witnesses sporadic trading activity and potential interest in community-led engagements, although no noteworthy partnerships or technical advancements have been documented as of yet. Critical Analysis Strengths Scalability: The underlying Solana infrastructure supports high transaction volumes, which could enhance the utility of $BITCOIN in various transaction scenarios. Accessibility: The potential low trading price per token could attract retail investors, facilitating wider participation due to fractional ownership opportunities. Risks Lack of Transparency: The absence of publicly known backers, developers, or an audit process may yield skepticism regarding the project's sustainability and trustworthiness. Market Volatility: The trading activity is heavily reliant on speculative behavior, which can result in significant price volatility and uncertainty for investors. Conclusion DIGITAL GOLD ($BITCOIN) emerges as an intriguing yet ambiguous project within the rapidly evolving Solana ecosystem. While it attempts to leverage the “digital gold” narrative, its departure from Bitcoin's established role as a store of value underscores the need for a clearer differentiation of its intended utility and governance structure. Future acceptance and adoption will likely depend on addressing the current opacity and defining its operational and economic strategies more explicitly. Note: This report encompasses synthesised information available as of October 2023, and developments may have transpired beyond the research period.

396 Total ViewsPublished 2025.05.13Updated 2025.05.13

What is $BITCOIN

Discussions

Welcome to the HTX Community. Here, you can stay informed about the latest platform developments and gain access to professional market insights. Users' opinions on the price of BTC (BTC) are presented below.

活动图片