Rented Conviction: How Much Real Money Is Behind the Bitcoin ETF Flows

marsbitPublished on 2026-06-22Last updated on 2026-06-22

Abstract

Borrowed Belief: How much of Bitcoin ETF flows are real money? Weekly Bitcoin ETF flows, often interpreted as a measure of institutional conviction, are heavily influenced by a hidden arbitrage trade rather than genuine directional buying. A cash-and-carry arbitrage, where traders buy the ETF while simultaneously shorting Bitcoin futures on the CME to lock in a basis spread (the price difference between futures and spot), drives roughly half of the week-to-week flow volatility. This delta-neutral activity appears as ETF inflows but is unrelated to price views. Data shows a strong correlation (0.70) between weekly ETF inflows and increases in hedge fund short positions on CME futures, while Bitcoin’s weekly price returns have almost no explanatory power. However, this arbitrage activity dominates short-term *fluctuations*, not the cumulative *stock* of investments. Of the total ~$55 billion in net ETF inflows since launch, only about $1 billion currently represents net arbitrage exposure. The vast majority consists of steady, directional buying averaging around $400 million per week. The arbitrage trade has been unwinding for two years, with hedge fund short positions peaking near $14 billion in late 2024 and declining to ~$4.5 billion. Recent ETF outflows partly reflect this ongoing unwind as the basis compresses, not a loss of faith in Bitcoin. Thus, ETF flows overstate the *volatility* of belief, not its *level*. The headline number is more a gauge of arbitrage ...

Author: Darko, IOSG

ETF fund flows are often viewed as a "thermometer" of institutional big money's confidence in Bitcoin. But viewed week by week, they measure something else more: a hidden interest rate trade being turned on and off repeatedly. This article explains how to identify it, how large this trade really is, and why it is quietly unwinding.

TL;DR

  1. Week to week, ETF flows are driven primarily by a hidden arbitrage trade, not conviction. Cash-and-carry arbitrageurs buy ETFs while simultaneously shorting futures on the CME, hedging away price risk, but appear indistinguishable from genuine bulls in the data. About half of the weekly flow volatility can be explained by the single variable of new hedge fund futures shorts, with a correlation of 0.70.

  2. Bitcoin's weekly price change explains almost none of the flows. Using price returns to predict ETF flows yields a result statistically indistinguishable from zero. Weekly flows are not chasing price performance; they move in sync with a hedged interest rate trade.

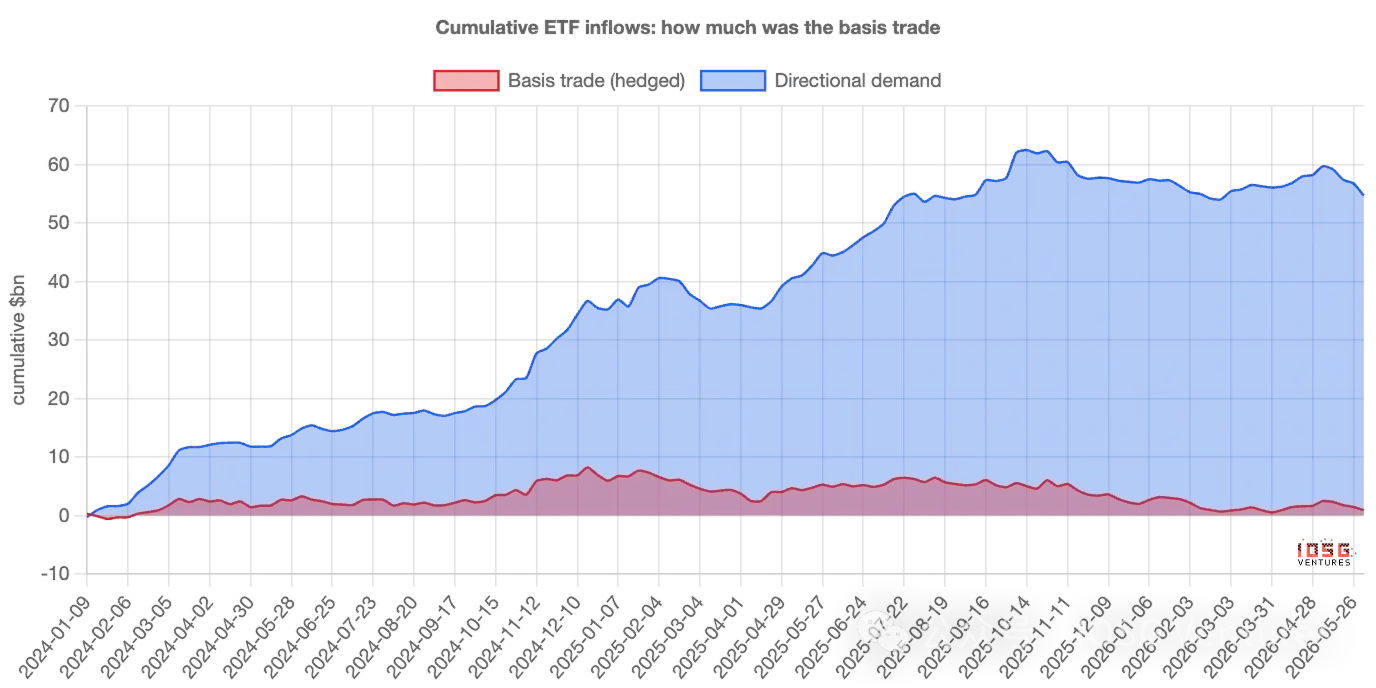
  3. Arbitrage dominates the weekly "volatility," but never the bulk of the "stock." Of the roughly $55 billion cumulatively flowed into ETFs, the arbitrage trade currently represents a net balance of only about $1 billion; the rest is stable, directional buying, averaging about $400 million per week, which compounded over two years constitutes nearly the entire "mountain."

  4. The correct statement is: ETF flows overstate the "volatility" of conviction, not its "level." The weekly ups and downs are mostly "rented"—arbitrage capital coming and going; while the assets that truly settle are mostly "owned."

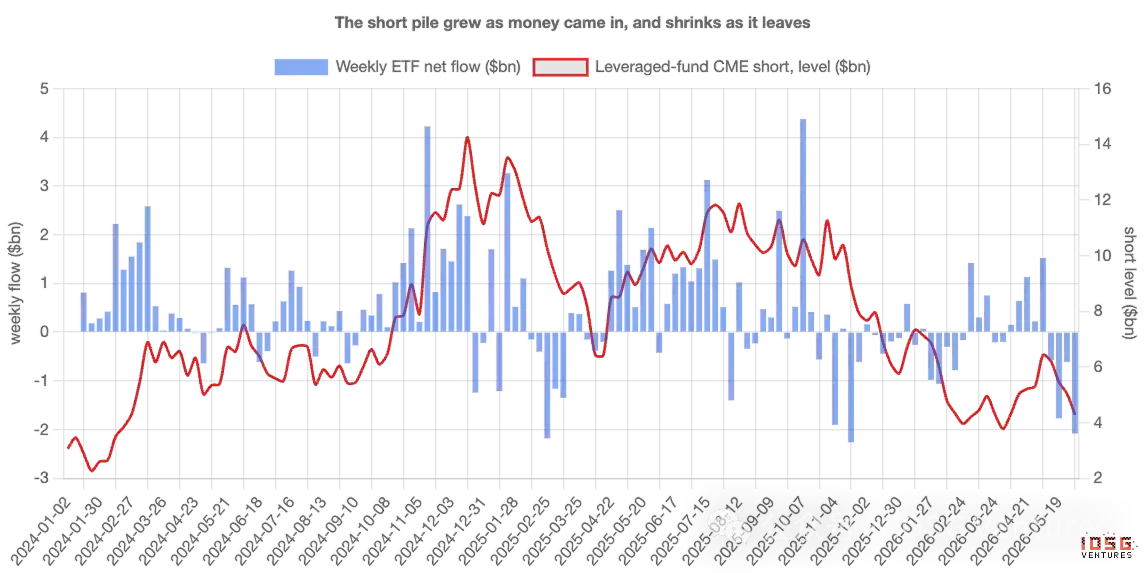
  5. This trade is unwinding, and has been for two years. Leveraged funds' short positions grew from about $3 billion at launch to about $14 billion by late 2024, before steadily retreating to about $4.5 billion. Once the basis compresses to unprofitability, inflows and shorts retreat together—don't mistake the resulting outflows as the market passing judgment on Bitcoin.

I. That Number Everyone Watches

Every week, Bitcoin ETF ETF flows—how much money comes in or goes out—are published, and this number is often treated as a verdict. Large inflows mean institutions are piling in; outflows signal shaken confidence. Flow data has quietly become the market's headline metric for measuring faith.

The problem is, not everyone buying an ETF is betting on Bitcoin. Some of the biggest buyers don't care which way the price goes—and once you account for them, the weekly flow number measures their activity more than anyone's belief. To understand why, you first need to meet a completely different kind of buyer.

A Buyer Who Doesn't Care About Price

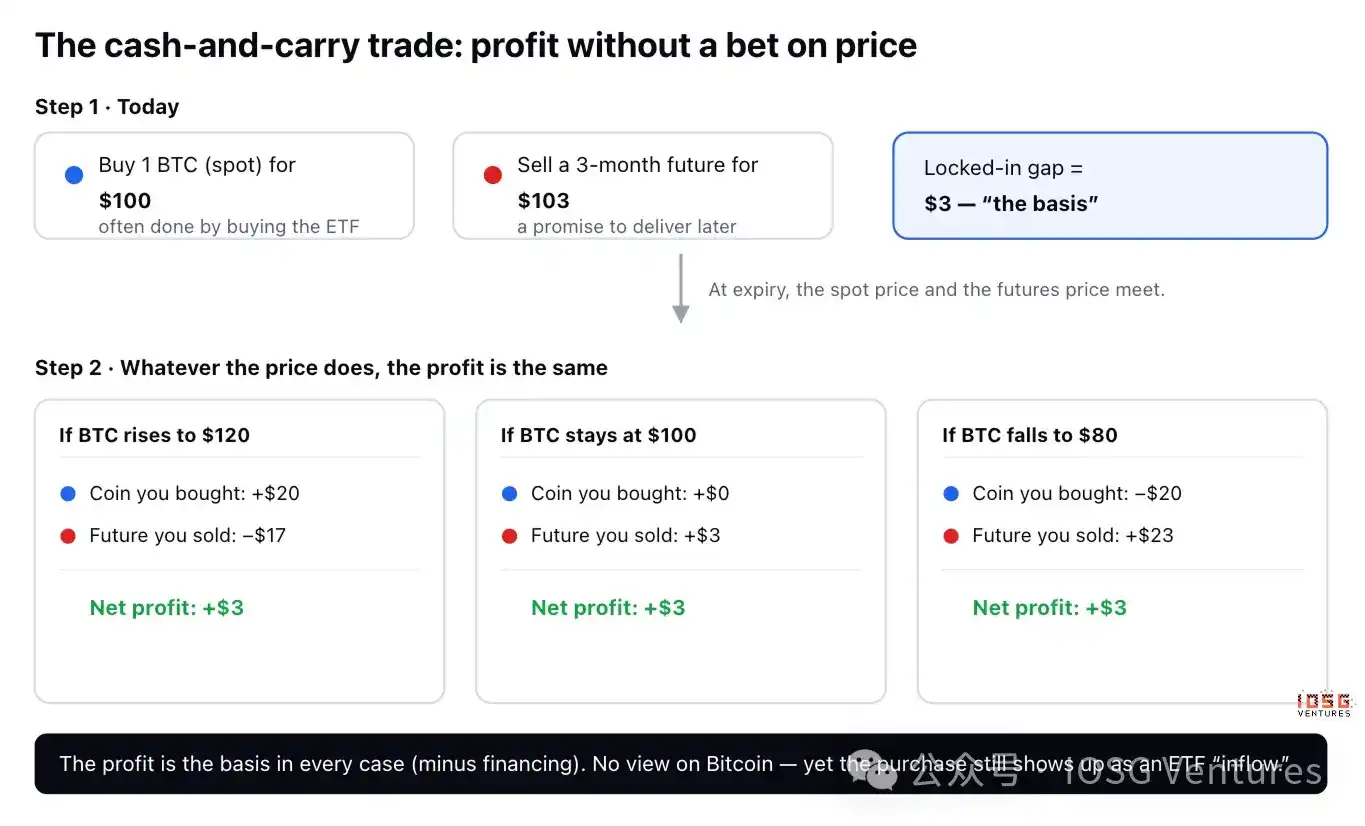
There is a classic, boring trade called cash-and-carry arbitrage. A Bitcoin "futures" contract is just an agreement to buy or sell Bitcoin at a set price on a future date, and most of the time, the futures price trades a bit above the current spot price—say Bitcoin is $100 now, but a contract expiring in three months sells for $103.

A trader can pocket that $3 difference without having any view on price:

  • Buy 1 Bitcoin today for $100 (often done by buying the ETF).

  • Sell a futures contract for $103, promising to deliver in three months.

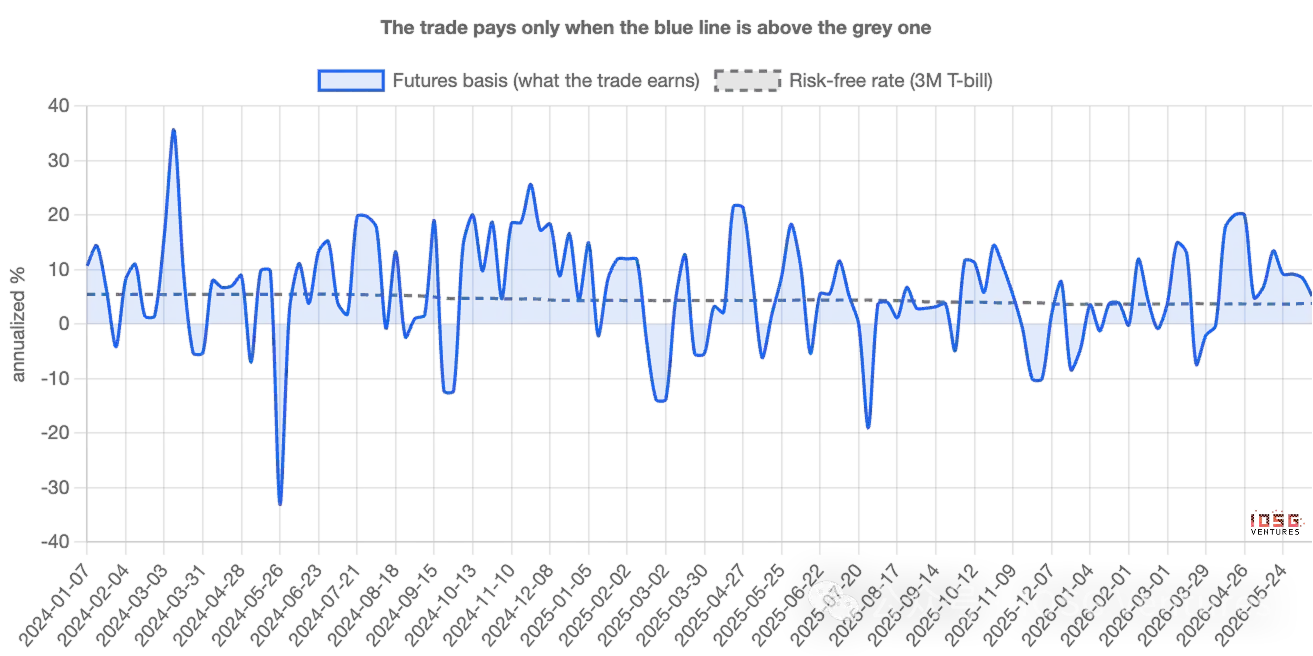
See what happens at expiration. If Bitcoin surges to $120, the trader makes $20 on the coin but loses $17 on the contract—a net gain of $3. If it crashes to $80, they lose $20 on the coin but make $23 on the contract—still a net gain of $3. If it stays flat, still $3. In every scenario, the profit is the same. The direction is hedged away; traders call this "delta neutral." This $3 price difference, expressed as an annualized rate, is the basis—essentially an interest rate earned for parking capital in this trade; it's worth doing as long as it exceeds the risk-free return one could get putting money in US Treasury bills (T-bills).

Why This Pollutes the Headline Number

The key is here. The first leg—buying 1 Bitcoin—is very commonly done by buying the ETF. Therefore, a trader with no view on Bitcoin, running delta neutral, appears in the data as an ETF inflow, indistinguishable on the surface from a true believer.

When lots of cash-and-carry is being set up, inflows look robust, and the narrative of "institutions are loading up" writes itself—even though these funds are hedged and will reverse the moment the trade ceases to be profitable. In other words, the flow number measures not just faith; it measures the activity of arbitrage desks. The challenge is separating the two—and how big each actually is.

How to Tell Them Apart

Cash-and-carry traders leave a second footprint. For every $1 of Bitcoin they buy, they short $1 of futures on the CME (the regulated US exchange where institutions trade Bitcoin futures). True believers leave only the first footprint; arbitrageurs leave both.

And the second footprint is public. The US derivatives regulator publishes a weekly report disclosing the size of long and short positions held by various trader types on the CME. One category—leveraged funds, essentially hedge funds—is precisely where the cash-and-carry crowd congregates. So you can take, week by week, the money flowing into ETFs and line it up against the new short positions these funds establish. If "demand" were truly conviction, the two shouldn't be closely linked; if a big chunk is that hidden trade, they should move together.

II. What the Data Says: Week to Week, Flows Follow Futures,Not Price

They move tightly together. Every single week since the ETFs launched, the weeks that saw more new futures shorting also saw more ETF inflows—almost one for one. About half of all weekly flow volatility can be explained by this single thing: how much shorting funds did. The correlation is 0.70, the kind of strength you see between two things that are clearly related, not coincidental.

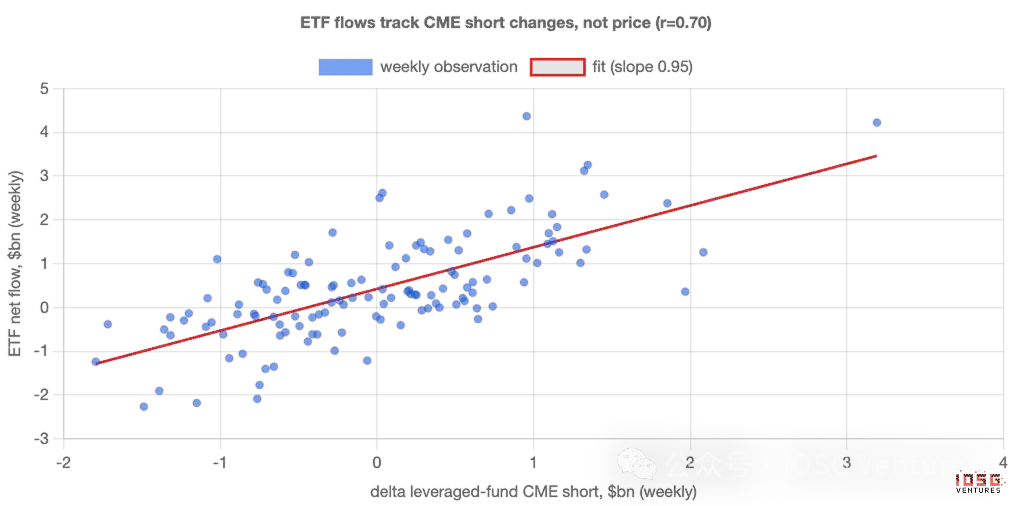
The point that should most unsettle believers: price itself explains almost nothing. Testing whether weekly Bitcoin returns predict ETF flows yields an answer statistically indistinguishable from zero. Weekly money is not chasing performance; it moves in lockstep with a hedged interest rate trade.

So, as a weekly signal, ETF "demand" is mostly arbitrage. The flow number is a poor thermometer for faith because its gyrations are the result of a basis trade being switched on and off, not anyone changing their mind about Bitcoin.

But How Much of the Money Is This Trade?

This is where the simplistic narrative—"it's all fake"—falls apart, and the real story gets more interesting. The basis trade dominates weekly volatility, but it never was the bulk of the stock of money.

Breaking weekly inflows into the part explained by futures shorts (hedged) and the rest (directional), and accumulating since launch: of the roughly $55 billion cumulatively flowed into ETFs, the basis trade currently represents a net balance of only about $1 billion—the rest is stable, directional buying. This buying averages about $400 million per week, week after week, regardless of basis or price, and compounded over two years, it is nearly the entire mountain.

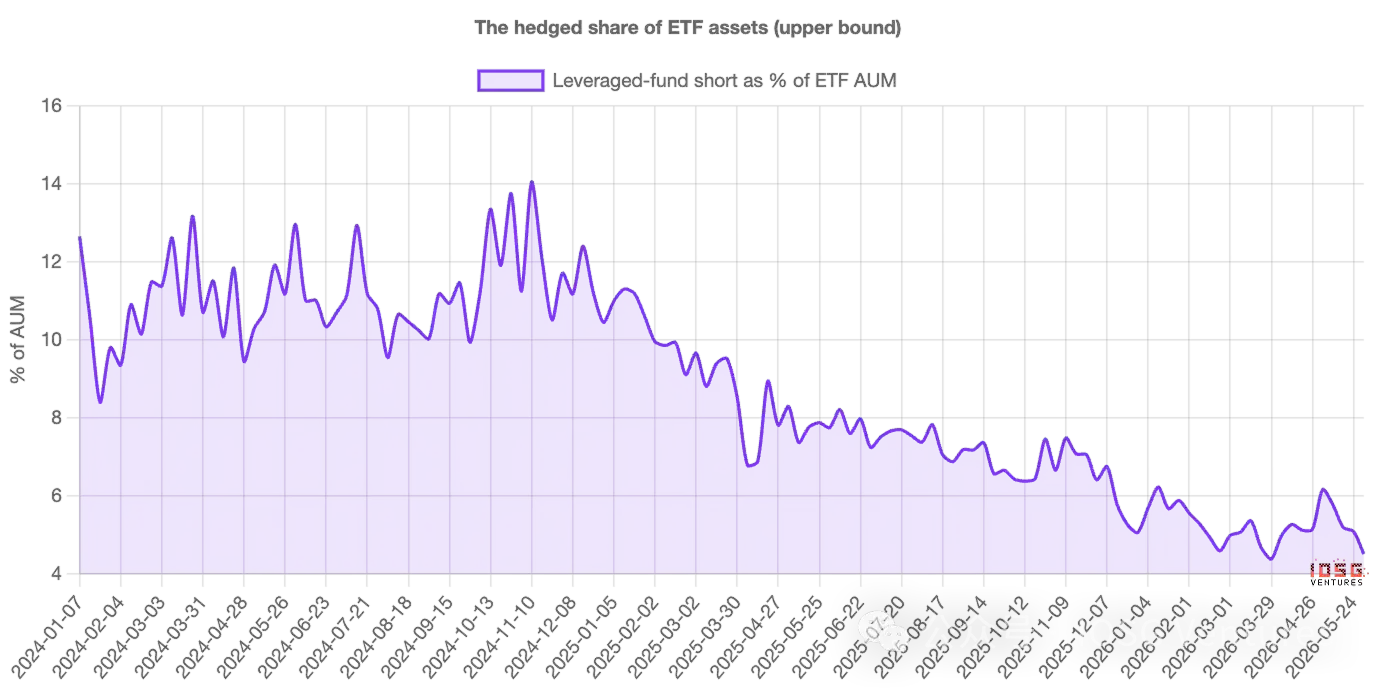
Looking at asset share rather than flows, the picture is the same: the hedged portion once neared 14% of ETF assets in 2024, and is now about 4%-5%. At its peak, it was a non-negligible minority; now it's a sliver.

So, the more precise statement is: ETF flows overstate the volatility of conviction, not its level. The weekly ups and downs are mostly "rented"—arbitrage capital coming and going; but the assets that truly settle are mostly "owned." This trade churns through the flow data but was never the bulk of the balance.

And This Trade Is Unwinding

The hedged portion hasn't just always been small—it has been shrinking for two years. Leveraged funds' short positions grew from about $3 billion at launch to about $14 billion by late 2024, before steadily retreating to about $4.5 billion. This arbitrage trade has been unwinding across the entire period, not just recently.

This matters for reading the present. Entering June, hedged positions roughly halved again—funds' shorts fell from about $6.4 billion to $4.3 billion—while ETFs saw daily outflows of $300-$500 million. On the surface alone, that looks like panic capitulation. But paired with the futures data, it's just the routine cleanup of an interest rate trade that's no longer profitable. The same outflow number, two very different stories.

When the Basis Compresses, Demand Fades

The cleanest proof is what happens when the trade becomes unprofitable. When that $3 price difference narrows to approach what traders could earn risk-free, the trade isn't worth doing. If a big chunk of weekly demand really is this trade, then weekly demand should weaken precisely when the basis compresses—and it does. Stripping trend from each series and looking at moments around a compression: ETF inflows break below their usual rhythm, and funds simultaneously cover shorts, both moving in sync. Demand breathes with the trade.

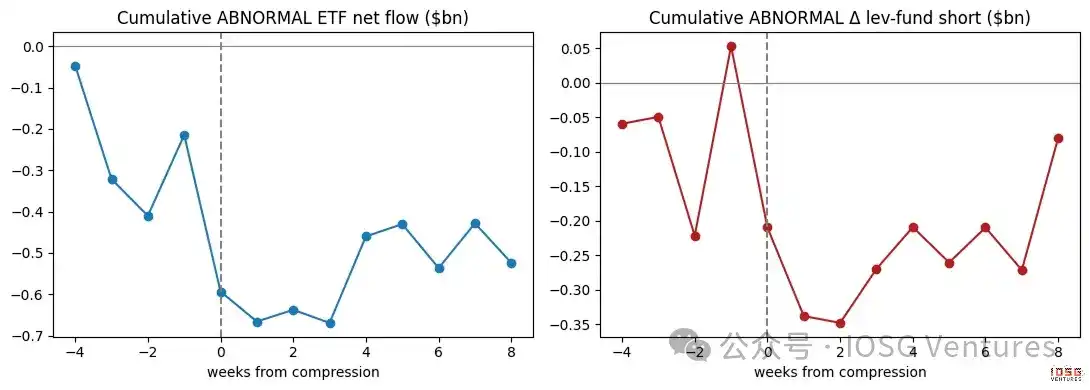
True believers wouldn't care about futures basis. And this weekly "demand" clearly does.

III. Which Comes First, and Who's Really Operating

First, the relationship is contemporaneous—strongest within the same week, with no clear lead or lag; and the slight directional evidence actually points the opposite way: it's ETF flows that seem to drive shorts, not the other way around. This fits the logic of a paired trade: buy the ETF first, and the futures hedge follows, rather than shorting magically "creating" an inflow. Second, the arbitrage crowd isn't the only driver. Flows follow leveraged funds' shorts most tightly, but they also resonate with directional institutional positions—both types of buyers are active. This article's claim is not that every inflow is hedged; rather, the hedged trade is the tightest, most reliable driver of week-to-week volatility.

Ethereum: The Same Trade, But the Math Hardly Works

Applying the same test to Ethereum ETFs reveals the signature, but weaker—a looser link to futures shorting, and that underlying stable directional buy flow is almost nonexistent. The reason is clear. Holding spot Ethereum instead of futures means forgoing the staking yield Ethereum offers, about 3%–4% annually. After netting this out, Ethereum's basis is often negative—the arbitrage trade often can't even clear its hurdle rate. So Ethereum ETFs have neither strong conviction buying nor robust arbitrage positioning to support them; they are just smaller, noisier cousins of Bitcoin's.

IV. How to Read ETF Flows From Now On

The point is not a call on price, but a method for reading flows. When the basis is rich, expect "institutional demand" to look strong, and largely hedged—don't mistake that strength for faith. When the basis compresses, expect inflows and shorts to retreat together—don't mistake the resulting outflows as the market passing judgment on Bitcoin. The two numbers worth watching are: the level of annualized basis returns relative to T-bill rates, and the net short position of leveraged funds in the weekly CME report. They'll tell you how much of the next "demand" headline is real.

How We Measured It

A few honest limitations. The basis is built from the nearest-month CME futures contract versus spot, excluding the final days before each expiry (where its extremely short tenor turns rounding errors into artificial spikes); building series contract by contract sharpens exact numbers but doesn't change conclusions. The link between flows and shorts is a strong contemporaneous relationship, not proof one causes the other—the key is they are two halves of the same trade. The futures short number is an upper bound on the proportion of ETF buying that is hedged, because some shorting hedges coins held elsewhere.

None of this changes the main story. Week to week, Bitcoin ETF "demand" is primarily a hidden interest rate trade, not faith—flows measure the activity of those arbitraging far more accurately than they measure belief. And that real buy flow is real, patient, and now the vast majority of what remains, because the "rented" part has been going home for two years.

Trending Cryptos

Related Questions

QWhat does the article argue is the primary driver of week-to-week Bitcoin ETF flow fluctuations, rather than genuine conviction?

AThe article argues that week-to-week Bitcoin ETF flow fluctuations are primarily driven by a cash-and-carry arbitrage trade, not genuine investor conviction. This trade involves buying the ETF while simultaneously shorting Bitcoin futures to lock in a spread, creating delta-neutral inflows that are indistinguishable from directional buys in the data. About half of the weekly flow volatility is explained by changes in hedge fund short futures positions.

QWhat two key data points does the author suggest investors should watch to better interpret the 'true' demand behind Bitcoin ETF flow headlines?

AThe author suggests investors should watch two key data points: 1) The level of the annualized basis (the futures premium) relative to the U.S. Treasury bill (T-bill) rate, and 2) The net short positions of leveraged funds reported weekly by the CFTC in its Commitments of Traders report for CME Bitcoin futures.

QHow does the article characterize the role of cash-and-carry trades in the *cumulative* amount of money that has flowed into Bitcoin ETFs since launch?

AThe article states that while cash-and-carry trades drive week-to-week *volatility* in flows, they have never been the main component of the cumulative *stock* of money. Out of the total cumulative inflow of approximately $55 billion, the net amount from arbitrage trades is only about $1 billion. The vast majority is stable, directional buying, averaging about $400 million per week, which has compounded over two years to form almost the entire 'mountain' of assets.

QWhat is the key difference in the dynamics of Ethereum ETF flows compared to Bitcoin ETF flows, according to the article?

AThe key difference is that the same arbitrage dynamic is much weaker for Ethereum ETFs. The correlation with futures shorts is looser, and the underlying steady directional buy flow is almost non-existent. This is because holding spot Ethereum (via an ETF) means forgoing staking rewards (approx. 3-4% annually), which often makes the effective basis negative, rendering the cash-and-carry trade unprofitable from the start.

QWhen the basis (futures premium) compresses towards the risk-free rate, what does the article predict will happen to ETF flows and futures short positions, and how should this be interpreted?

AThe article predicts that when the basis compresses to a level no longer profitable relative to the risk-free rate, ETF inflows will weaken and leveraged funds will simultaneously cover (reduce) their short futures positions. This should not be interpreted as a loss of conviction or a market judgment on Bitcoin, but rather as the routine unwinding of a hedged interest rate trade that is no longer worthwhile.

Related Reads

After Missing the 20x, I've Found a 'Dumb' Method for AI Investing

**Missing the 20x Opportunity: A Simple 'Dumb' Approach to AI Investing** The AI boom, driving NVIDIA's revenue from $60B to $216B in two years, creates immense investment pressure. However, like the internet bubble of 2000, the largest AI opportunities likely lie ahead, perhaps after a correction. Instead of rushing in now or waiting paralyzed for a crash, the author proposes a third way: building a "knowledge warehouse" by systematically mapping the AI industry to be ready when opportunities arise. The core of the strategy is understanding AI's four-layer value chain: 1. **Compute Infrastructure (The "Engine"):** This foundational layer, where all money eventually flows, includes: a) **Chip Design:** NVIDIA's dominance via its CUDA ecosystem, b) **Chip Manufacturing/Packaging/Memory:** TSMC's near-monopoly in advanced manufacturing and SK Hynix's lead in High Bandwidth Memory (HBM), c) **Optical Interconnects:** Essential for large-scale AI clusters (e.g., Lumentum, Coherent), d) **Cooling & Power:** Critical for high-density AI data centers (e.g., Vertiv), e) **Servers/Data Centers & Cloud Platforms:** The physical and virtual wholesale providers. 2. **Models & Tools (The "OS"):** The competitive layer of foundation models (OpenAI, Anthropic, Google, Meta, xAI), now generating real revenue. A key shift is the center of gravity moving from **Training** models to **Inference** (running models), which demands different chip characteristics and could challenge NVIDIA's monopoly. 3. **Middleware & Platform ("The Glue"):** Connects models and applications (e.g., Scale AI, Hugging Face). This layer could explode if applications take off. 4. **Vertical Applications ("The Cash Register"):** Where AI meets end-users (e.g., enterprise AI, coding tools, medical AI, robotics). A critical cross-cutting constraint is **Energy**, as AI's massive power consumption drives investment in nuclear and other energy infrastructure. The author identifies four key questions for further research: 1) How will the shift from Training to Inference reshape the competitive landscape? 2) With tech giants spending over $600B on capex, where is the ROI from AI applications? 3) What are the under-the-radar opportunities in the "second" and "third" circles of the value chain (e.g., cooling, specialty foundries)? 4) How will geopolitics (e.g., U.S.-China chip restrictions) bifurcate the supply chain? The conclusion is that missed opportunities stem from insufficient research, not slow timing. By methodically studying each layer—its business models, competition, and valuations—investors can build the "killer intuition" needed to act decisively when the market presents its chance.

marsbit5m ago

After Missing the 20x, I've Found a 'Dumb' Method for AI Investing

marsbit5m ago

Rented Faith: How Much of the Bitcoin ETF Inflows Is Real Money?

"Rented Conviction: How Much of Bitcoin ETF Flows Is Real Money" The weekly inflows into Bitcoin ETFs are often interpreted as a gauge of institutional belief. However, a significant portion of this activity is driven by a hidden arbitrage trade, not directional conviction. The core mechanism is a cash-and-carry arbitrage: traders buy spot Bitcoin (often via ETFs) while simultaneously shorting CME futures to lock in the price difference, or "basis." This delta-neutral trade is essentially an interest rate play. In weekly data, about half the fluctuation in ETF flows can be explained by new short positions added by leveraged funds (hedge funds), with a correlation of 0.70. Bitcoin's price movement in a given week shows no statistical power in predicting these flows. While this arbitrage trade drives weekly *volatility*, it is not the main component of the cumulative *stock*. Of the total ~$55 billion in net ETF inflows, the current net arbitrage position is only about $1 billion. The remainder is steady, directional buying averaging ~$400 million per week, which constitutes the vast majority of the accumulated "mountain" over two years. Thus, ETF flow data overstates the *volatility* of conviction, not its *level*. This arbitrage trade has been unwinding for nearly two years. Leveraged fund short positions peaked at ~$14 billion in late 2024 and have since declined to ~$4.5 billion. When the basis compresses to unprofitable levels, ETF inflows and short positions retreat together. Recent outflows should not be mistaken for a loss of faith but rather the routine unwinding of this rate trade. For Ethereum ETFs, the pattern is weaker. Accounting for staking yield makes the basis often negative, so neither strong conviction buying nor robust arbitrage supports its flows. To interpret ETF flows correctly, monitor the CME basis versus T-bill rates and leveraged fund net shorts. They reveal how much of the next "demand" headline is real. The real, patient buy-and-hold demand is what constitutes the enduring bulk of ETF assets.

marsbit52m ago

Rented Faith: How Much of the Bitcoin ETF Inflows Is Real Money?

marsbit52m ago

Soaring Over Tenfold Within the Year: The Frenzy Over SK Hynix Leveraged Products

South China Morning Post The leveraged ETF tracking SK Hynix has surged over tenfold year-to-date, fueled by intense market speculation on the memory chip sector. By June 22, the value of the 'South Korea 2x Long SK Hynix ETF' listed in Hong Kong had skyrocketed by more than 1,061% since the start of the year, while its asset size exploded over twenty times from the end of last year. The rally is driven by AI-driven demand for high-bandwidth memory (HBM), with SK Hynix recently sampling its next-generation HBM4E product. However, industry professionals warn of significant risks. Leveraged ETFs magnify both gains and losses. During a recent market correction, while the underlying SK Hynix stock fell 19.1%, its double-leveraged ETF dropped nearly 38%. Korean regulators noted that such products could theoretically lose 60% in a single day. Additionally, these ETFs face risks like time decay in volatile markets, liquidity spirals during mass redemptions, and extreme price dislocations from market-making failures, as seen in early June when an ETF moved opposite to its underlying stock. The trading is predominantly driven by retail investors, with institutional capital largely absent due to the products' high volatility. Analysts caution that with the semiconductor sector at elevated valuations and facing geopolitical and supply chain uncertainties, leveraged ETFs pose a substantial threat of amplified losses for uninformed investors.

marsbit1h ago

Soaring Over Tenfold Within the Year: The Frenzy Over SK Hynix Leveraged Products

marsbit1h ago

Trading

Spot
Futures

Hot Articles

What is $BITCOIN

DIGITAL GOLD ($BITCOIN): A Comprehensive Analysis Introduction to DIGITAL GOLD ($BITCOIN) DIGITAL GOLD ($BITCOIN) is a blockchain-based project operating on the Solana network, which aims to combine the characteristics of traditional precious metals with the innovation of decentralized technologies. While it shares a name with Bitcoin, often referred to as “digital gold” due to its perception as a store of value, DIGITAL GOLD is a separate token designed to create a unique ecosystem within the Web3 landscape. Its goal is to position itself as a viable alternative digital asset, although specifics regarding its applications and functionalities are still developing. What is DIGITAL GOLD ($BITCOIN)? DIGITAL GOLD ($BITCOIN) is a cryptocurrency token explicitly designed for use on the Solana blockchain. In contrast to Bitcoin, which provides a widely recognized value storage role, this token appears to focus on broader applications and characteristics. Notable aspects include: Blockchain Infrastructure: The token is built on the Solana blockchain, known for its capacity to handle high-speed and low-cost transactions. Supply Dynamics: DIGITAL GOLD has a maximum supply capped at 100 quadrillion tokens (100P $BITCOIN), although details regarding its circulating supply are currently undisclosed. Utility: While precise functionalities are not explicitly outlined, there are indications that the token could be utilized for various applications, potentially involving decentralized applications (dApps) or asset tokenization strategies. Who is the Creator of DIGITAL GOLD ($BITCOIN)? At present, the identity of the creators and development team behind DIGITAL GOLD ($BITCOIN) remains unknown. This situation is typical among many innovative projects within the blockchain space, particularly those aligning with decentralized finance and meme coin phenomena. While such anonymity may foster a community-driven culture, it intensifies concerns about governance and accountability. Who are the Investors of DIGITAL GOLD ($BITCOIN)? The available information indicates that DIGITAL GOLD ($BITCOIN) does not have any known institutional backers or prominent venture capital investments. The project seems to operate on a peer-to-peer model focused on community support and adoption rather than traditional funding routes. Its activity and liquidity are primarily situated on decentralized exchanges (DEXs), such as PumpSwap, rather than established centralized trading platforms, further highlighting its grassroots approach. How DIGITAL GOLD ($BITCOIN) Works The operational mechanics of DIGITAL GOLD ($BITCOIN) can be elaborated on based on its blockchain design and network attributes: Consensus Mechanism: By leveraging Solana’s unique proof-of-history (PoH) combined with a proof-of-stake (PoS) model, the project ensures efficient transaction validation contributing to the network's high performance. Tokenomics: While specific deflationary mechanisms have not been extensively detailed, the vast maximum token supply implies that it may cater to microtransactions or niche use cases that are still to be defined. Interoperability: There exists the potential for integration with Solana’s broader ecosystem, including various decentralized finance (DeFi) platforms. However, the details regarding specific integrations remain unspecified. Timeline of Key Events Here is a timeline that highlights significant milestones concerning DIGITAL GOLD ($BITCOIN): 2023: The initial deployment of the token occurs on the Solana blockchain, marked by its contract address. 2024: DIGITAL GOLD gains visibility as it becomes available for trading on decentralized exchanges like PumpSwap, allowing users to trade it against SOL. 2025: The project witnesses sporadic trading activity and potential interest in community-led engagements, although no noteworthy partnerships or technical advancements have been documented as of yet. Critical Analysis Strengths Scalability: The underlying Solana infrastructure supports high transaction volumes, which could enhance the utility of $BITCOIN in various transaction scenarios. Accessibility: The potential low trading price per token could attract retail investors, facilitating wider participation due to fractional ownership opportunities. Risks Lack of Transparency: The absence of publicly known backers, developers, or an audit process may yield skepticism regarding the project's sustainability and trustworthiness. Market Volatility: The trading activity is heavily reliant on speculative behavior, which can result in significant price volatility and uncertainty for investors. Conclusion DIGITAL GOLD ($BITCOIN) emerges as an intriguing yet ambiguous project within the rapidly evolving Solana ecosystem. While it attempts to leverage the “digital gold” narrative, its departure from Bitcoin's established role as a store of value underscores the need for a clearer differentiation of its intended utility and governance structure. Future acceptance and adoption will likely depend on addressing the current opacity and defining its operational and economic strategies more explicitly. Note: This report encompasses synthesised information available as of October 2023, and developments may have transpired beyond the research period.

431 Total ViewsPublished 2025.05.13Updated 2025.05.13

What is $BITCOIN

Discussions

Welcome to the HTX Community. Here, you can stay informed about the latest platform developments and gain access to professional market insights. Users' opinions on the price of BTC (BTC) are presented below.

活动图片