Price predictions 12/19: BTC, ETH, BNB, XRP, SOL, DOGE, ADA, BCH, HYPE, LINK

cointelegraphPublished on 2025-12-19Last updated on 2025-12-19

Abstract

Bitcoin is attempting a recovery from the $84,000 support level, though bears continue to sell on rallies. Analysts suggest BTC could face resistance near $94,589, with downside risk toward $80,600 if selling persists. Ether is rebounding from $2,700 but may struggle near the $3,161–$3,450 resistance zone. Bitcoin Cash shows strength, holding above its 50-day SMA, with a potential rally to $720 if it breaks $615. Other altcoins like BNB, XRP, SOL, DOGE, ADA, HYPE, and LINK are facing near-term bearish pressure, with key support levels critical to avoid further declines. Market sentiment remains cautious amid mixed signals from macroeconomic events and analyst projections.

Key points:

  • Bitcoin is attempting a recovery from the $84,000 level, but the bears continue to sell on rallies.

  • Several major altcoins are struggling to start a recovery, but Bitcoin Cash looks strong in the near term.

Bitcoin (BTC) rose above $89,000 after the Bank of Japan (BoJ) hiked its rates to around 0.75% on Friday, but the bulls are struggling to hold onto the higher levels. Although a BoJ rate hike is generally considered negative for risk assets, BitMEX co-founder Arthur Hayes told his X followers not to fight the BoJ as negative real rates was the explicit policy. Hayes projected the dollar/yen to reach the 200 level and “BTC to a milly.”

While the long-term picture remains bullish, the near-term remains uncertain. The big question on investors’ minds is whether the rallies should be sold into or is this a good buying opportunity. Fidelity director of global macroeconomic research Jurrien Timmer said in a post on X that BTC may have topped out at $125,000, marking the end of its four-year cycle halving phase. He expects BTC to witness an off-year in 2026, with support in the $65,000 to $75,000 zone.
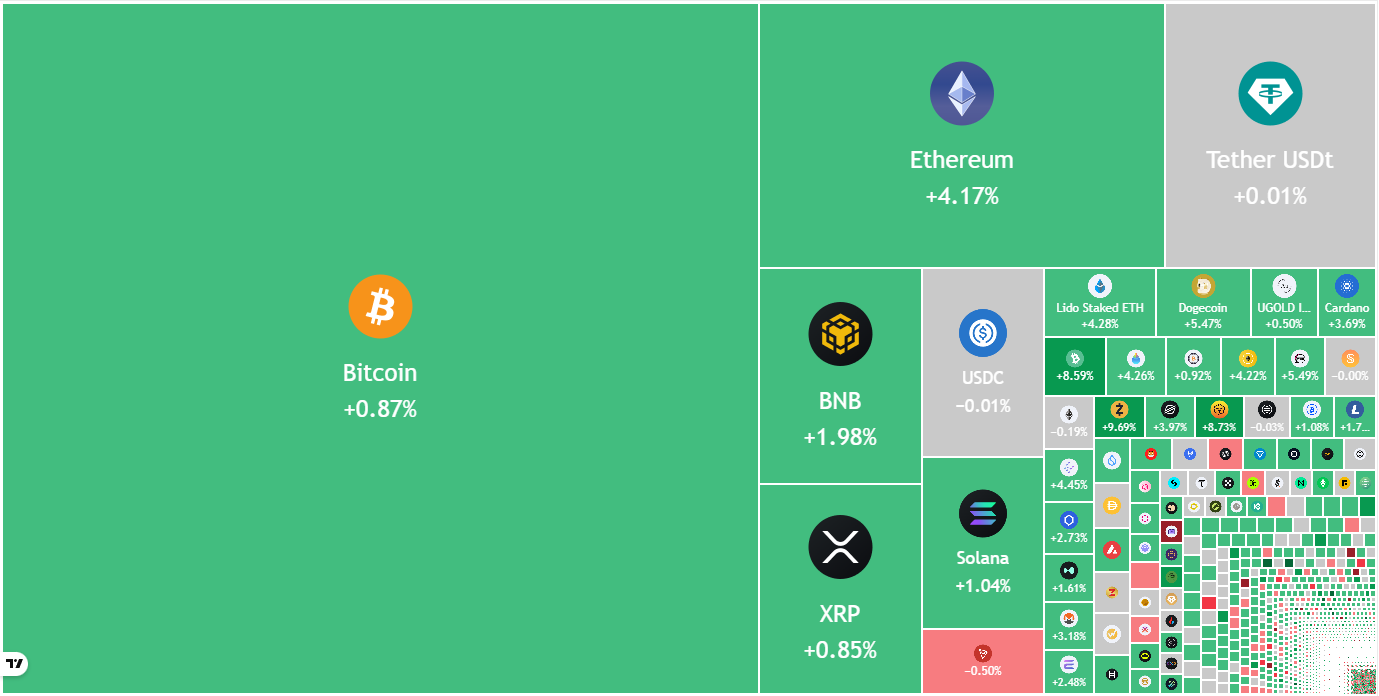
Crypto market data daily view. Source: TradingView

In another projection for 2026, Tether CEO Paolo Ardoino said that BTC might not witness “sharp corrections of 80%, like we saw in 2022 or early 2018.” However, he added that BTC could be impacted by the so-called AI bubble due to its close correlation with the capital markets.

What are the crucial support and resistance levels to watch out for in BTC and major altcoins? Let’s analyze the charts of the top 10 cryptocurrencies to find out.

Bitcoin price prediction

Buyers are attempting to defend the $84,000 support, but the recovery is expected to face selling at the moving averages.
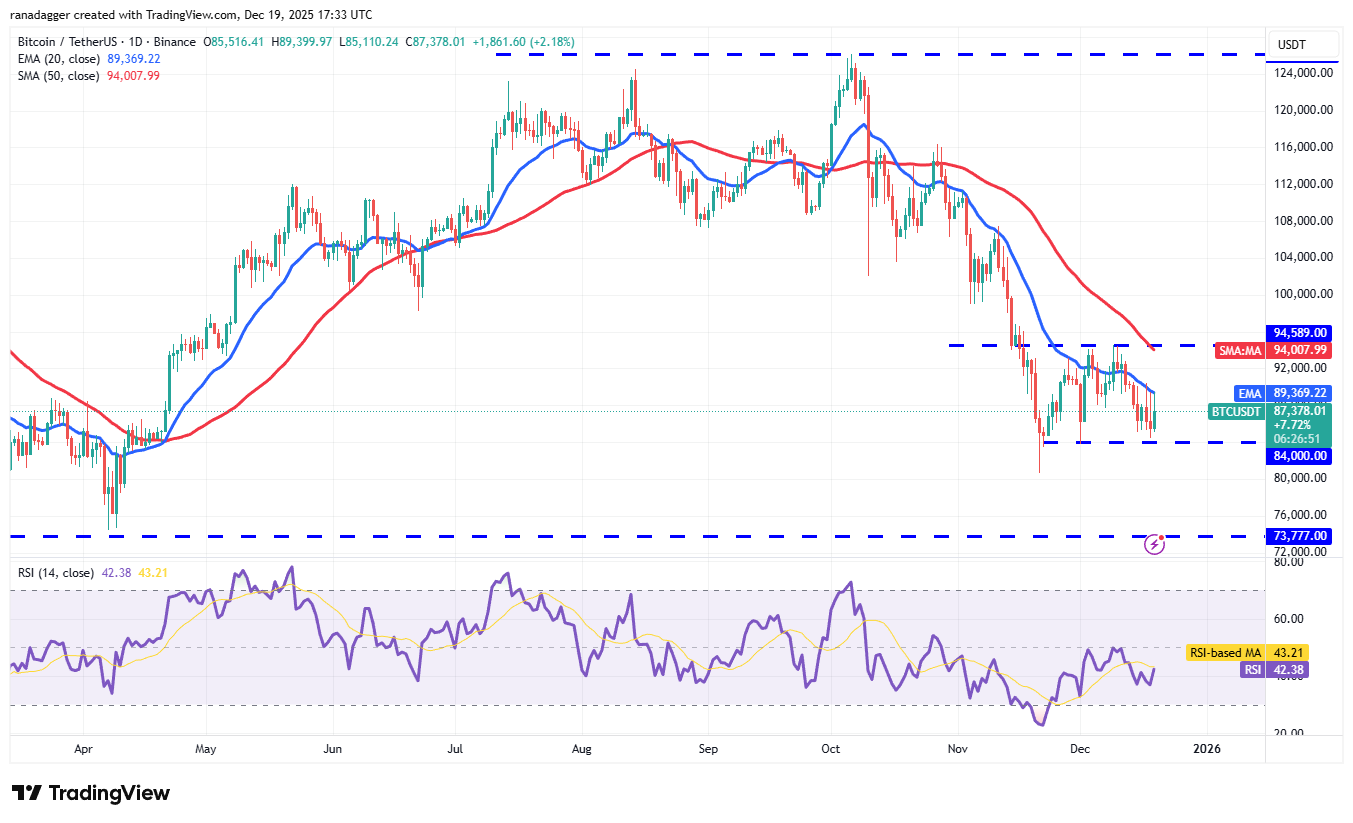
BTC/USDT daily chart. Source: Cointelegraph/TradingView

The downsloping 20-day exponential moving average ($89,369) and the relative strength index (RSI) in the negative territory suggest that bears have a slight edge. If the price turns down sharply from the 20-day EMA, the likelihood of a break below $84,000 increases. The BTC/USDT pair may then slump to $80,600.

Buyers will have to drive and maintain the Bitcoin price above the $94,589 resistance to signal a potential trend change in the near term. The pair could then rally to $100,000 and subsequently to $107,500.

Ether price prediction

Ether (ETH) is attempting a relief rally from the support near $2,700, indicating buying on dips.
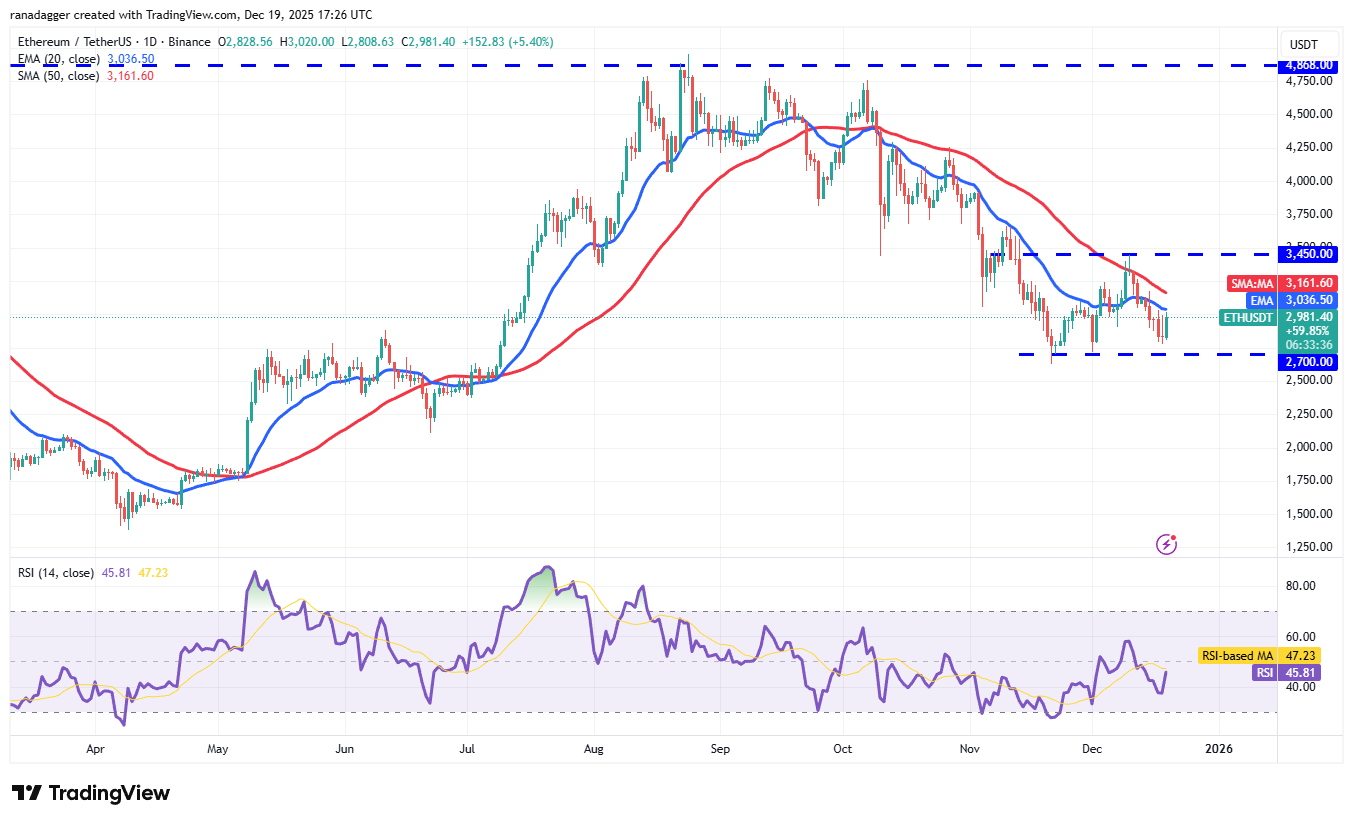
ETH/USDT daily chart. Source: Cointelegraph/TradingView

The bears are unlikely to give up easily and will fiercely defend the zone between the 50-day SMA ($3,161) and $3,450. If the Ether price turns down sharply from the overhead resistance, the ETH/USDT pair could retest the $2,700 to $2,623 support zone. If the zone breaks down, the pair may plummet to $2,250.

This negative view will be invalidated in the near term if the price turns up and breaks above the $3,450 resistance. The pair could then ascend to $3,918.

BNB price prediction

BNB (BNB) is attempting to bounce off the uptrend line, but higher levels are likely to attract sellers.
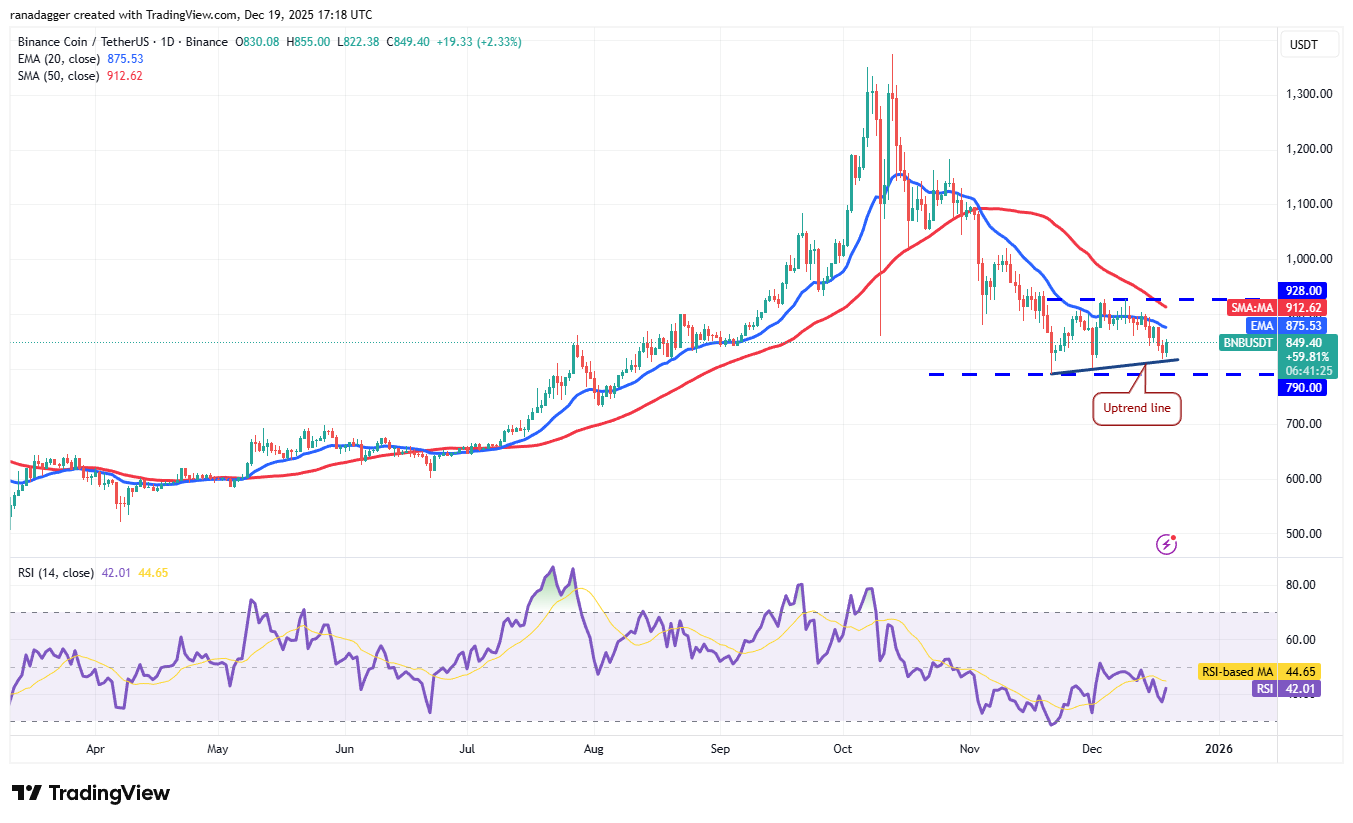
BNB/USDT daily chart. Source: Cointelegraph/TradingView

If the BNB price turns down sharply from the moving averages, the possibility of a drop to the $790 support increases. Buyers are expected to defend the $790 level with all their might, as a break below it could sink the BNB/USDT pair to $730.

On the contrary, a break and close above the $928 resistance will complete an ascending triangle pattern. That suggests the corrective phase has ended, opening the gates for a rally to the target objective of $1,066.

XRP price prediction

XRP (XRP) is attempting to bounce off the support line of the descending channel pattern, indicating demand at lower levels.
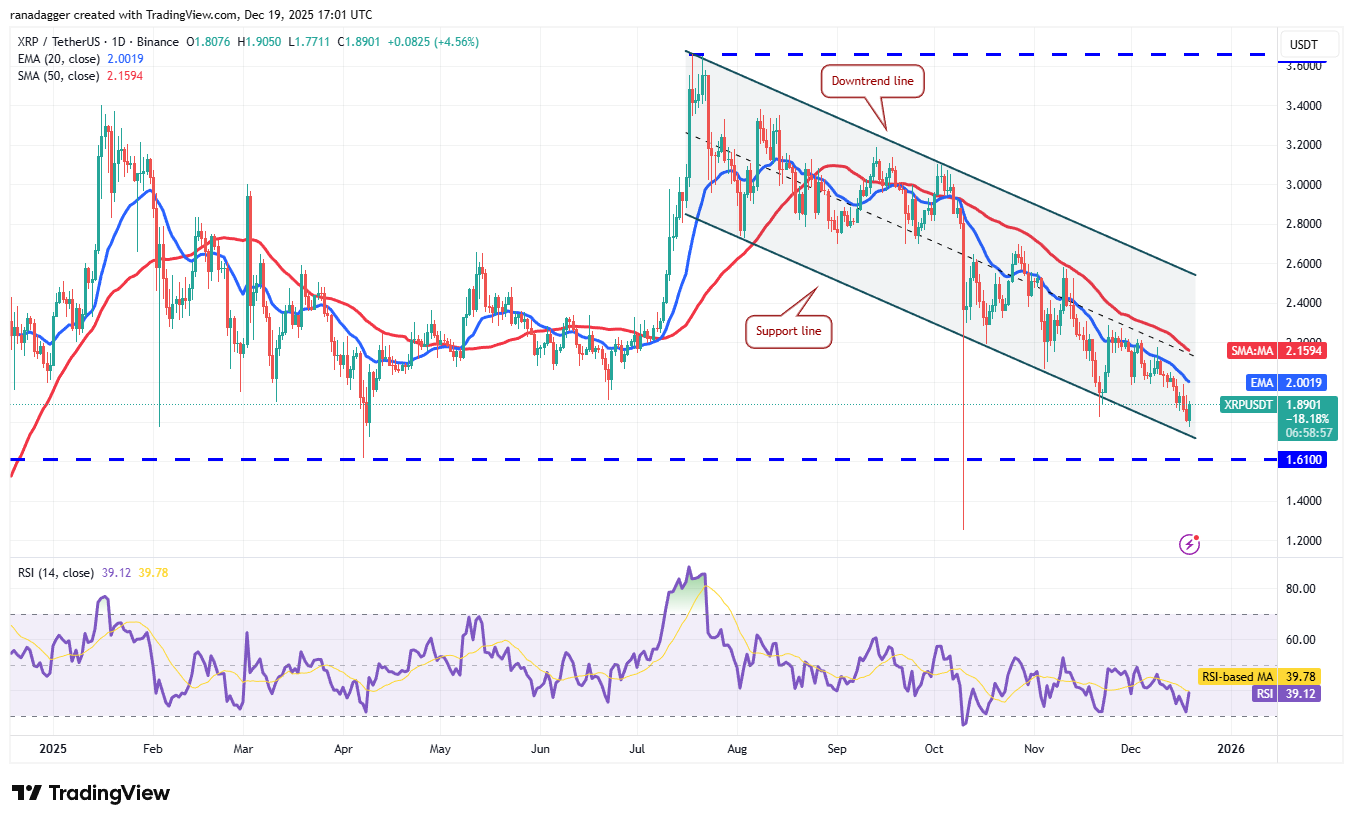
XRP/USDT daily chart. Source: Cointelegraph/TradingView

The downsloping moving averages and the RSI in the negative territory indicate an advantage to bears. If the price turns down from the moving averages, the bears will try to sink the XRP/USDT pair to the $1.61 support.

Instead, if the XRP price continues higher and breaks above the 50-day SMA ($2.15), it suggests that the pair may remain inside the channel for some more time. The bulls will gain the upper hand on a close above the downtrend line.

Solana price prediction

Solana (SOL) fell below the $121 level on Thursday, but the bears are struggling to maintain the lower levels.
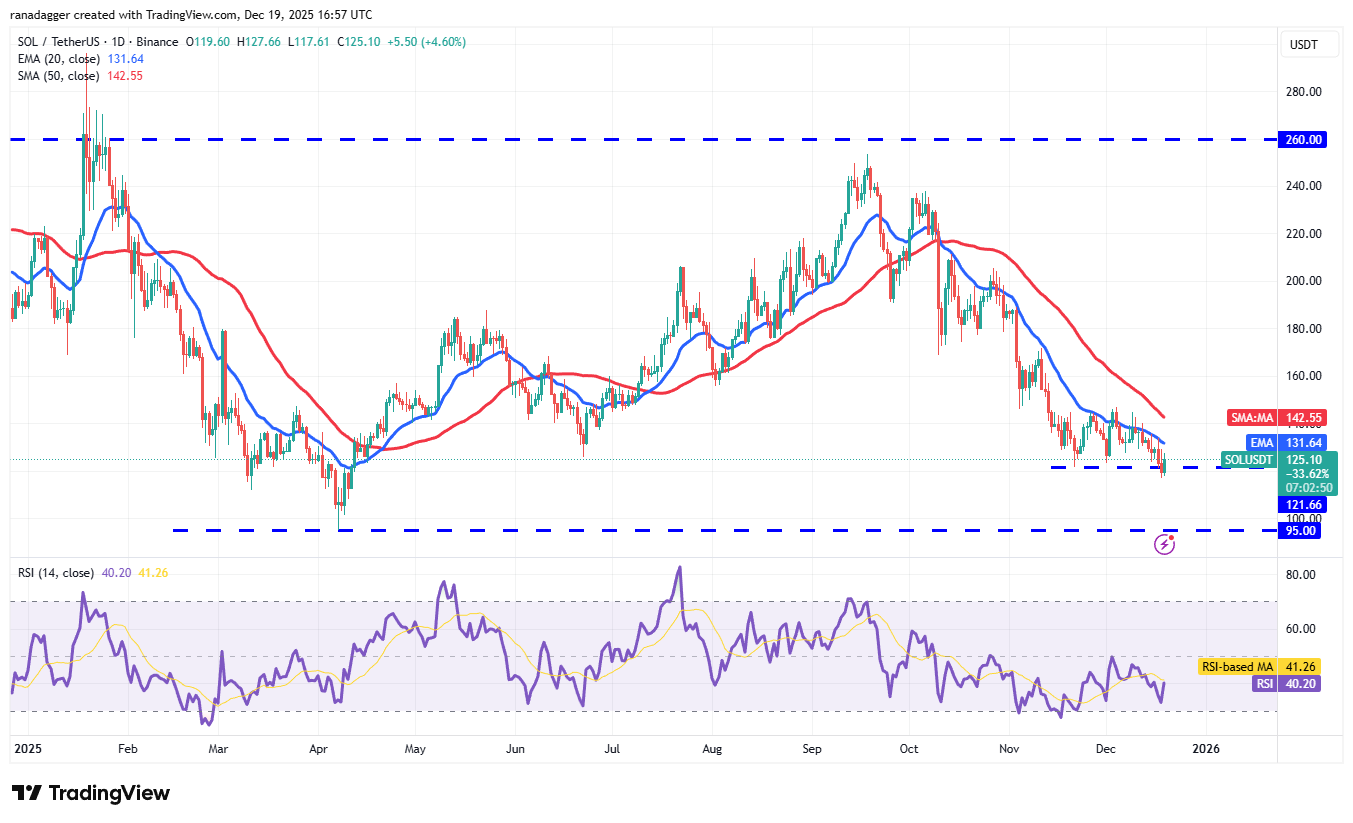
SOL/USDT daily chart. Source: Cointelegraph/TradingView

The recovery is expected to face selling at the 20-day EMA ($131) and then at the 50-day SMA ($142). If the price turns down from the moving averages, the bears will again try to tug the SOL/USDT pair below $121. If they manage to do that, the Solana price could drop to $110 and then to the $95 support.

On the contrary, if buyers drive the pair above the $147 resistance, it suggests a short-term trend change. The pair could then rally to $172.

Dogecoin price prediction

Dogecoin (DOGE) remains below the $0.14 level, but the bulls are attempting to start a relief rally.
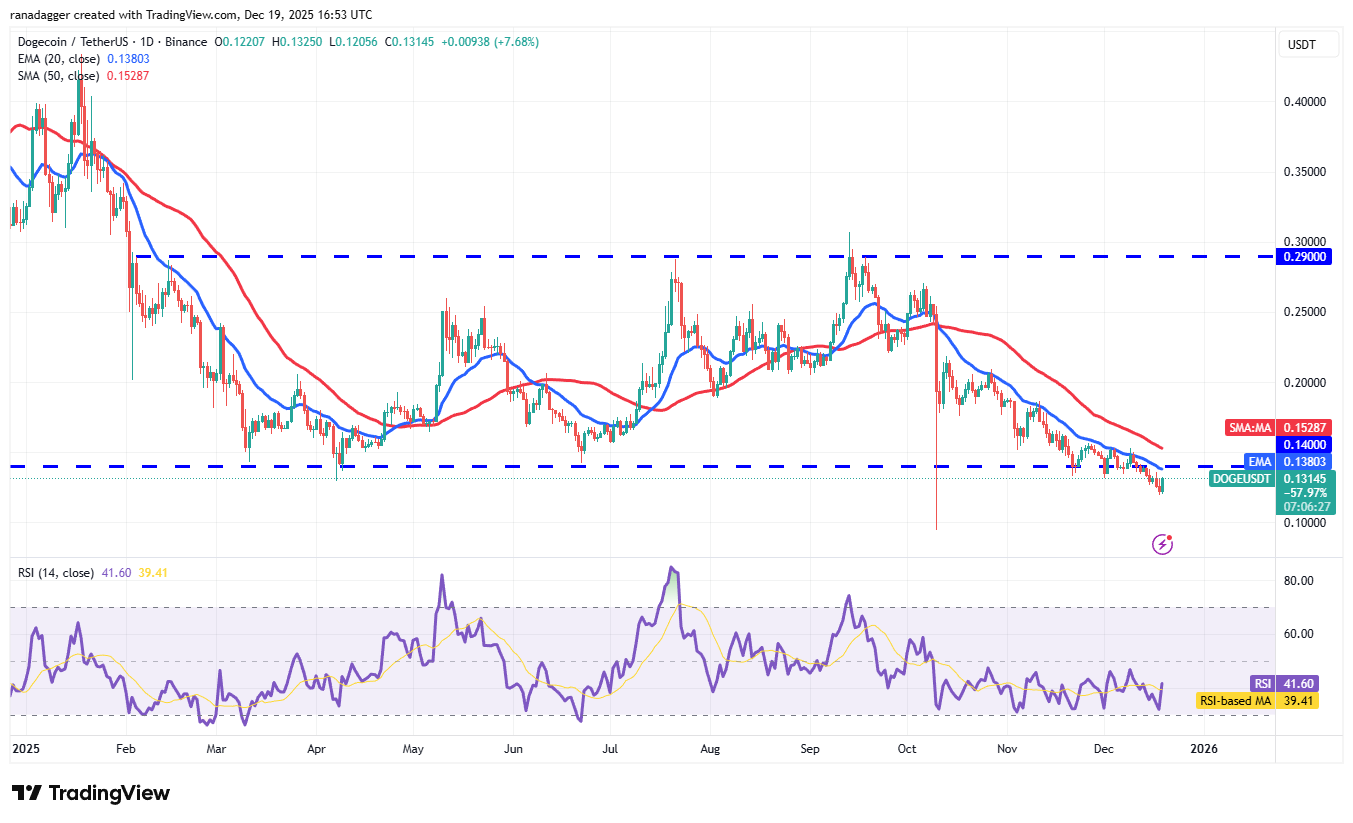
DOGE/USDT daily chart. Source: Cointelegraph/TradingView

The RSI is showing a positive divergence, indicating that the bearish momentum is weakening. The bulls will have to push and maintain the DOGE/USDT pair above the $0.16 level to signal a comeback.

Sellers are likely to have other plans. They will try to halt the relief rally at the breakdown level of $0.14. If they do that, it suggests that the $0.14 level has flipped into resistance. That heightens the risk of a decline to the Oct. 10 low of $0.10.

Cardano price prediction

Cardano (ADA) fell below the $0.37 support on Wednesday, but the bulls are trying to reclaim the level on Friday.
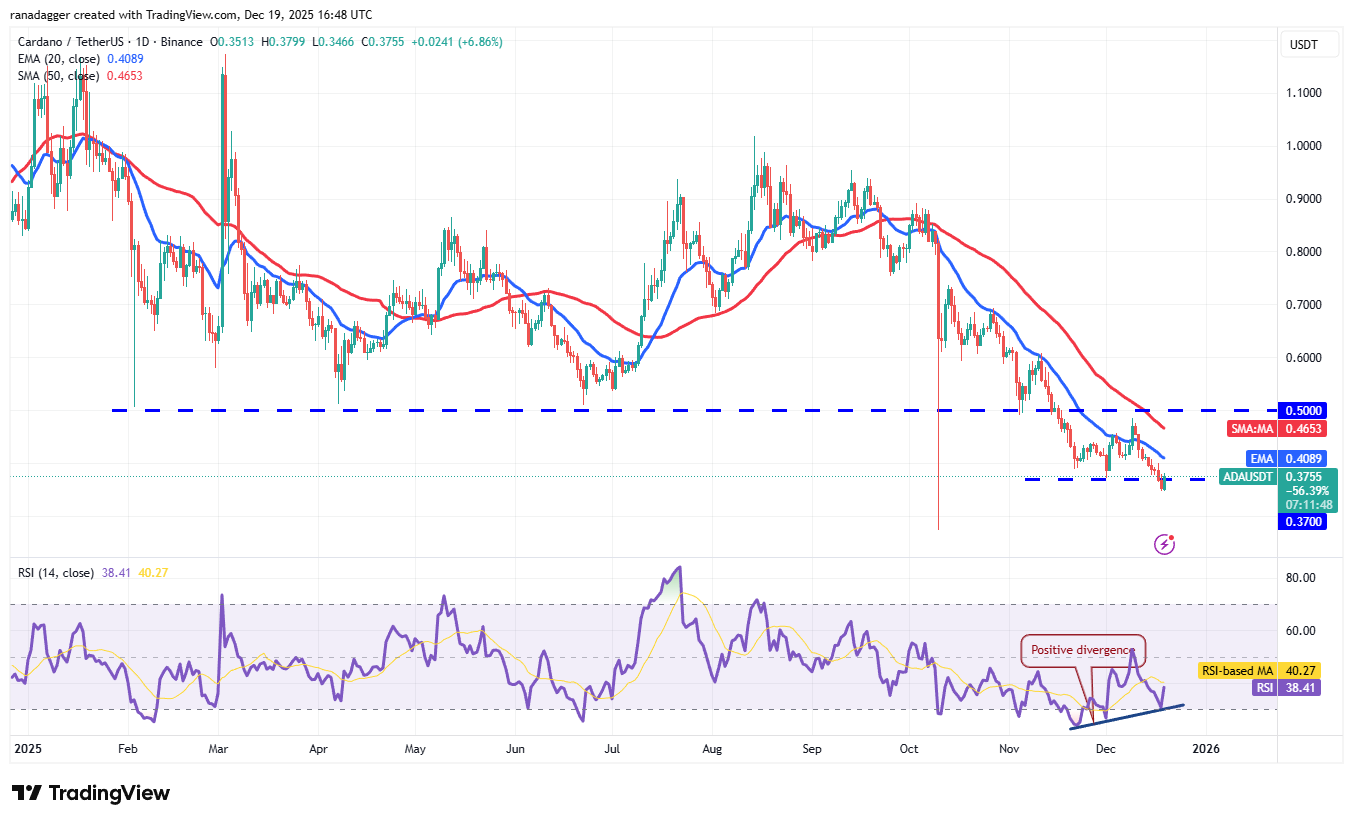
ADA/USDT daily chart. Source: Cointelegraph/TradingView

The positive divergence on the RSI suggests that the selling pressure is reducing. Buyers will try to push the price above the 20-day EMA ($0.40). If they can pull it off, the ADA/USDT pair may rally to the breakdown level of $0.50. Sellers will attempt to defend the $0.50 level, flipping it into resistance.

On the downside, a break and close below $0.34 signals the resumption of the downtrend. The Cardano price may then slump to the $0.27 level.

Related: SOL price action lags the wider altcoin market: Is Solana’s heyday over?

Bitcoin Cash price prediction

Buyers successfully defended the 50-day SMA ($535) in Bitcoin Cash (BCH), indicating a positive sentiment.
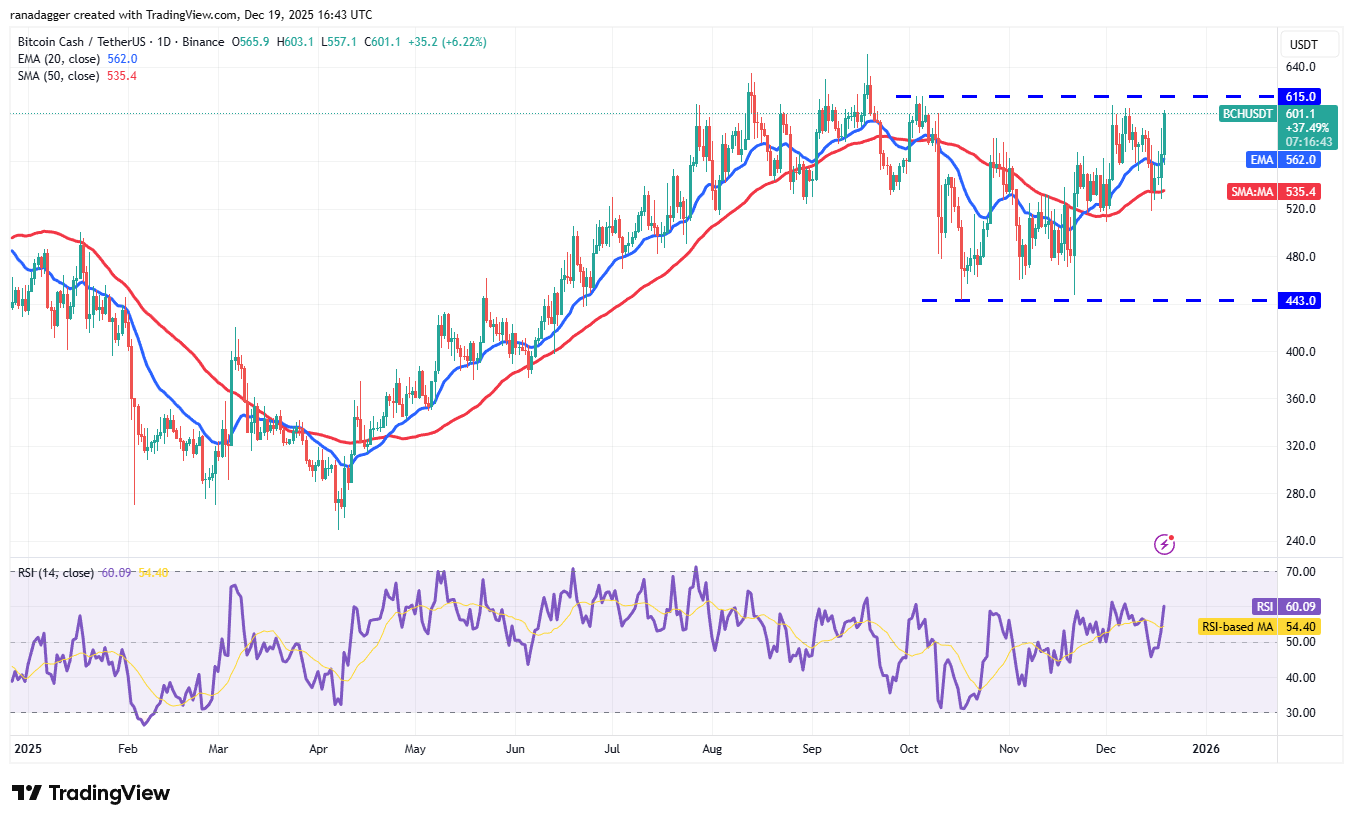
BCH/USDT daily chart. Source: Cointelegraph/TradingView

The bulls will try to strengthen their position by pushing the Bitcoin Cash price above the $615 resistance. If they manage to do that, the BCH/USDT pair could resume the up move. The pair could rally to $651 and thereafter to $720.

Conversely, if the price turns down sharply from $615 and dips below the 50-day SMA, it suggests that the pair could consolidate inside the large range between $443 and $615 for a few days.

Hyperliquid price prediction

Hyperliquid (HYPE) has turned up from $22.19, signaling that the bulls are aggressively defending the Oct. 10 low of $20.82.
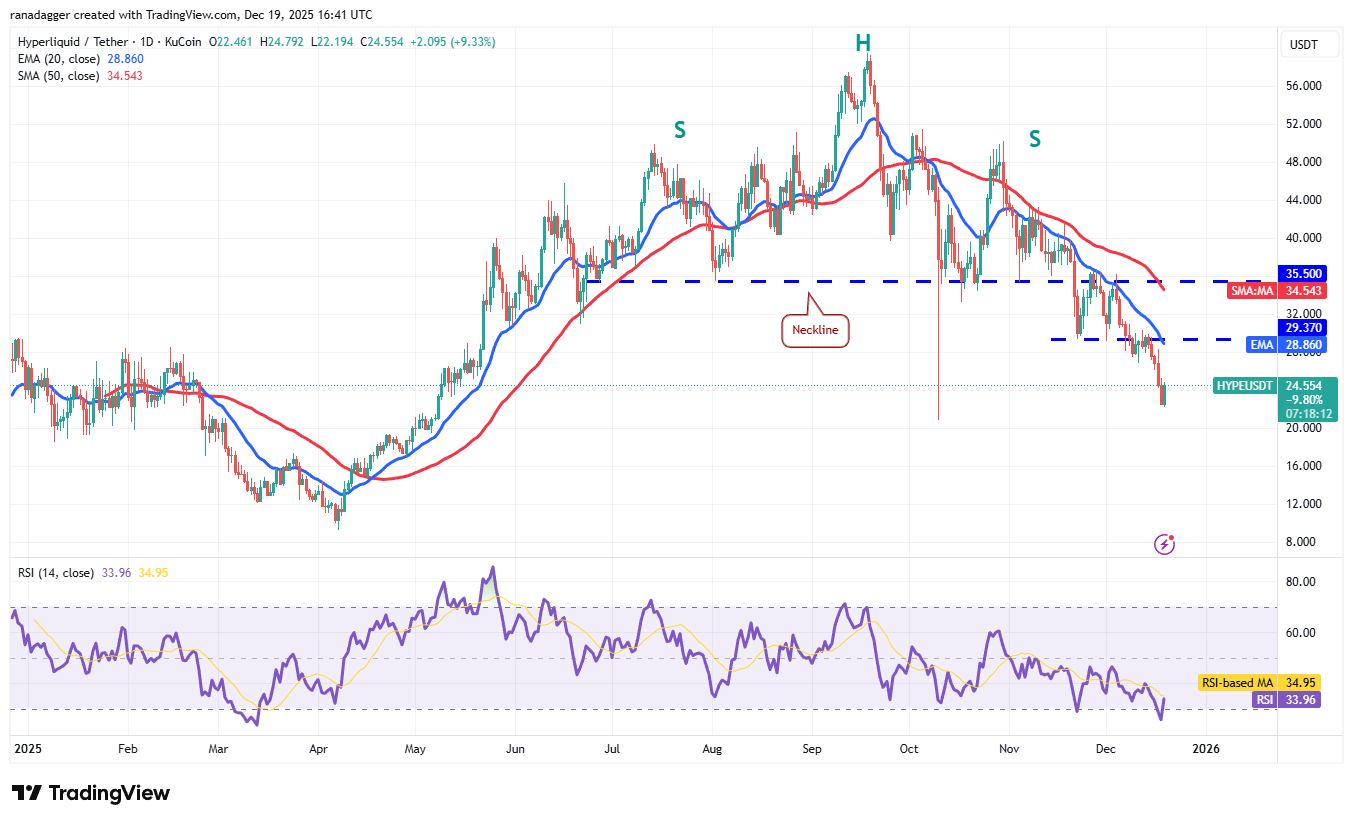
HYPE/USDT daily chart. Source: Cointelegraph/TradingView

The relief rally could reach the 20-day EMA ($28.86), which is a crucial overhead resistance to watch out for. If the price turns down sharply from the 20-day EMA, it indicates that the bears continue to sell on rallies. That increases the risk of a break below the $20.82 support. If that happens, the HYPE/USDT pair could plummet to $16.90.

On the other hand, a break above the 20-day EMA suggests that the bears are losing their grip. The Hyperliquid price could then climb to the breakdown level of $35.50.

Chainlink price prediction

The bulls are attempting to halt Chainlink’s (LINK) slide in the $11.61 to $10.94 support zone.
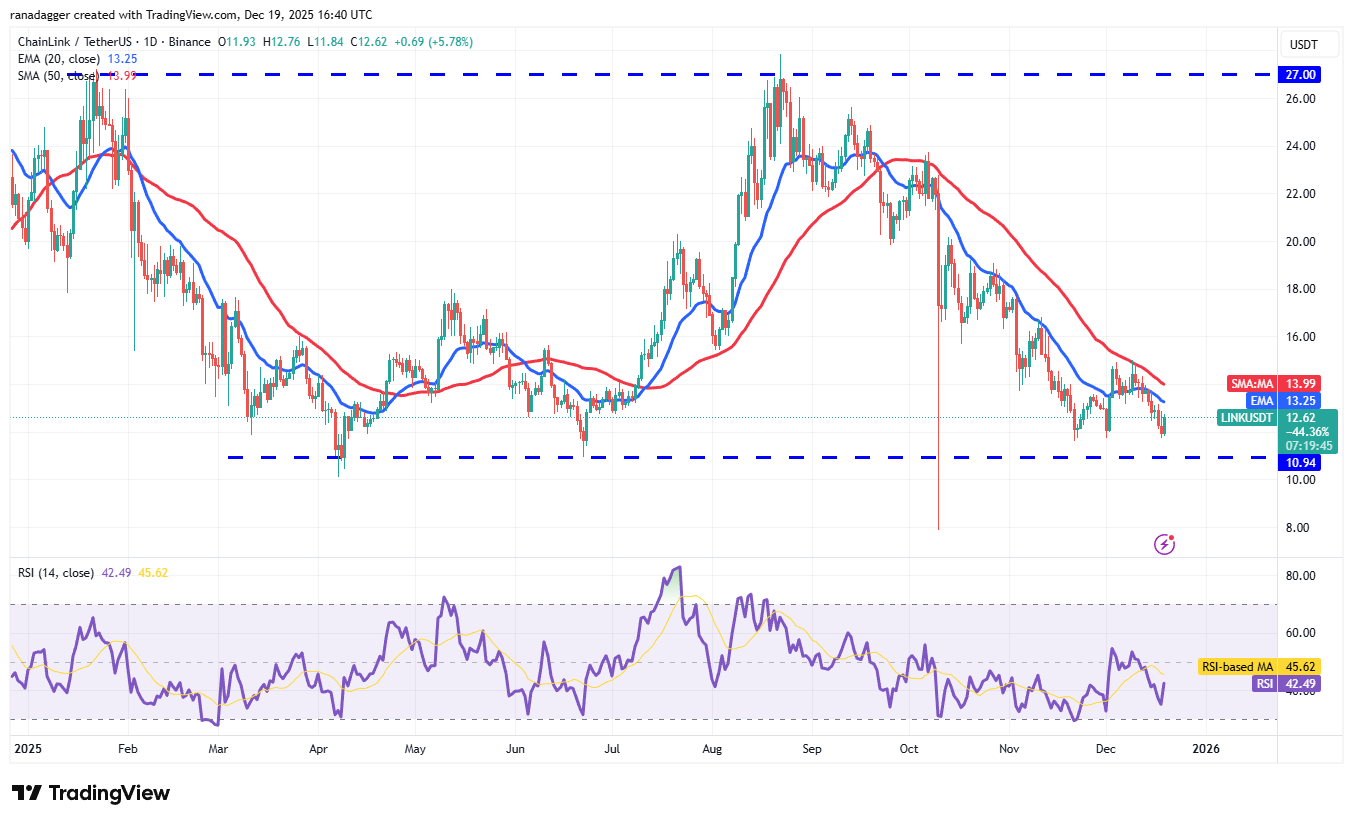
LINK/USDT daily chart. Source: Cointelegraph/TradingView

The recovery is expected to face resistance at the 50-day SMA ($13.99). If the Chainlink price turns down from the 50-day SMA, the $10.94 support may come under pressure. If the level cracks, the LINK/USDT pair could tumble to the Oct. 10 low of $7.90.

On the other hand, a break and close above the $15 level indicates that the bulls are fiercely defending the $10.94 support. That clears the path for a rally to $16.80 and then to $19. That brings the large $10.94 to $27 range into play.

This article does not contain investment advice or recommendations. Every investment and trading move involves risk, and readers should conduct their own research when making a decision. While we strive to provide accurate and timely information, Cointelegraph does not guarantee the accuracy, completeness, or reliability of any information in this article. This article may contain forward-looking statements that are subject to risks and uncertainties. Cointelegraph will not be liable for any loss or damage arising from your reliance on this information.


Trending Cryptos

Related Questions

QWhat is the current key support level for Bitcoin according to the article?

AThe current key support level for Bitcoin is $84,000.

QWhich altcoin is highlighted as showing strength in the near term?

ABitcoin Cash (BCH) is highlighted as showing strength in the near term.

QWhat event triggered Bitcoin's rise above $89,000 on Friday?

ABitcoin rose above $89,000 after the Bank of Japan (BoJ) hiked its rates to around 0.75%.

QWhat does Fidelity director Jurrien Timmer project for Bitcoin's price in 2026?

AJurrien Timmer expects Bitcoin to witness an off-year in 2026, with support in the $65,000 to $75,000 zone.

QWhat is the crucial resistance level that Ethereum needs to break to invalidate the near-term negative view?

AEthereum needs to break above the $3,450 resistance to invalidate the near-term negative view.

Related Reads

STAR 50 Soars 10.73%, Why Did A-Shares Stage a "V-Shaped Reversal"?

After a prolonged decline, the Chinese A-share market staged a strong rally on July 21. The STAR 50 index surged 10.73%, its largest single-day gain in nearly a year, leading a broad-based "V-shaped" reversal. The Shanghai Composite Index rose 1.79%, the Shenzhen Component Index gained 4.81%, and the ChiNext Index jumped 7.05%. Total market turnover reached 2.97 trillion yuan, an increase of 256.1 billion yuan from the previous session, with over 3,100 stocks advancing. The semiconductor sector spearheaded the rebound, with related ETFs posting significant gains. Analysts attribute the surge to three converging factors. First, coordinated capital inflows from "national team" institutions, insurance funds, listed company buybacks, and fund house self-purchases have bolstered market liquidity and confidence. Second, supportive policy signals, including commitments from regulators to ensure stable market operations, provided a favorable backdrop. Third, a stabilization and recovery in overseas markets, notably South Korea, created a positive external environment. Institutions suggest the most severe panic selling phase for the tech sector has likely passed, following a significant digestion of crowded positions and leveraged funds. While short-term volatility may persist, the medium to long-term outlook remains underpinned by enduring trends like AI computing demand expansion and semiconductor localization. The market's focus now shifts to the sustainability of supportive fund flows, earnings reports, and upcoming catalysts from the global AI industry chain.

marsbit1m ago

STAR 50 Soars 10.73%, Why Did A-Shares Stage a "V-Shaped Reversal"?

marsbit1m ago

U.S. Tech Momentum Stocks Post Largest Single-Day Gain Ever, But Is the Plunge Over?

US tech momentum stocks staged a sharp rebound on Tuesday (July 21st). Morgan Stanley's TMT Momentum Factor surged over 12%, marking its largest single-day gain on record, exceeding even peaks from the 2000 dot-com bubble. Key momentum indices from Goldman Sachs also posted their strongest daily performances in years. The rally was led by semiconductors, with the Philadelphia Semiconductor Index jumping 4.6%. This rebound followed three consecutive down days and a cumulative 33% plunge in momentum stocks, one of the steepest drawdowns since the dot-com era. Analysts attribute the surge largely to a short squeeze. Heavy selling had pushed high-beta momentum stocks into deeply oversold territory, forcing many short sellers, particularly in Asia, to cover their positions, creating a self-reinforcing buying spiral. However, the rebound's internals appear weak. Trading volume was notably low, and advancing stocks still lagged decliners on the S&P 500, indicating a narrow, concentrated rally rather than broad market participation. Diverging views emerge on the outlook. BTIG warns the bounce has hit key resistance and recommends selling into strength, citing extreme volatility and historical parallels to past market tops. Conversely, Goldman Sachs and UBS believe the momentum unwind is nearing its end, suggesting it may be time to gradually add exposure, as positioning has been significantly reduced. They caution, however, that high volatility warrants a measured approach, potentially using defined-risk strategies. The upcoming earnings season, particularly reports from major tech firms like Alphabet, is seen as a critical test for the rally's sustainability. Simultaneously, bond markets flashed a warning, with yields rising partly due to spiking oil prices. Analysts note that if long-term Treasury yields break decisively higher, it could pose a significant headwind for equities, especially growth stocks.

marsbit8m ago

U.S. Tech Momentum Stocks Post Largest Single-Day Gain Ever, But Is the Plunge Over?

marsbit8m ago

U.S. Tech Momentum Stocks Record Largest Single-Day Gain Ever, but Has the Rout Ended?

U.S. tech momentum stocks staged a dramatic rebound on Tuesday, July 21st. Key momentum indices like the Morgan Stanley TMT Momentum Factor and Goldman Sachs' High Beta Momentum Long Index posted historic or near-historic single-day gains, fueled largely by semiconductor stocks. This sharp rally followed a severe three-day sell-off that saw momentum stocks plunge 33%, marking one of the steepest pullbacks since the dot-com bubble. Analysts attribute the bounce primarily to a short squeeze, as forced covering from over-leveraged traders, particularly in Asia, created a buying spiral. However, the rally's health is questioned due to weak market breadth—overall trading volume was low, and decliners outnumbered advancers in the S&P 500 despite the index's gain—suggesting a narrow, concentrated surge rather than broad recovery. Opinions on the sustainability diverge. BTIG strategists warn the rebound has hit key resistance levels, citing extreme volatility and historic stock dispersion as signs of an ongoing broader correction, and recommend selling into strength. Conversely, Goldman Sachs and UBS view the aggressive momentum unwinding as nearing its end, noting reduced positioning and a lack of new fundamental catalysts. They suggest the sell-off presents a selective opportunity to add exposure, albeit cautiously and gradually using defined-risk strategies. The immediate trajectory hinges on the ongoing earnings season, with market focus on Alphabet's capital expenditure guidance for AI investment clarity. Meanwhile, bond markets present a risk, with rising Treasury yields—potentially heading toward 5.5%—and widening credit spreads for mega-cap tech companies posing a threat to equity valuations. The combination of technical factors, earnings results, and macro conditions leaves the durability of the rebound in doubt.

链捕手11m ago

U.S. Tech Momentum Stocks Record Largest Single-Day Gain Ever, but Has the Rout Ended?

链捕手11m ago

Long-Divided Must Unite, Long-United Must Divide: When L1 Becomes Its Own Rollup, What Is Ethereum's Endgame?

"The Inevitable Cycle: When L1 Becomes Its Own Rollup – What is Ethereum's Endgame?" For years, the Ethereum community grappled with concerns that L2s were fragmenting the ecosystem and eroding L1's value. While L2s provided cheaper execution, they also splintered liquidity and the unified user experience of a single chain. This has prompted a fundamental reassessment of the relationship between L1 and L2. Ethereum's roadmap is evolving. The "Scale" initiative merges L1 and L2 expansion into a holistic framework. L1 itself is advancing with higher gas limits, statelessness, and zkEVM verification, no longer content to be just a low-throughput settlement layer. Consequently, the primary value proposition of L2s is shifting from merely providing cheap blockspace to offering L1 cannot easily provide: application-specific optimizations, privacy features, and flexible governance models. L2s are becoming a spectrum of execution environments with varying degrees of security inheritance from Ethereum. A critical challenge in this multi-chain future is interoperability. The vision is to make Ethereum "feel like one chain again." This relies on advancements in native account abstraction (like EIP-7702) and intent-based architectures (Open Intents Framework), where users declare desired outcomes, and solvers handle the complex cross-chain execution. Furthermore, shortening Ethereum's finality time from minutes to seconds is crucial, as it underpins trust between chains for bridges, stablecoins, and cross-chain applications. Perhaps the most provocative idea is that Ethereum L1 itself could become a form of "its own Rollup." As zkEVM and proof systems mature, high-performance nodes could execute transactions and generate validity proofs. Regular validators would then verify these proofs instead of re-executing all transactions. This blurs the traditional L1/L2 hierarchy, making "Rollup" more of a general execution-verification architecture. Native Rollup aims to integrate L2 validation more directly into the Ethereum protocol, allowing L2s to inherit L1's security more fully and move away from reliance on security councils. In the end, L2s are not destined to replace L1 or be made obsolete by it. The likely future is a unified system where diverse execution environments—each optimized for specific use cases like DeFi, gaming, or privacy—coexist. They will share a common foundation of security, liquidity, and verifiable state, seamlessly connected to restore a cohesive user experience. The next phase for Ethereum is not just about scaling through separation, but about intelligently reintegrating what was separated back into a coherent whole.

链捕手27m ago

Long-Divided Must Unite, Long-United Must Divide: When L1 Becomes Its Own Rollup, What Is Ethereum's Endgame?

链捕手27m ago

Trading

Spot

Hot Articles

What is DOGE M

Doge Matrix ($doge m): The New Breed of Community-Driven Cryptocurrency Introduction In the ever-evolving landscape of cryptocurrency, new projects constantly emerge, each aiming to capture the interest of investors and enthusiasts alike. One of the latest entrants to this domain is Doge Matrix, represented by the ticker symbol $doge m. This project has attracted attention thanks to its roots in the popular meme culture surrounding Dogecoin, establishing its place within the web3 space. This article aims to provide a comprehensive analysis of Doge Matrix, covering its overview, creator, investors, functionality, timeline, and notable aspects. What is Doge Matrix ($doge m)? Doge Matrix is a community-driven cryptocurrency project that seemingly builds upon the widespread appeal of Dogecoin, a digital currency known for its Shiba Inu mascot and its meme origins. While the overarching objectives of Doge Matrix are not extensively defined, it is characterized by a commitment to harnessing community involvement and support. Unlike traditional cryptocurrencies that often emphasize utility or intrinsic value through underlying technologies, Doge Matrix positions itself within a space that embraces the cultural phenomenon of cryptocurrencies, particularly appealing to those who resonate with the ethos of meme-based assets. Drawing on the strengths of the Dogecoin community, Doge Matrix operates as part of a broader ecosystem, inviting participation and engagement from users who share an interest in cryptocurrency and the digital landscape. Who is the Creator of Doge Matrix ($doge m)? The identity of the creator of Doge Matrix remains unknown. This lack of transparency is not an uncommon occurrence in the cryptocurrency space, where some projects are launched without revealing the identities of their founders. The absence of information regarding the founding team can raise questions among potential investors about the project’s accountability and direction. Who are the Investors of Doge Matrix ($doge m)? As it stands, there is no publicly available information detailing the investors or investment foundations that back Doge Matrix. The project appears to rely primarily on community support rather than institutional investment. This model aligns with the community-driven nature of the initiative, fostering an environment where the direction of the project is shaped by its participants rather than being dictated by a select few financial backers. How Does Doge Matrix ($doge m) Work? The specifics regarding the operational mechanisms of Doge Matrix are somewhat vague, reflecting a broader trend of projects in the meme coin space where innovative functionalities are not always clearly articulated. Nonetheless, Doge Matrix seems designed to tap into the existing cryptocurrency ecosystem by encouraging user participation while tapping into the familiar cultural references associated with Dogecoin. Its potentially unique characteristics derive from community interactions rather than technological advancements, emphasizing shared experiences and collaboration among token holders. While the exact innovations have not been explicitly outlined, the project appears to create a space where community members can engage, share ideas, and propel the project's potential forward. Timeline of Doge Matrix ($doge m) Reflecting on the project’s timeline reveals notable events that have defined its journey thus far: November 25, 2024: Doge Matrix reached its all-time high value, marking a significant milestone in its early history. January 1, 2025: Conversely, Doge Matrix hit its all-time low value, illustrating the volatility often associated with cryptocurrencies, especially in the early stages of a project's lifecycle. Ongoing: The project continues to be actively traded and supported by its community, although specific future milestones or objectives have yet to be disclosed. Key Points About Doge Matrix ($doge m) Community Focus At the heart of Doge Matrix is a commitment to community engagement. The project thrives on the premise of collaboration and shared objectives among its members, emphasizing the importance of collective effort. Unlike centralized projects that often have a defined leadership structure, Doge Matrix at present showcases a more fluid approach to governance, where every community member's voice matters. Volatility The cryptocurrency market is notorious for its volatility, and Doge Matrix is no exception. Its price history reflects significant fluctuations between high and low values, which is typical of many new cryptocurrencies but underscores the risks associated with investment in emerging tokens. Lack of Detailed Information One of the most striking features about Doge Matrix is the scarcity of detailed information regarding its technological underpinnings and operational mechanisms. This ambiguity necessitates that potential investors conduct thorough due diligence before engaging with the project. Conclusion In summary, Doge Matrix ($doge m) illustrates a new wave of cryptocurrency projects that lean heavily on community engagement and cultural relevance. While lacking in certain specifics—such as clear leadership, defined objectives, and detailed functionality—the project has managed to generate interest within the crypto community, leveraging the established appeal of meme culture. As with any investment in the cryptocurrency space, understanding the inherent risks and conducting comprehensive research is essential for potential participants. Doge Matrix stands as a reminder of the dynamic, sometimes unpredictable nature of the crypto industry, marked by constant evolution and enthusiasm for community-driven initiatives.

4.1k Total ViewsPublished 2025.02.03Updated 2025.02.03

What is DOGE M

Discussions

Welcome to the HTX Community. Here, you can stay informed about the latest platform developments and gain access to professional market insights. Users' opinions on the price of DOGE (DOGE) are presented below.

活动图片