Measuring Market Asymmetry: The Glassnode Skew Index

insights.glassnodePublished on 2025-12-11Last updated on 2025-12-11

Abstract

The Glassnode Skew Index is a new metric designed to measure market asymmetry by aggregating information across the entire volatility smile, rather than relying on the traditional 25-delta skew which only samples two points. It condenses the volatility curve into two components: DownVol (volatility from OTM puts, indicating downside protection and fear) and UpVol (volatility from OTM calls, reflecting bullish sentiment and upside speculation). The index is calculated as UpVol minus DownVol. Positive values suggest optimism and call buying dominance, while negative values indicate hedging and risk aversion. It helps identify sentiment regimes, confirm or contradict price movements, and analyze different tenors for layered market outlooks. Available for multiple assets and tenors, it provides a standardized, cross-exchange view of options market sentiment.

When assessing options markets, one of the most powerful signals is skew: how the market prices risk on the upside versus the downside. The standard approach for traders is to look at the 25-delta skew: a simple comparison between the implied volatility of a 25-delta call and a 25-delta put. This method is effective, simple and familiar, but it samples only two points on the volatility curve. As a result, it often misses structure embedded in the rest of the surface.

The Glassnode Skew Index addresses this by aggregating information across the full smile, producing a more robust signal of where risk is being priced. We explain the purpose of the new metric, how it is constructed, and how it can fit into the broader toolkit of options analysis.

To access the new metrics visit Glassnode Studio. Available to Professional plan users.

View metric

Introducing the Glassnode Skew Index

Instead of focusing on two isolated strikes, the Glassnode Skew Index condenses the entire shape of the volatility smile into a single, intuitive measure of market asymmetry.

We divide the curve into two regions: one representing downside risk, and one representing upside potential. Each region is transformed into a standardized volatility measure as we calculate how much volatility the market is pricing into that segment.

  • DownVol represents the total implied volatility from out-of-the-money put options — protection against falling prices. When traders rush to buy puts, DownVol rises, signalling fear or a desire to hedge.
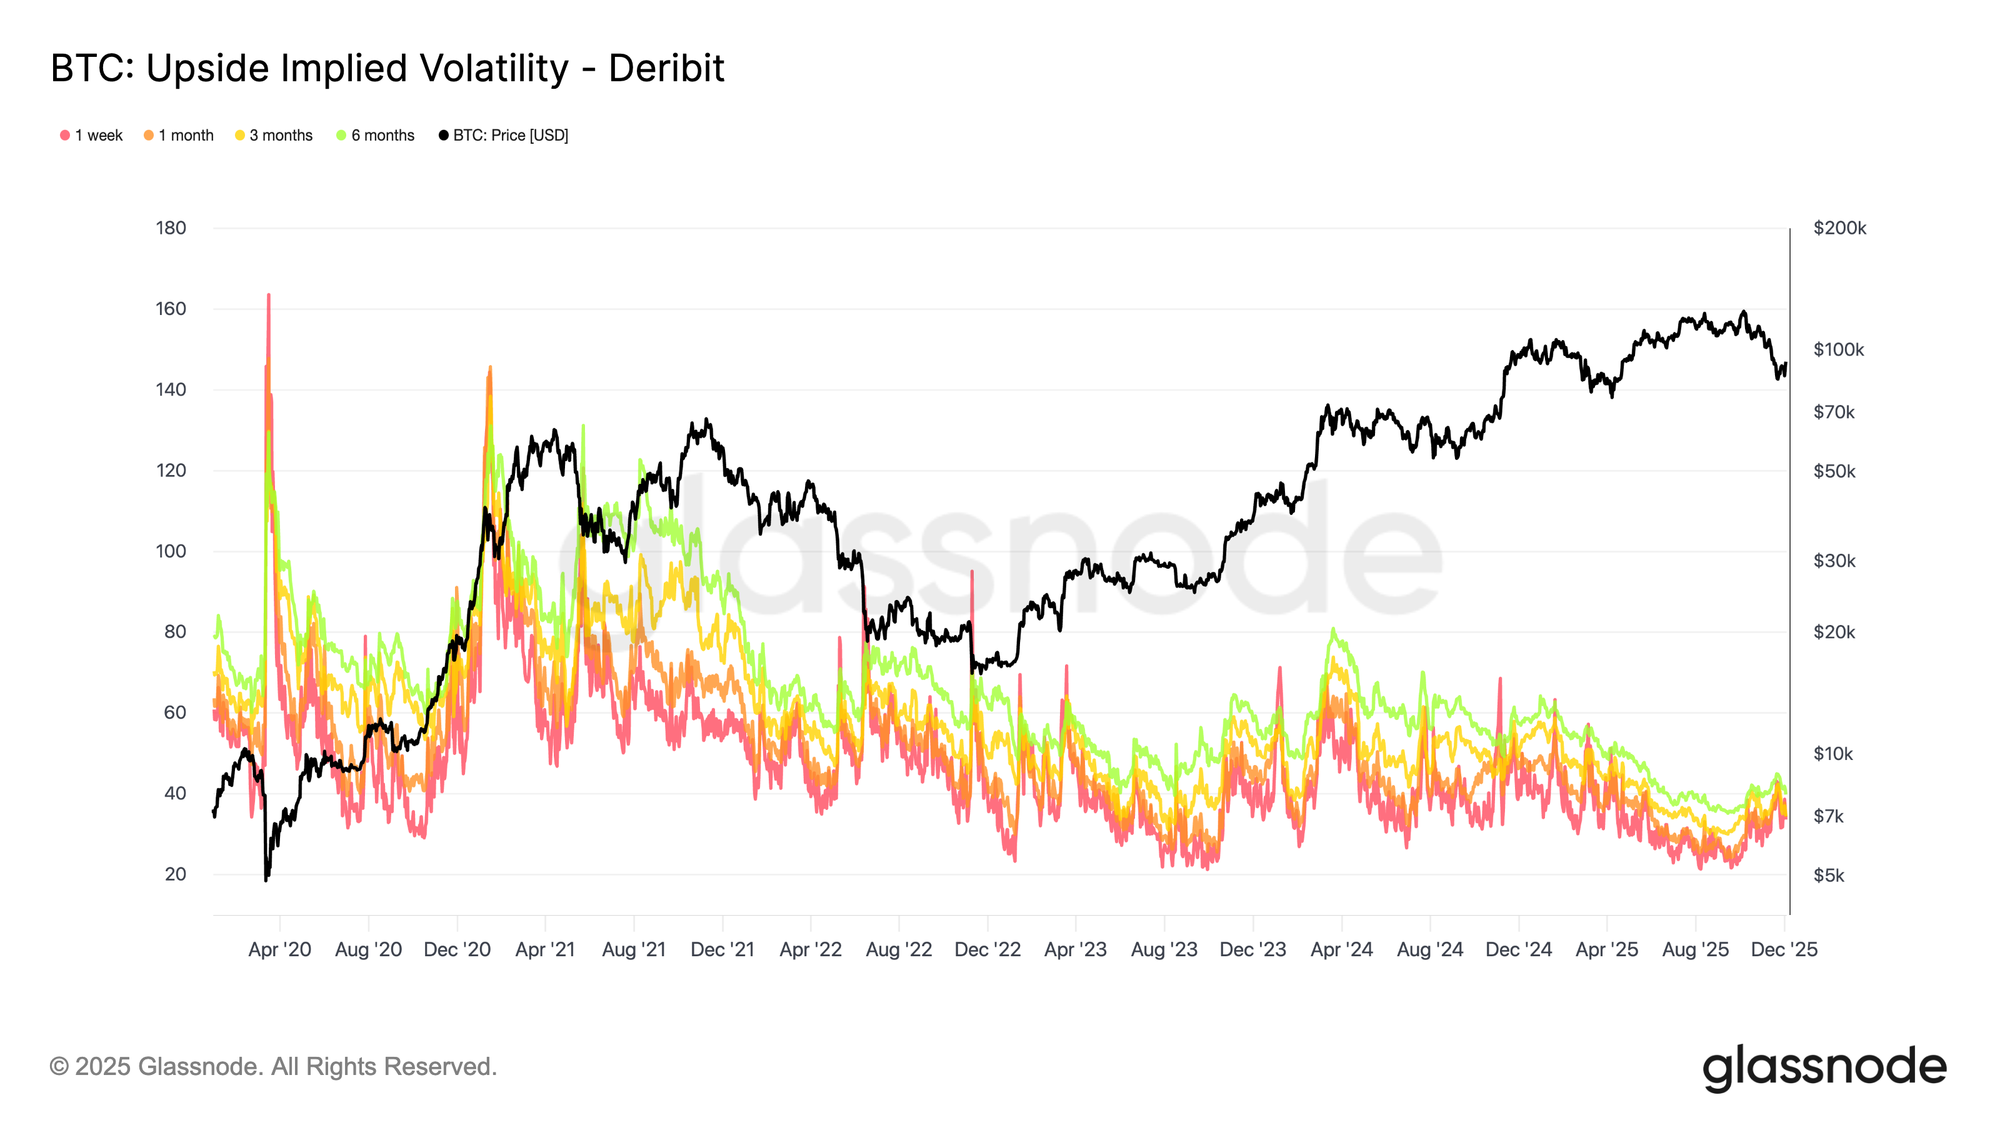
  • UpVol captures the opposite: the total volatility priced into out-of-the-money call options. This reflects how much traders are willing to pay for upside exposure or potential short-squeeze gains. When call demand increases, UpVol rises, often alongside strong bullish sentiment.

The difference between these two components gives us the skew index: Glassnode Skew Index = UpVol - DownVol

  • Positive values indicate a market that’s paying more for upside volatility – typically driven by optimism, momentum, or speculative call buying.
  • Negative values mean downside protection dominates, as investors prioritize safety and hedging over chasing upside.

In practical terms, The Glassnode Skew Index shows whether option traders are more concerned about a crash down, or more excited about a breakout up – and by how much.

How to Use the Skew Index

The Skew Index can be applied in several ways to interpret options market positioning, identify sentiment regimes, and understand how traders are distributing risk across upside and downside scenarios.

Map the Current Sentiment Regime

The index can help contextualize prevailing market conditions:

  • Deeply negative values indicate a market that is paying a premium for downside protection, consistent with defensive positioning.
  • Strongly positive values indicate that investors are paying more for upside participation, often in the context of strong trends and speculative call activity.

Monitoring these extremes helps identify when fear or euphoria dominates the options market.

Use it as a Confirmation or Divergence Tool

The index can complement movements in spot price:

  • A rising Skew Index alongside a rising spot price suggests that the options market is reinforcing the move through increased demand for upside volatility.
  • A rally in spot with a Skew Index that stays sharply negative points to a distrusted move, where traders remain hedged and cautious.
  • A falling market with a heavily negative Skew Index confirms a classic risk-off environment with significant demand for protection.
  • A falling market with a positive Skew Index can indicate that traders are already looking through the weakness and positioning for a recovery.

This makes the index useful for evaluating whether options flows validate or contradict price action.

Interpreting Tenor Combinations

Different tenors can convey different layers of sentiment:

  • A negative 1-week skew with neutral or positive 3- and 6-month values often indicates temporary stress overlaying a constructive medium- and long-term outlook.
  • A very positive 1-week skew with subdued longer tenors suggests that traders are enthusiastic about the near-term, but reluctant to extend risk far into the future.
  • When skew is consistently elevated or depressed across all tenors, it points to a stable, regime-like sentiment environment rather than a short-lived spike.

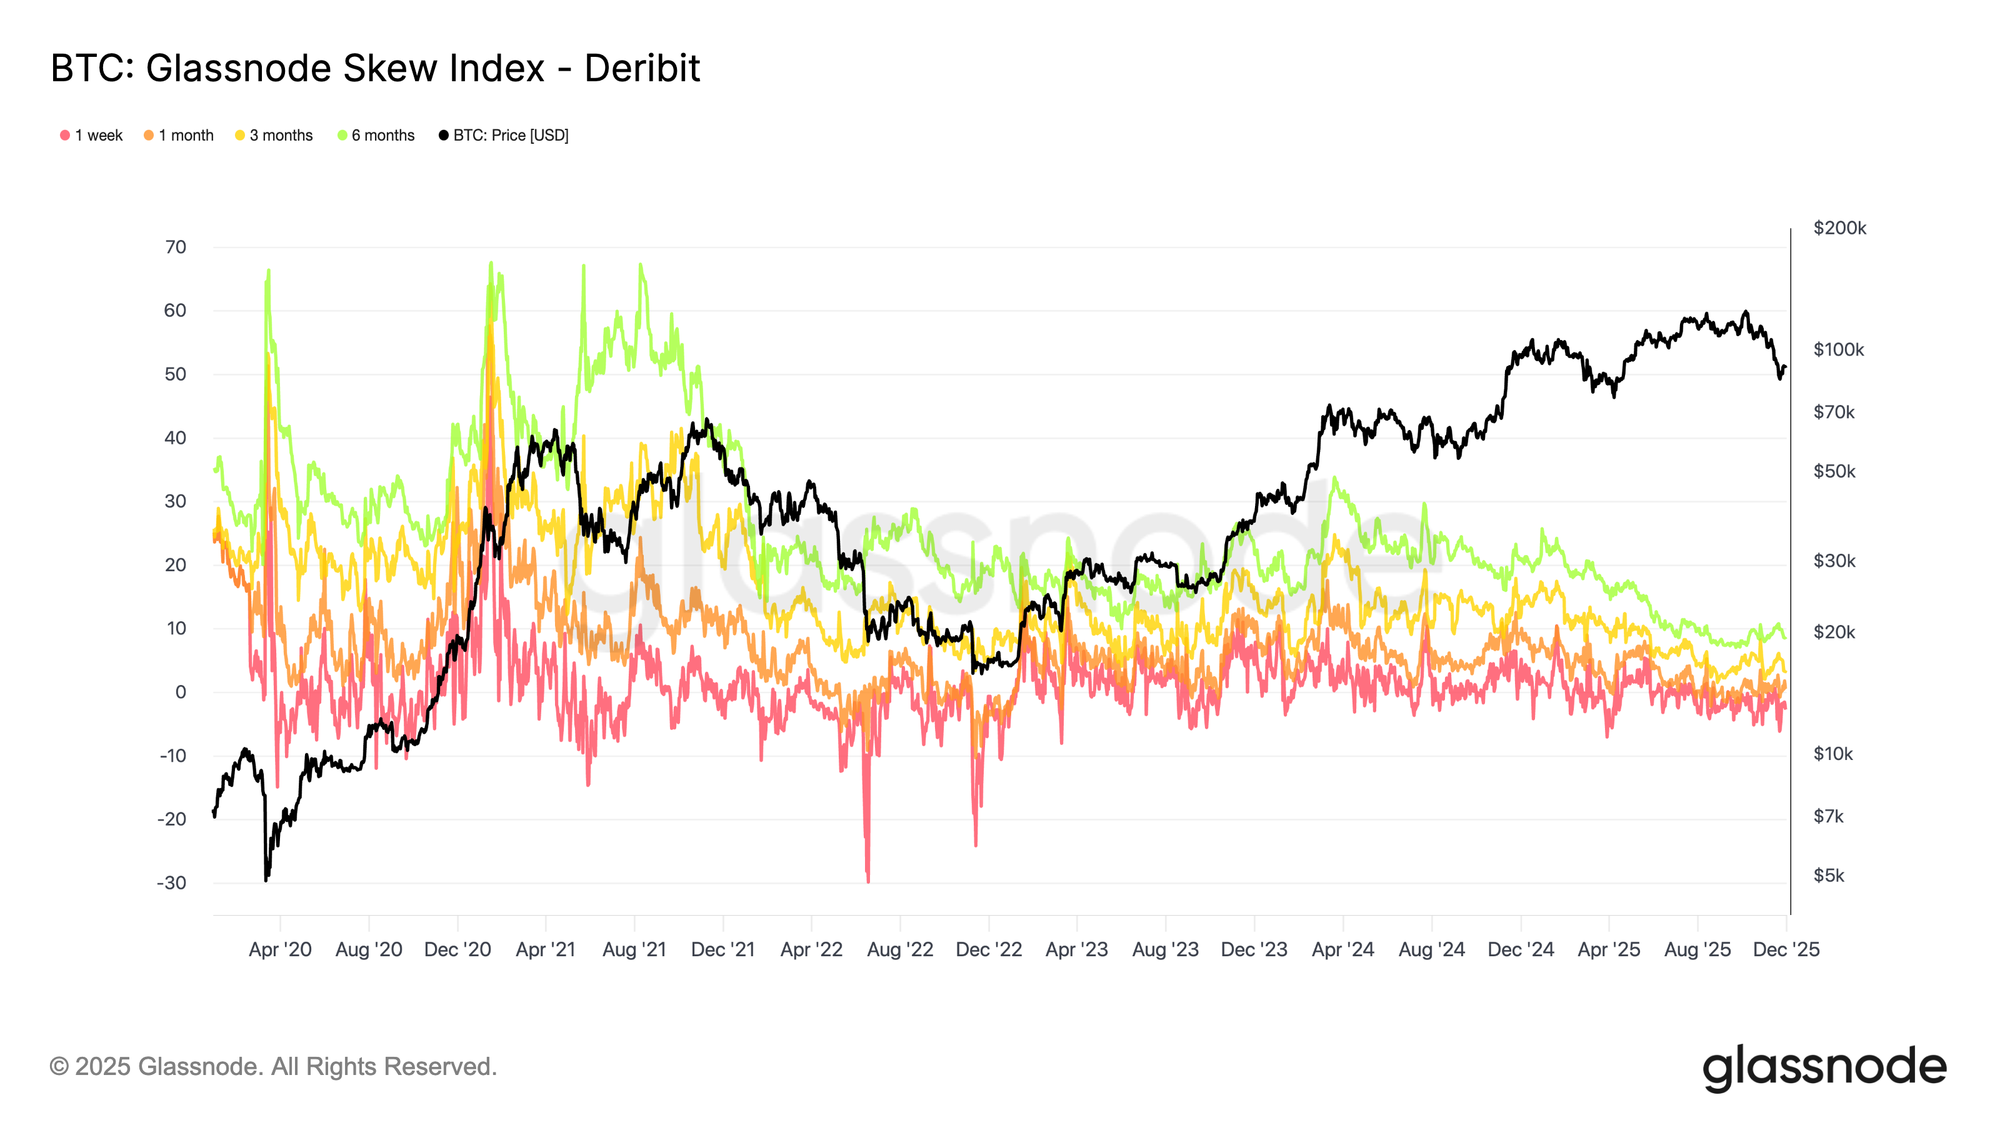
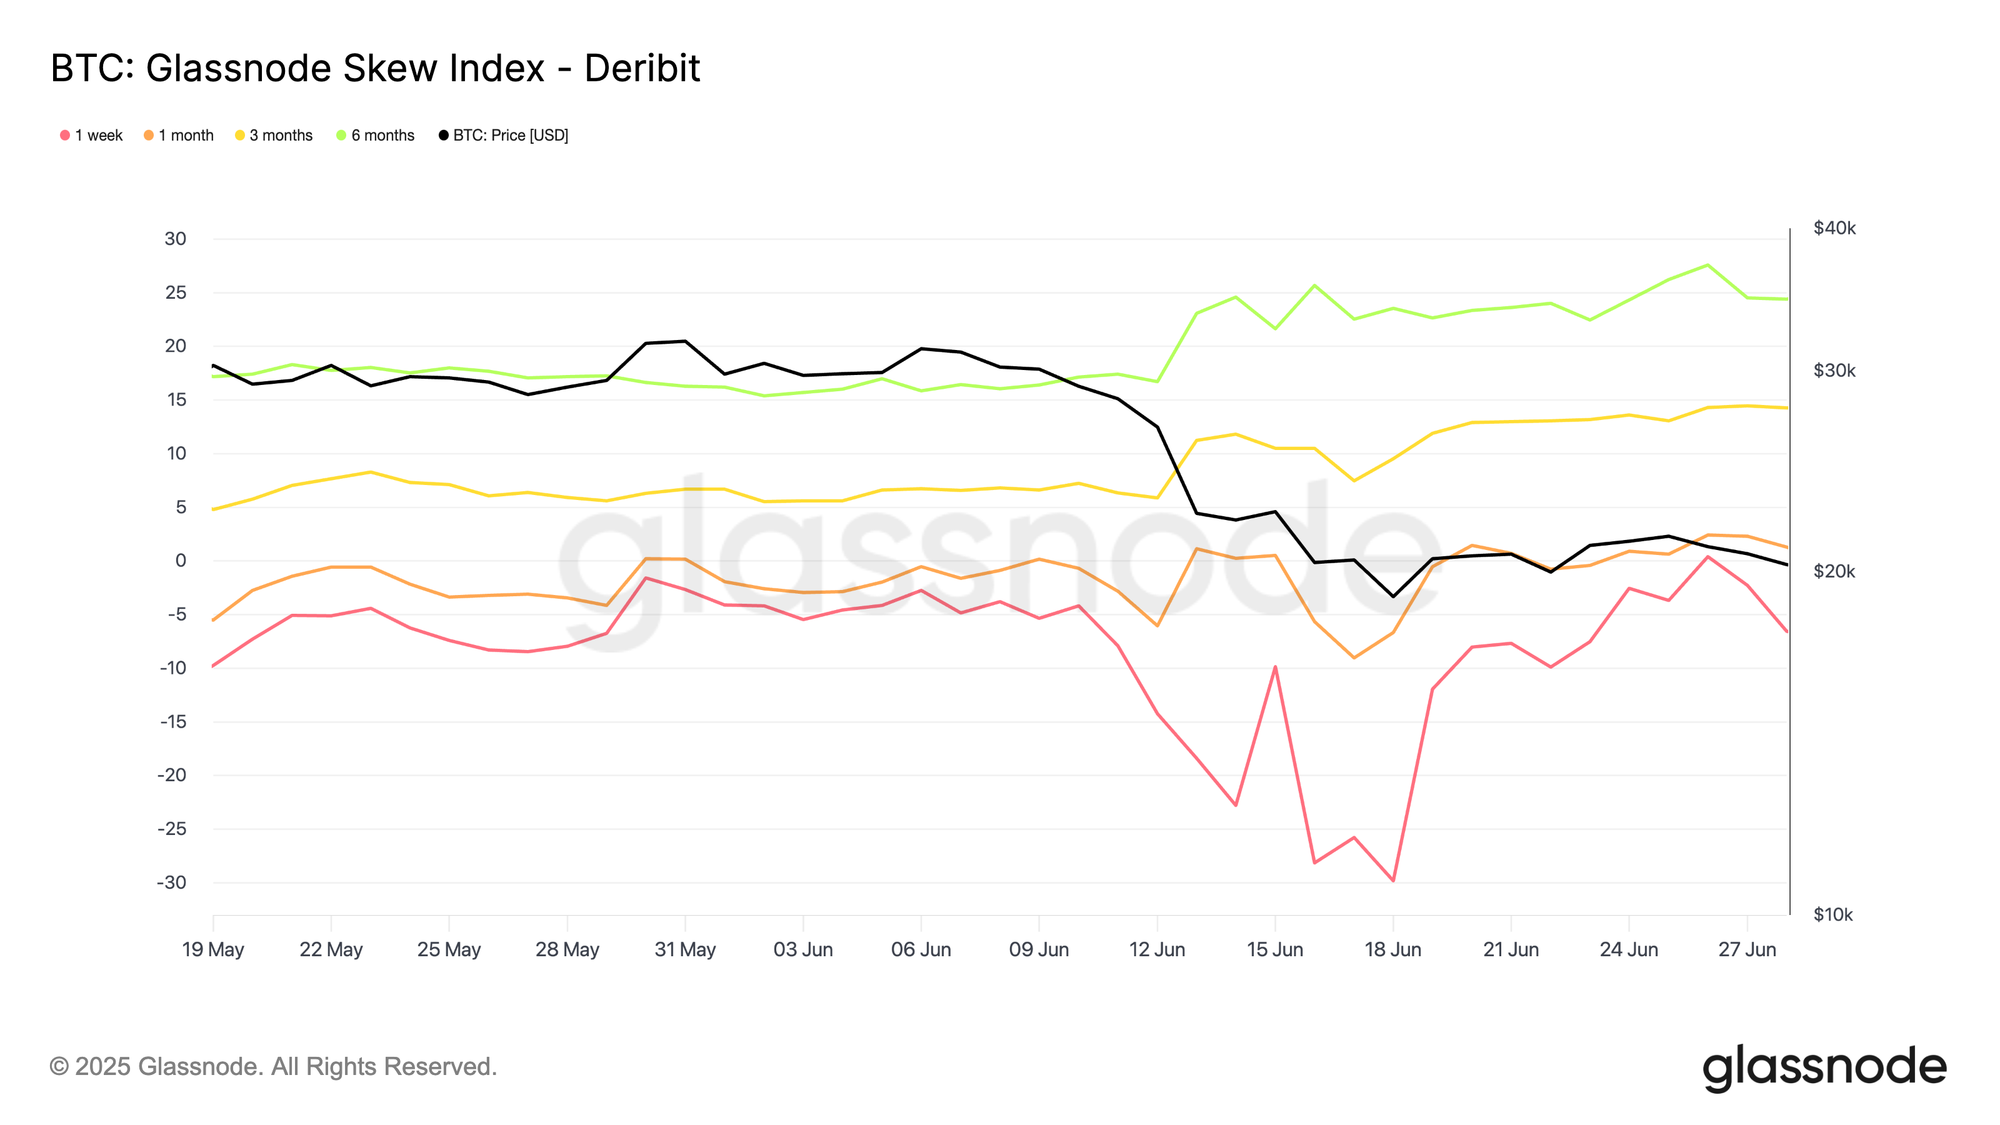
For example, in June 2022, we saw a clear tenor divergence: the 1-week Skew Index (red) plunged into deeply negative territory, signalling aggressive demand for short-dated puts over calls. Meanwhile, the 3-month (yellow) and 6-month (green) skews moved higher, indicating that investors were still willing to pay relatively more for upside exposure further out the curve.

In other words, the fear was mainly short-term, and longer-dated options continued to lean towards upside scenarios, implying that many participants expect better prices further out on the horizon.

How it works under the hood

We calculate the Glassnode Skew Index by aggregating option prices across many strikes on both sides of the distribution. These prices are transformed into standardized measures of upside and downside implied volatility, aligned to fixed maturities such as 1 week, 1 month, 3 months, and 6 months.

We then combine data across major venues so traders can compare BTC, ETH, SOL, XRP, or PAXG on consistent terms. This standardization removes the distortions that arise from strike irregularities, liquidity gaps, or exchange-specific conventions.

The result is a cross-asset, cross-tenor gauge of options market sentiment that captures the full structure of the volatility smile rather than relying on a single-point skew measure.

Available for:

  • Resolutions: 10 minutes, hourly, daily
  • Tenors: 1 week, 1 month, 3 months, 6 months
  • Assets: BTC, ETH, SOL, XRP, PAXG
  • Exchanges: Deribit, OKX

  • Follow us on X for timely market updates and analysis
  • Join our Telegram channel for regular market insights
  • For on-chain metrics, dashboards, and alerts, visit Glassnode Studio

Disclaimer: This report is for informational and educational purposes only. The analysis represents a limited case study with significant constraints and should not be interpreted as investment advice or definitive trading signals. Past performance patterns do not guarantee future results. Always conduct thorough due diligence and consider multiple factors before making investment decisions.

Related Reads

Cursor, Why Boarded Musk's Starship?

SpaceX announced its acquisition of AI programming startup Cursor's parent company, Anysphere, for $60 billion in an all-stock deal, just days after its record-breaking IPO. The move sent SpaceX's stock soaring, briefly making it the most valuable U.S. company. Cursor, founded in 2022 by MIT graduate Michael Truell and his classmates, is a popular AI coding assistant that allows developers to switch between models from OpenAI, Anthropic, and others. It saw explosive revenue growth, reaching a $4 billion annualized run rate in early 2026. However, its market share was eroded by the launch of competitor Claude Code from its key AI supplier, Anthropic. This dependence prompted Cursor to develop its own AI model, Composer, in early 2026. To scale Composer, Cursor needed immense computing power. In April 2026, it struck a deal with SpaceX, granting the latter an option to acquire it post-IPO. SpaceX exercised this option, offering Cursor access to its Colossus supercomputer, powered by hundreds of thousands of top-tier Nvidia AI chips. For SpaceX, the acquisition is a strategic move to bolster its AI capabilities, particularly for its xAI division, and advance its broader ambition of building orbital, solar-powered data centers. While the deal surprised some employees and investors given Truell's earlier stance on independence, it represents a high-stakes partnership. SpaceX CEO Elon Musk has projected the company could reach $1 trillion in revenue by 2030. For Truell, joining forces with SpaceX is a monumental gamble on an unprecedented scale in the race for AI dominance.

链捕手2m ago

Cursor, Why Boarded Musk's Starship?

链捕手2m ago

The More It Rises, the More Dangerous? The Systemic Risks Behind SpaceX's Soaring Valuation

Summary: The article raises concerns about the systemic risks posed by SpaceX's skyrocketing valuation, arguing that modern market mechanics, rather than fundamentals, are driving its price discovery. Following SpaceX's market capitalization surpassing $3 trillion in after-hours trading, the author contends that the market is no longer functioning properly. The core issue is not SpaceX's business prospects but the unhealthy market structure surrounding it. With limited float and the imminent launch of options trading, the stage is set for a potential "gamma squeeze"—a feedback loop where market makers hedging call options are forced to buy shares, pushing the price higher and attracting more speculative momentum traders. This mechanism, seen previously with Tesla and meme stocks, can decouple valuation from financial reality. The danger escalates as extreme valuations force passive funds, ETFs, pensions, and major indices to hold the stock. If SpaceX grows large enough—hypothetically reaching $5 or even $10 trillion—its performance would increasingly dictate broader market indices, embedding systemic risk. The author warns that when price appreciation itself becomes the primary bullish thesis, the market transforms from a capital allocation mechanism into a self-reinforcing speculative machine, endangering the retirement savings of ordinary investors tied to passive strategies. The piece questions whether such a system can still perform its fundamental role of price discovery.

marsbit7m ago

The More It Rises, the More Dangerous? The Systemic Risks Behind SpaceX's Soaring Valuation

marsbit7m ago

OpenAI's Hyperliquid Pre-IPO Pricing Venture: Why Did It Last Only Half a Year?

The article discusses the rise and fall of Pre-IPO pricing markets on the Hyperliquid blockchain. Trade.xyz, an anonymous team, successfully built the largest pre-market for SpaceX (SPCX) by launching a contract with a clear anchor: the eventual Nasdaq listing price. This provided inherent price stability and validation. In contrast, Ventuals, a team backed by Paradigm, failed despite holding exclusive contracts for highly sought-after companies like OpenAI and Anthropic. Its key mistake was its pricing mechanism. For companies with no near-term IPO date, Ventuals' oracle relied partly on opaque private market transactions and, critically, partly on its own contract's moving average price. This created a self-referential feedback loop where prices were artificially propped up and detached from genuine supply and demand, leading to illiquid markets. Ventuals shut down after nine months, settling positions at final prices of $1,341.80 for OpenAI and $1,618.90 for Anthropic. Ironically, some employees and late-stage investors of these very companies reportedly used these flawed Ventuals prices for valuation reference, highlighting the acute demand for any price signal in illiquid private markets. The article concludes that while demand for pre-IPO trading is real and growing, with players like Coinbase now entering the space, the fundamental challenge remains: without a public listing to provide a definitive price anchor, these markets struggle to establish truly accurate and liquid pricing. The need for a transparent, self-correcting market is the critical lesson from Ventuals' failure.

marsbit33m ago

OpenAI's Hyperliquid Pre-IPO Pricing Venture: Why Did It Last Only Half a Year?

marsbit33m ago

Trading

Spot
Futures

Hot Articles

How to Buy ONE

Welcome to HTX.com! We've made purchasing Harmony (ONE) simple and convenient. Follow our step-by-step guide to embark on your crypto journey.Step 1: Create Your HTX AccountUse your email or phone number to sign up for a free account on HTX. Experience a hassle-free registration journey and unlock all features.Get My AccountStep 2: Go to Buy Crypto and Choose Your Payment MethodCredit/Debit Card: Use your Visa or Mastercard to buy Harmony (ONE) instantly.Balance: Use funds from your HTX account balance to trade seamlessly.Third Parties: We've added popular payment methods such as Google Pay and Apple Pay to enhance convenience.P2P: Trade directly with other users on HTX.Over-the-Counter (OTC): We offer tailor-made services and competitive exchange rates for traders.Step 3: Store Your Harmony (ONE)After purchasing your Harmony (ONE), store it in your HTX account. Alternatively, you can send it elsewhere via blockchain transfer or use it to trade other cryptocurrencies.Step 4: Trade Harmony (ONE)Easily trade Harmony (ONE) on HTX's spot market. Simply access your account, select your trading pair, execute your trades, and monitor in real-time. We offer a user-friendly experience for both beginners and seasoned traders.

3.9k Total ViewsPublished 2024.03.29Updated 2026.06.02

How to Buy ONE

Discussions

Welcome to the HTX Community. Here, you can stay informed about the latest platform developments and gain access to professional market insights. Users' opinions on the price of ONE (ONE) are presented below.

活动图片