Keeta rallies 36% in a day – Should KTA holders take profits now?

ambcryptoPublished on 2026-04-01Last updated on 2026-04-01

Abstract

Keeta (KTA), an altcoin with a $109 million market cap, surged 36.7% in 24 hours, accompanied by a 400% increase in daily trading volume. This rally occurred amid broader market uncertainty, with Bitcoin facing rejection near $76k and retesting $66k as support. The 1-day chart showed KTA reclaiming the $0.20 resistance level, with the Chaikin Money Flow (CMF) indicating strong buying pressure and the RSI suggesting sustainable upward momentum. However, the 1-hour chart revealed a potential short-term pullback toward $0.176, supported by a bearish RSI divergence and a declining CMF. Traders are advised to consider taking profits, as the longer-term structure remains bearish, and further losses may follow.

The $109 million market cap altcoin Keeta [KTA] experienced a 36.7% rally in the past 24 hours, at press time. CoinMarketCap data showed that it had a 400% surge in daily trading volume as traders and investors raced to capture some gains the altcoin was posting.

These gains came at a time of wider market uncertainty and drawdown. Bitcoin [BTC] faced rejection from the $76k level in the past two weeks and retested the $66k level as support on Tuesday, the 31st of March.

Can KTA keep its rally going, or is this rally one for holders to sell?

Right time to take profits?
Source: KTA/USDT on TradingView

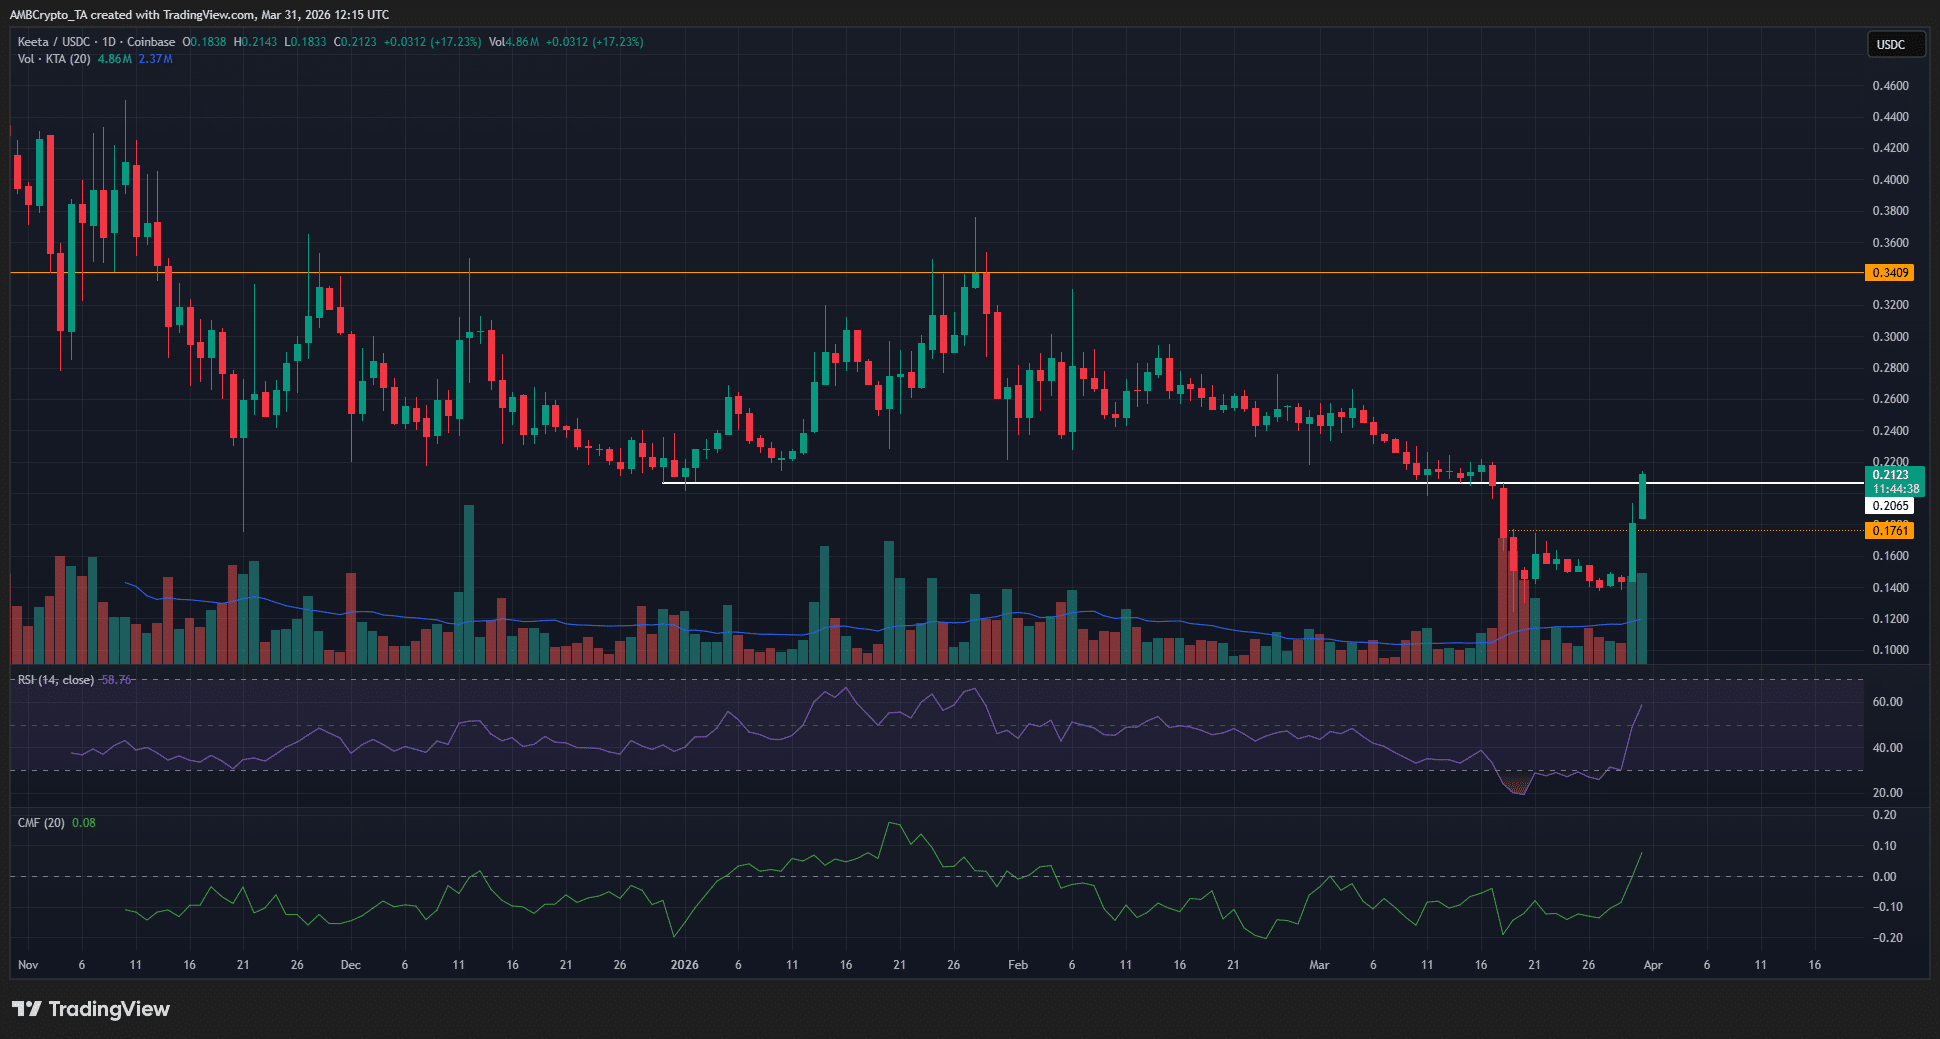
The 1-day chart of the altcoin showed the breakdown below the $0.2 support zone in mid-March. The trading volume on Wednesday, the 18th of March, was the highest single-day volume since Friday, the 12th of December 2025.

The high-volume breakdown below a support level that has held throughout 2026 was significant.

Yet, at the time of writing, KTA was poking its head back above the same resistance zone, which coincides with a psychological round number resistance.

The CMF climbed to +0.08 to indicate heavy buying pressure and sizeable capital inflows. It must be noted that the daily CMF has been negative since the market crash in the first week of February.

Meanwhile, the daily RSI has also recovered to push past neutral 50. This indicated sustainable upward momentum.

Traders’ call to action: Sell!
Source: KTA/USDT on TradingView

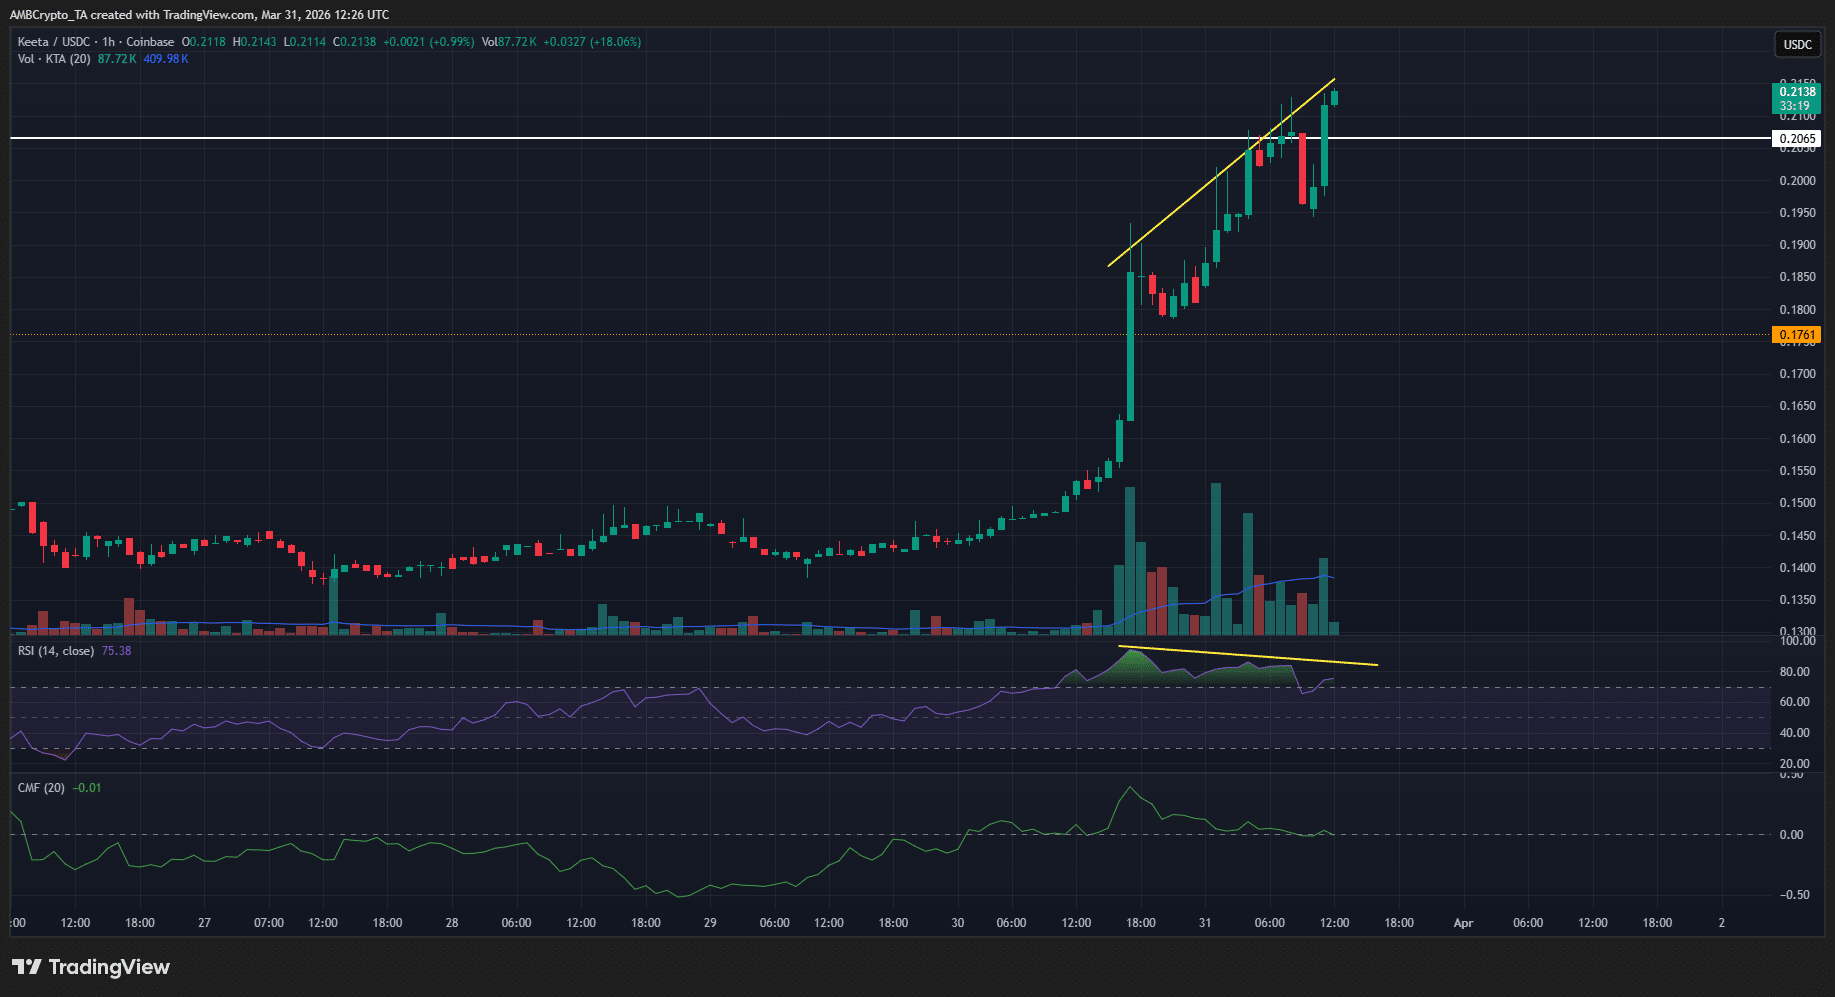
The 1-hour chart showed bullish volume and momentum indicators, but the run could be ending. While the 1-day chart stressed a bearish long-term structure, the 1-hour chart hinted at a pullback toward the $0.176 level, a support from earlier in March.

The CMF was back below +0.05 and, more importantly, the RSI was making a bearish divergence.

This was a clear sign that short-term holders should consider taking profits. As things stand, the longer-term bias means that they should be wary of buying a pullback and expect further losses instead.


Final Summary

  • Keeta saw a 36% rally in the past 24 hours and was back above a support level it lost to the bulls in mid-March.
  • The lower timeframe price chart showed that a pullback is likely, and there was a clear momentum divergence in progress.


Related Questions

QWhat was the percentage increase in Keeta's value in the past 24 hours?

AKeeta experienced a 36.7% rally in the past 24 hours.

QAccording to the article, what is a clear sign that short-term holders should consider taking profits?

AA clear sign is the bearish divergence on the RSI (Relative Strength Index) on the 1-hour chart.

QWhat key support level did KTA break down below in mid-March?

AKTA broke down below the $0.2 support zone in mid-March.

QWhat did the Chaikin Money Flow (CMF) indicator climbing to +0.08 signify?

AThe CMF climbing to +0.08 indicated heavy buying pressure and sizeable capital inflows into KTA.

QDespite the recent rally, what is the longer-term bias for KTA according to the analysis?

AThe longer-term bias is bearish, and the analysis suggests traders should be wary of buying a pullback and expect further losses instead.

Related Reads

Within Strategy's Framework, STRC's Dividend Yield Remains at 12% as Share Price Stays Below Par Value

Michael Saylor, Executive Chairman of Strategy (MSTR), confirmed that the dividend rate for its STRC perpetual preferred shares will remain at 12.00% through August 2026. The rate has increased from 9% at its July 2025 launch to the current high via a "ratchet" mechanism, which permanently raises the rate by 0.5% whenever the share price falls below $95. This mechanism is intended to push the price back toward its $100 par value and support Strategy's "at-the-market" (ATM) program for issuing new shares to fund Bitcoin purchases. However, the mechanism has not worked as intended. STRC shares closed at $89.46 on July 31, remaining about 10-11% below par value despite the record-high dividend. Competition from rival Strive's higher-yielding SATA securities has pressured demand. The persistent discount has forced Strategy to suspend new STRC issuances via its ATM program, limiting this funding channel for Bitcoin acquisitions. STRC's struggles reflect Bitcoin's own volatility, as the preferred shares historically move in tandem. Analysts have warned the ratchet structure carries long-term, one-way risk. A law firm is investigating Strategy's ability to maintain dividend payments if Bitcoin's price stays low. Retail investors own roughly 83% of outstanding STRC shares, a group seen as prone to panic selling during downturns. In response, Strategy has established financial reserves, including a liquidity cushion covering about 26 months of dividend/interest obligations, and a $2 billion share buyback program alongside a Bitcoin monetization framework, though the company emphasized it is not obligated to sell any Bitcoin.

cryptonews.ru30m ago

Within Strategy's Framework, STRC's Dividend Yield Remains at 12% as Share Price Stays Below Par Value

cryptonews.ru30m ago

Analyst: Bitcoin's Price Will Drop to $60k in August, Then Rebound to $70k

Financial analyst Andrey Poroshin has provided a new forecast for Bitcoin's price dynamics in August. Poroshin, an analyst at the Bitbanker exchange, expects the cryptocurrency market to experience a downturn this month, with prices retesting the $60,000 level due to a lack of supportive macroeconomic catalysts. He noted that the recent US Federal Reserve decision to hold interest rates did not significantly impact the market, while inflation remains above the 2% target. Poroshin stated that Bitcoin is ending July under pressure from moderate volatility and a lack of new macroeconomic stimuli, leading to continued market caution. According to his base scenario, Bitcoin will drop to a range of $60,000 to $62,000 before recovering to $70,000. He pointed out that even $70,000 remains below the cost of mining in the US, which has prompted some miners to shift towards AI data center operations. Poroshin cited the winding down of BitMEX's operations as a potential catalyst for a price rebound, suggesting the exit of weaker players often coincides with market reversals and reduced short-term selling pressure. He believes Bitcoin is currently less susceptible to geopolitical shocks, such as the Iran-US conflict, and does not expect significant market changes in August related to the pending CLARITY Act. Looking ahead, Poroshin forecasts that September will bring more active price fluctuations driven by potential Fed rate decisions and possible discussions or approval of the CLARITY Act.

cryptonews.ru30m ago

Analyst: Bitcoin's Price Will Drop to $60k in August, Then Rebound to $70k

cryptonews.ru30m ago

Trading

Spot
活动图片