Glassnode: Crypto Market in 'Late Bear Market Bottoming Phase', Three Core Signals Absent, Bitcoin Reversal Still Requires Time

marsbitPublished on 2026-07-10Last updated on 2026-07-10

Abstract

According to a Glassnode analysis, the cryptocurrency market is currently in the late stages of a bear market bottom formation. Bitcoin's price has remained below key realized price and short-term holder cost benchmarks for five months, indicating deep undervaluation. A major source of sell-side pressure is from long-term holders realizing losses, with their daily loss-taking recently peaking at $280 million, the highest level since December 2022. While spot Bitcoin ETF outflows have moderated, they remain in a state of monthly net negative flows, and trading volumes are approximately 80% below their 2025 peak, signaling a lack of robust institutional demand. In derivatives markets, positioning has shifted to a cautiously bullish stance. However, options volatility surfaces still price in downside risk, and the spot price sits below the "Max Pain" strike level. The report concludes that the necessary conditions for a market bottom are in place, but a confirmed reversal requires three core signals: a sustained decline in long-term holder loss realization, a stabilization in ETF fund flows, and a sustained price recovery above the Realized Price. Until these signals emerge, a full transition to a bull market is unlikely to occur imminently.

Authors:CryptoVizArt, Frederik Theissen, Glassnode

Compiled by:Luffy, Foresight News

Bitcoin price has been below the true market average and the cost basis of short-term holders for five consecutive months, residing in a deeply undervalued zone.

The proportion of losses realized by long-term holders relative to total on-chain realized losses has now risen to 43%, with the daily peak of loss realization reaching $280 million, the highest level since December 2022. The outflow of spot ETF funds has moderated but still maintains a state of monthly net outflows; ETF daily average trading volume remains in the range of $650 million to $950 million, shrinking approximately 80% from the peak in October 2025, indicating institutional buying demand has not yet stabilized.

Derivatives positioning has shifted to cautiously bullish, with the put/call ratio dropping to its lowest level in 2026; however, the options volatility skew still maintains a defensive premium, and the spot price remains significantly below the max pain price. The market has entered the late stage of bottoming, and the continuous narrowing of selling pressure from long-term holders is an important precondition for a market reversal and recovery.

Macro Perspective

Oil Surges, Risk Assets Under Collective Pressure

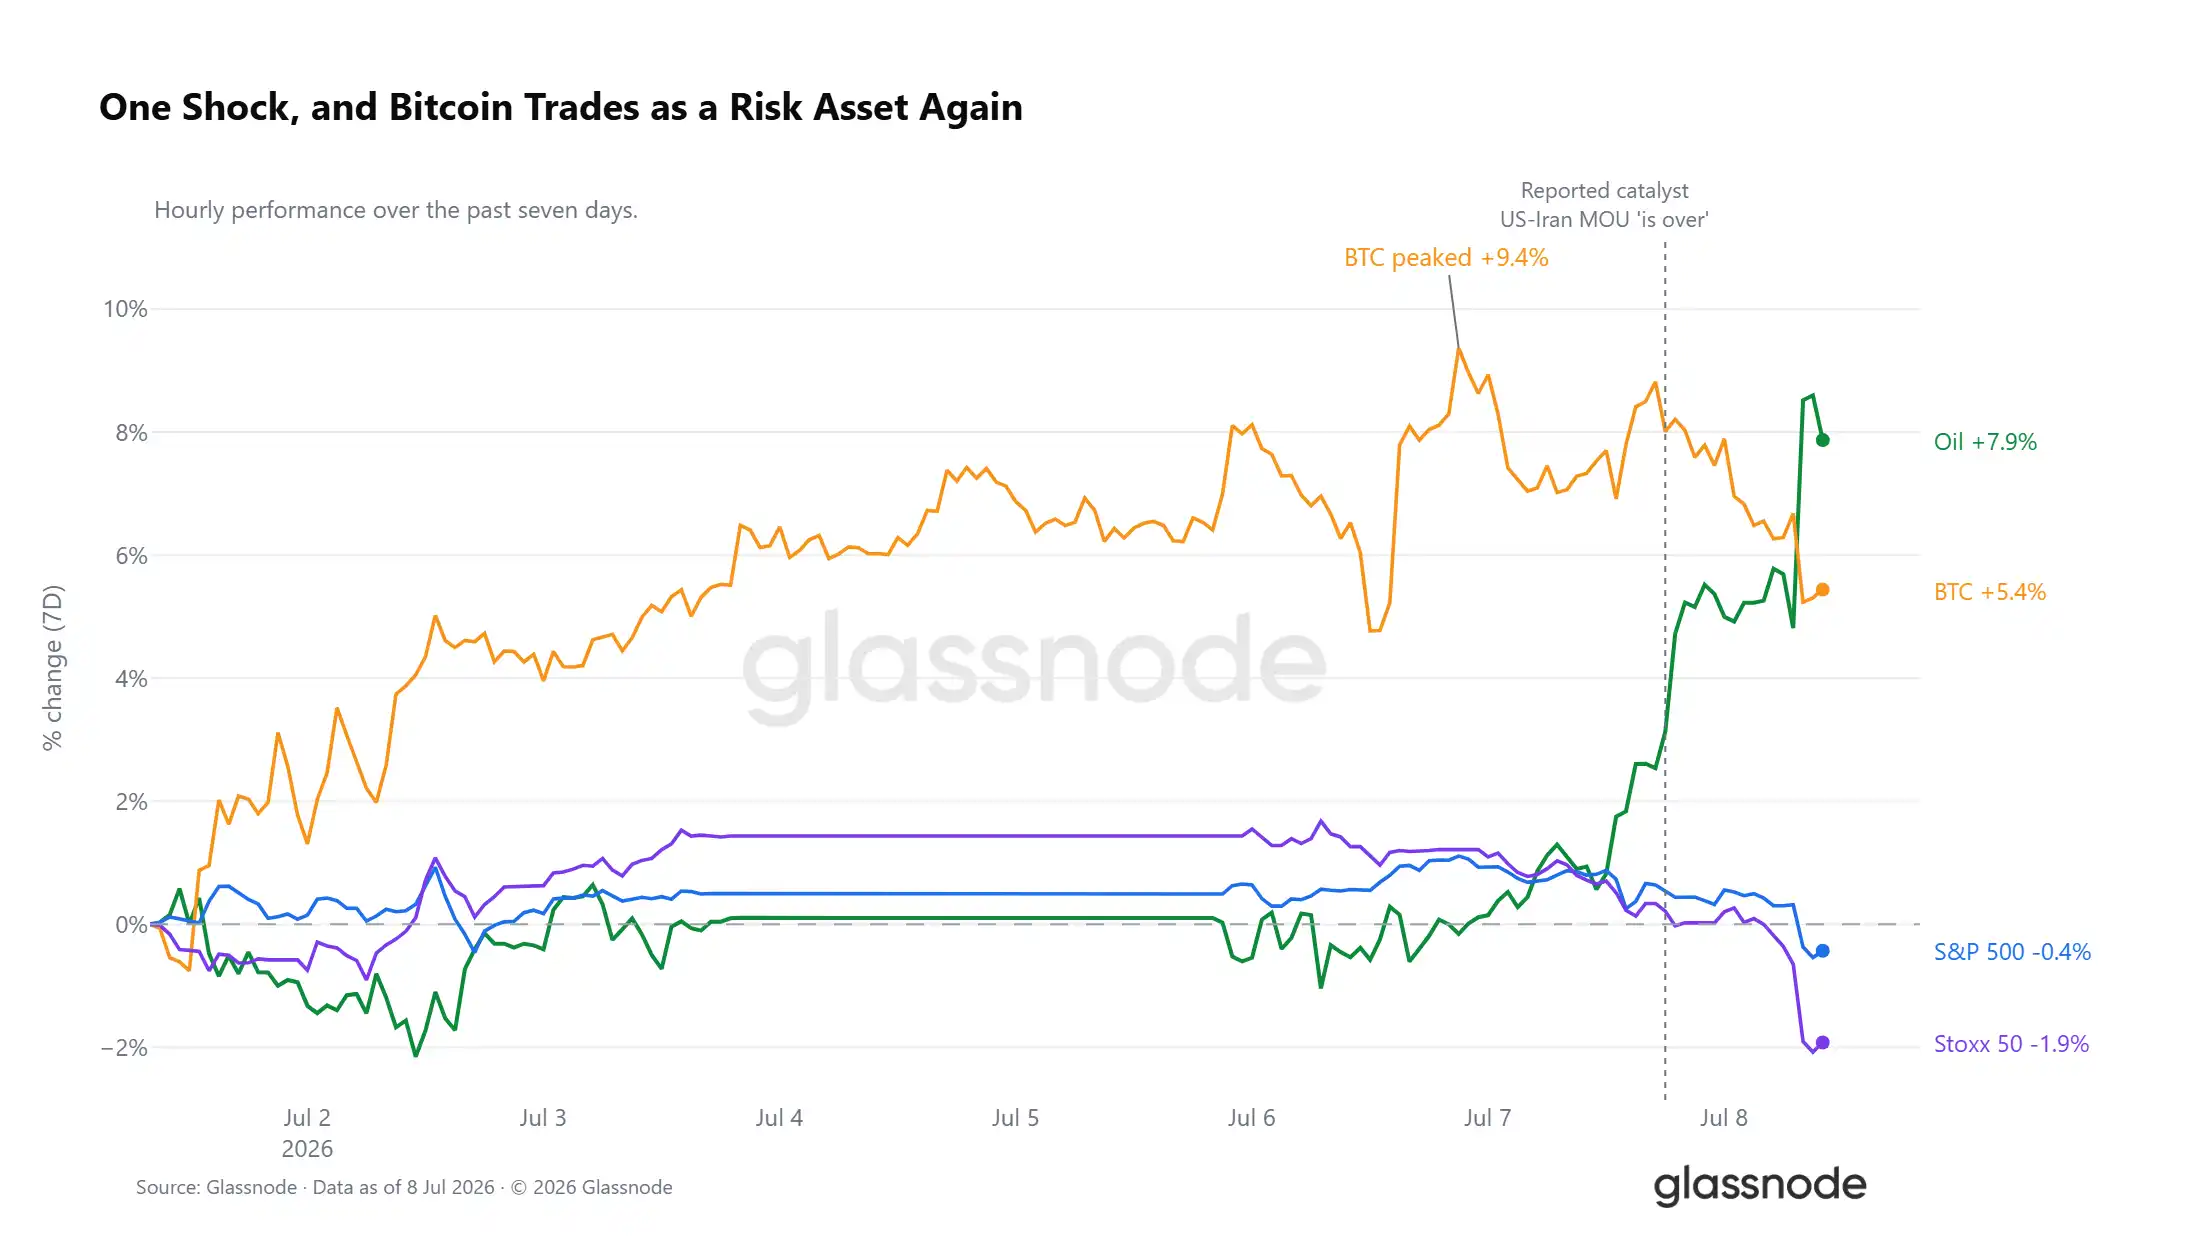
Over the past 7 trading days, WTI crude oil has cumulatively risen by 7.9%, with the majority of gains concentrated in recent sessions. News emerged that the US-Iran Memorandum of Understanding has expired, an impact that has rippled across all asset markets. Bitcoin's weekly gain peaked at 9.4% but has now retreated to a 5% weekly gain; the S&P 500 and Euro Stoxx indices have all turned negative, with European stocks leading the decline among global risk assets. Currently, Bitcoin's movement is highly synchronized with risk assets.
Liquidity Environment: Long-Short Contradictions Intensify

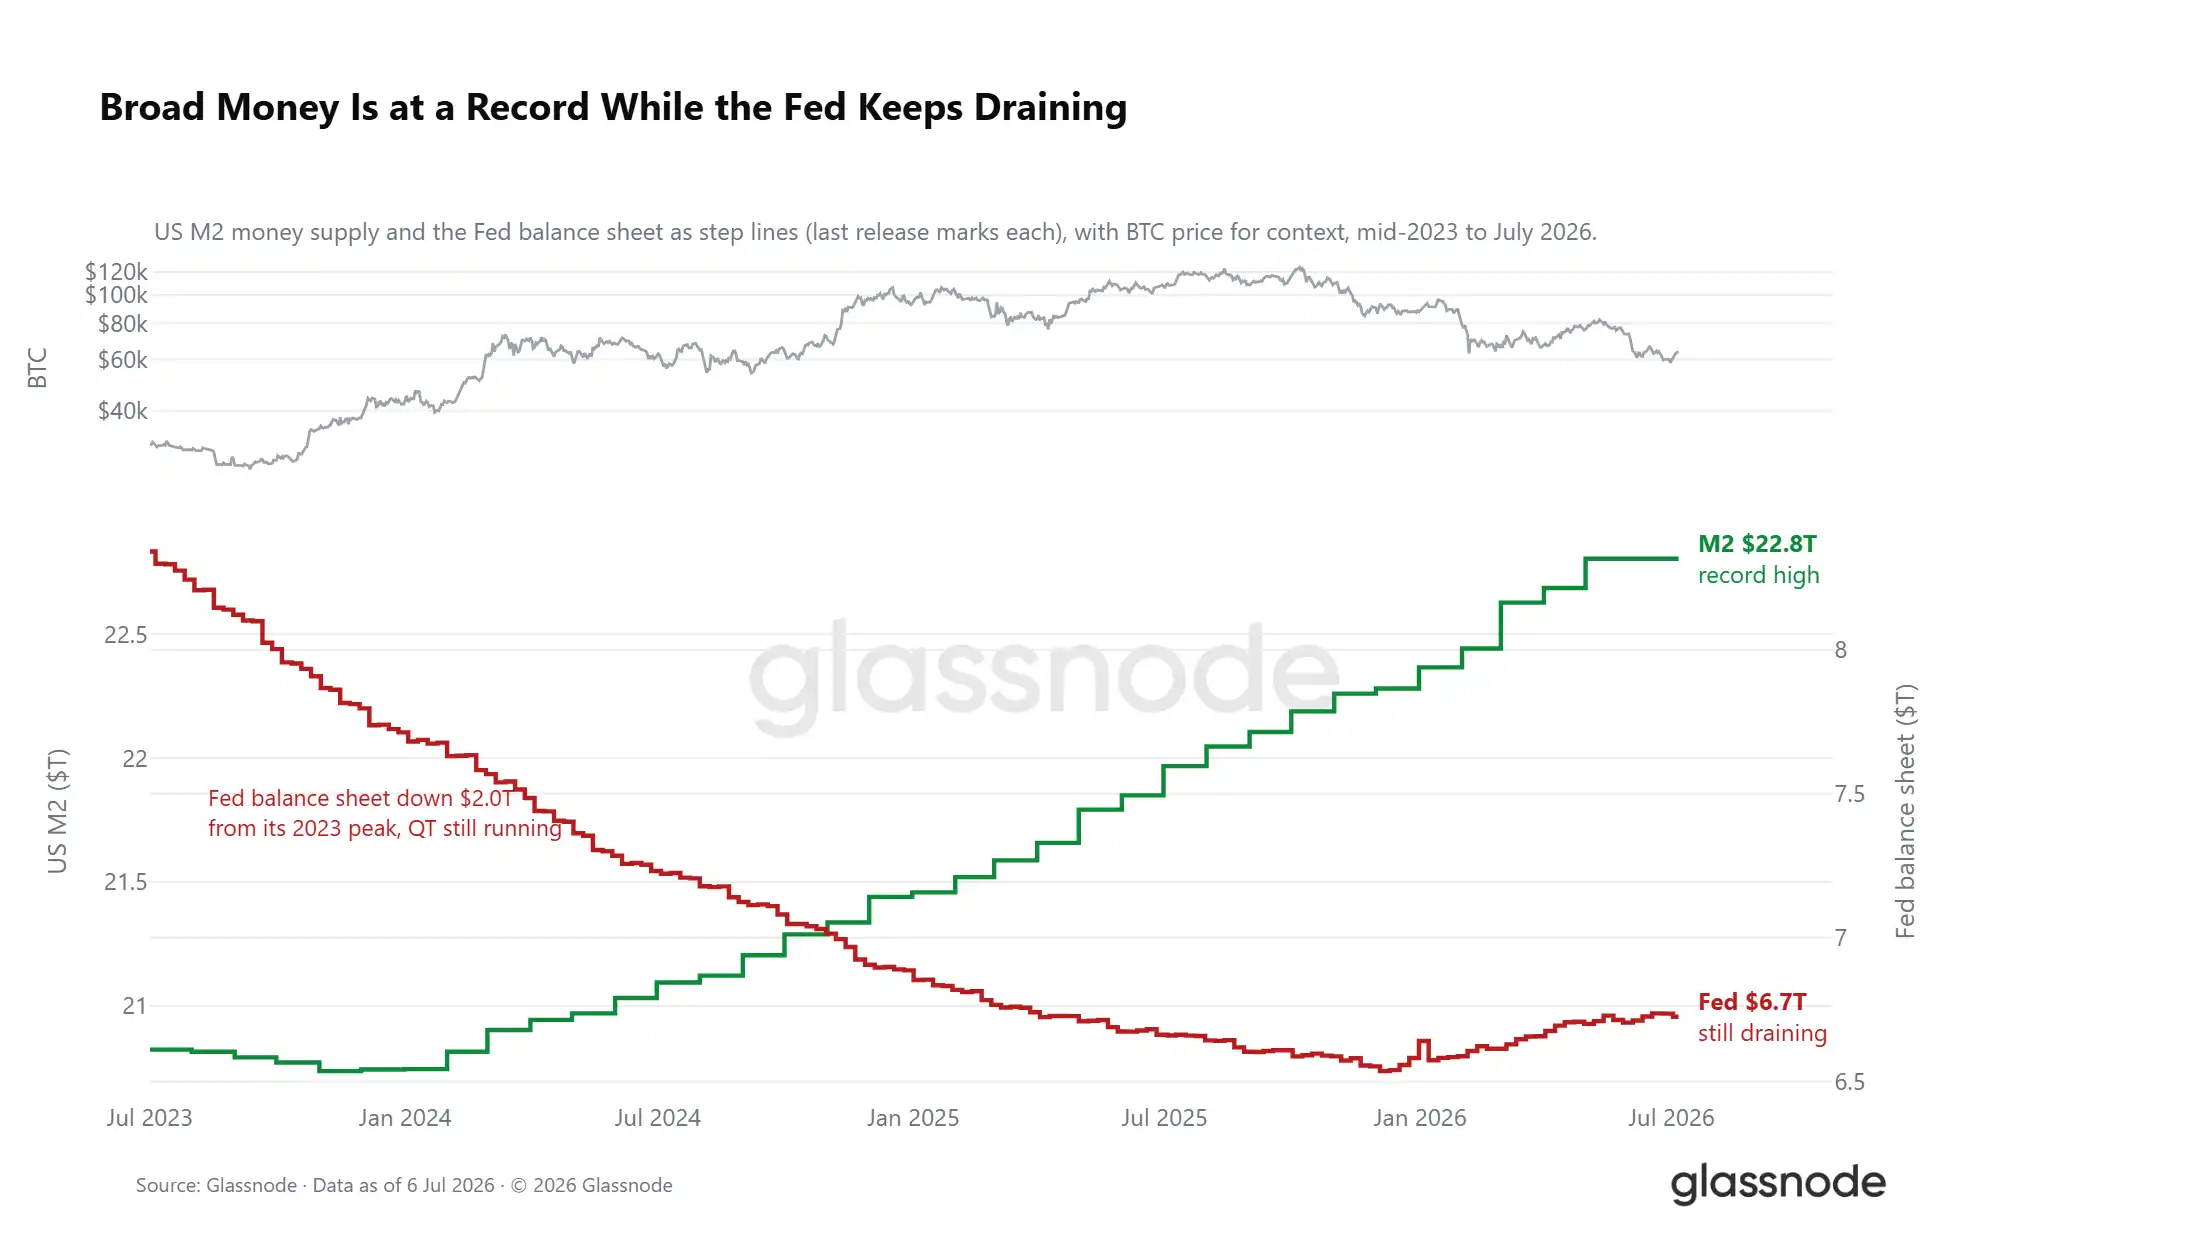
Amid external shocks from oil, the market's liquidity environment presents a contradictory picture. The total U.S. broad money supply (M2) has climbed to a new historical high of $22.8 trillion. Historically, broad money expansion cycles tend to boost market risk appetite; however, the Federal Reserve's balance sheet continues to shrink, with its current size down by $2 trillion from the 2023 peak. These two liquidity signals create a strong counterforce: the total broad money supply continues to rise while the quantitative tightening process persists, with real interest rates hovering near 1%, keeping the opportunity cost of holding non-yielding digital assets high. The macro-level favorable window is not completely closed but has not formed clear accommodative support either.
On-Chain Data

A Deeply Undervalued Zone Spanning Five Months

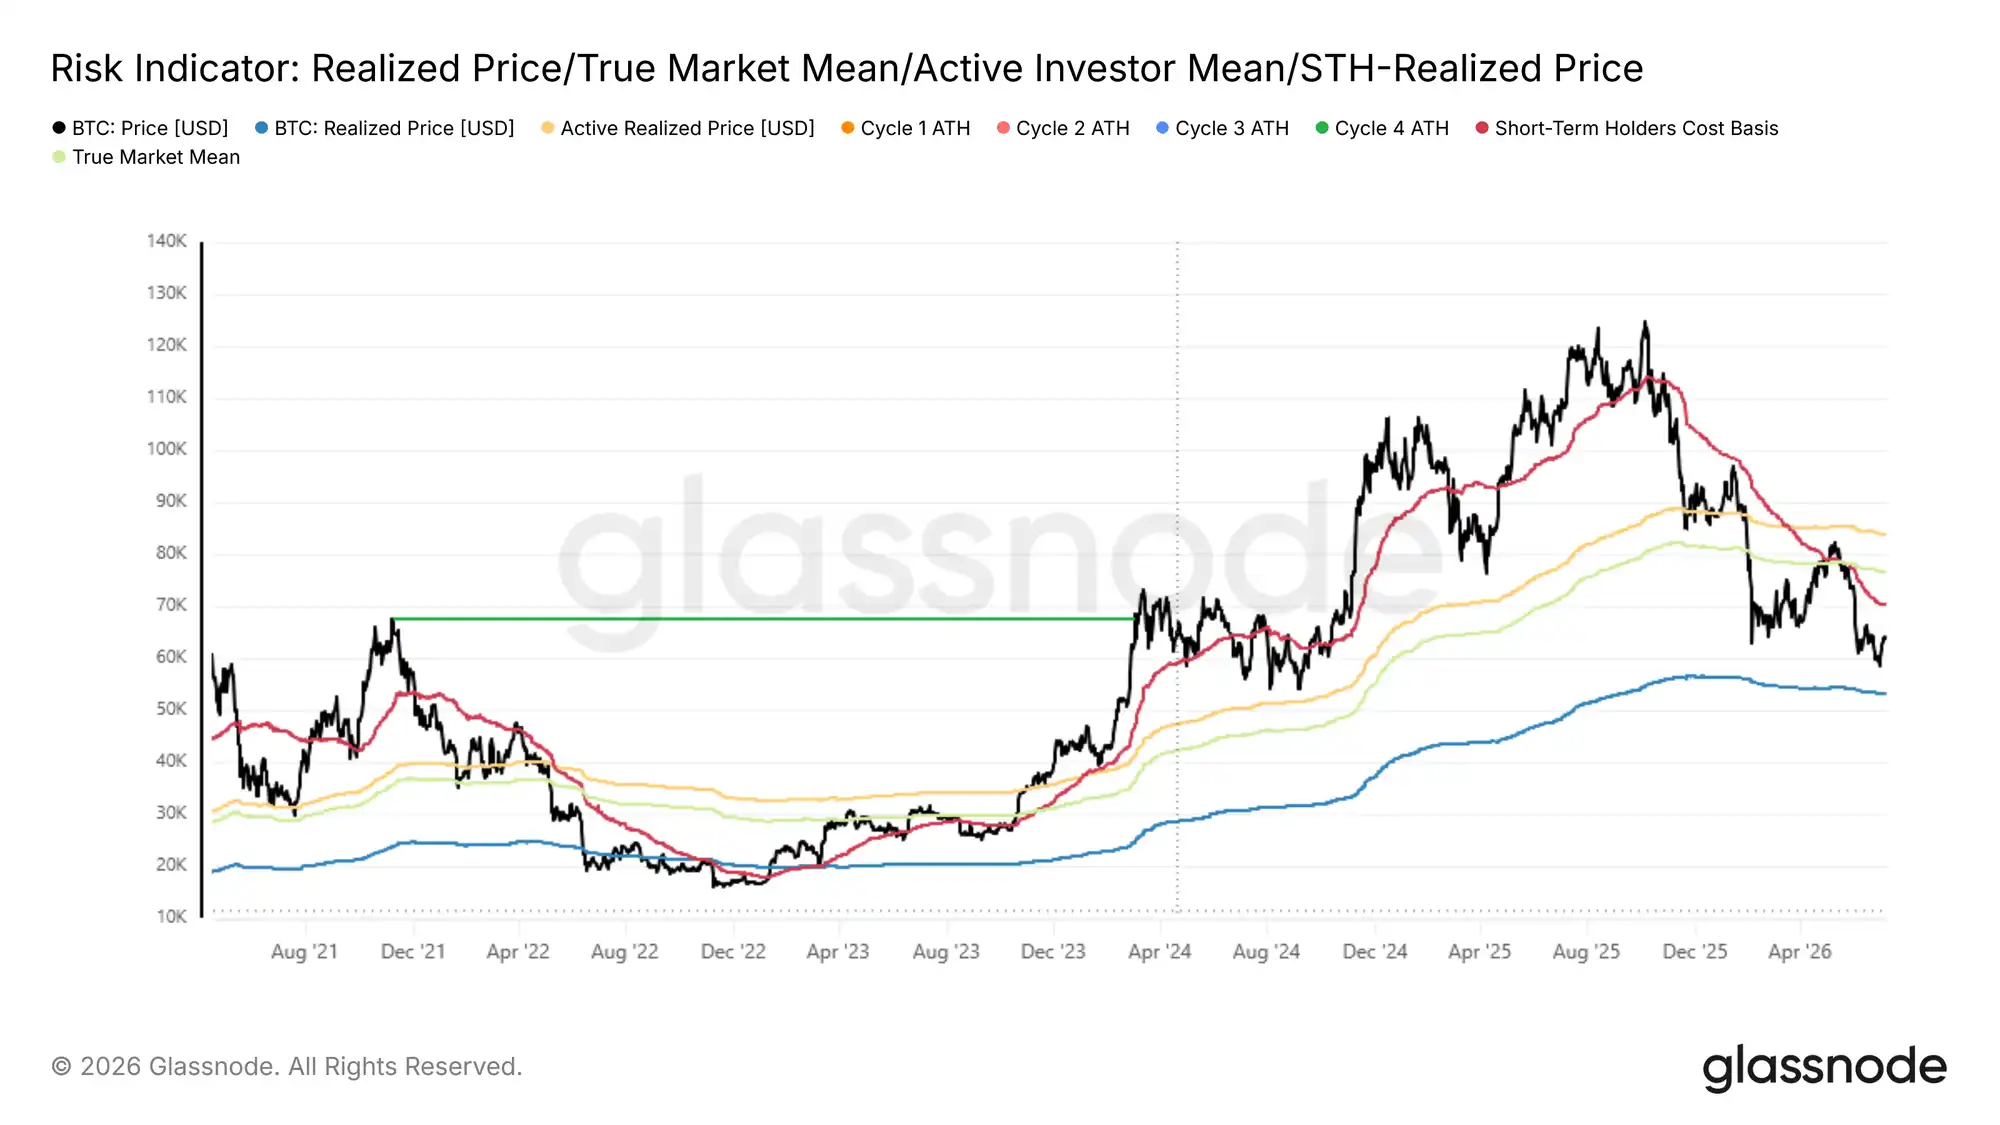
Over the past week, Bitcoin rebounded from $58,300 to $64,400, showing a short-term recovery, but the price remains significantly below the true market average of $76,600 and the short-term holder cost basis of $72,200. Only when the price reclaims these two key levels can the market exit the deeply undervalued zone; otherwise, the price action remains susceptible to declines catalyzed by external negative news.

The duration of this discount phase is noteworthy. Since early February 2026, the price has persistently traded below the cost basis of active investors and the break-even line for recent entrants, lasting nearly five months, which qualifies as a relatively long-lasting deep discount cycle in Bitcoin's history.

Continued high-volume coin distribution within a prolonged discount zone, with fresh capital consistently accumulating below the cost basis of earlier buyers and the entire market's active holdings, has historically formed the foundation for major cycle bottoms, offering long-term allocation appeal for value investors. Various metrics indicate the bottoming process has entered its later stages, but the possibility of a retest to $53,000 cannot be entirely ruled out.
Concentrated Stop-Loss Selling by Long-Term Holders with High-Cost Basis

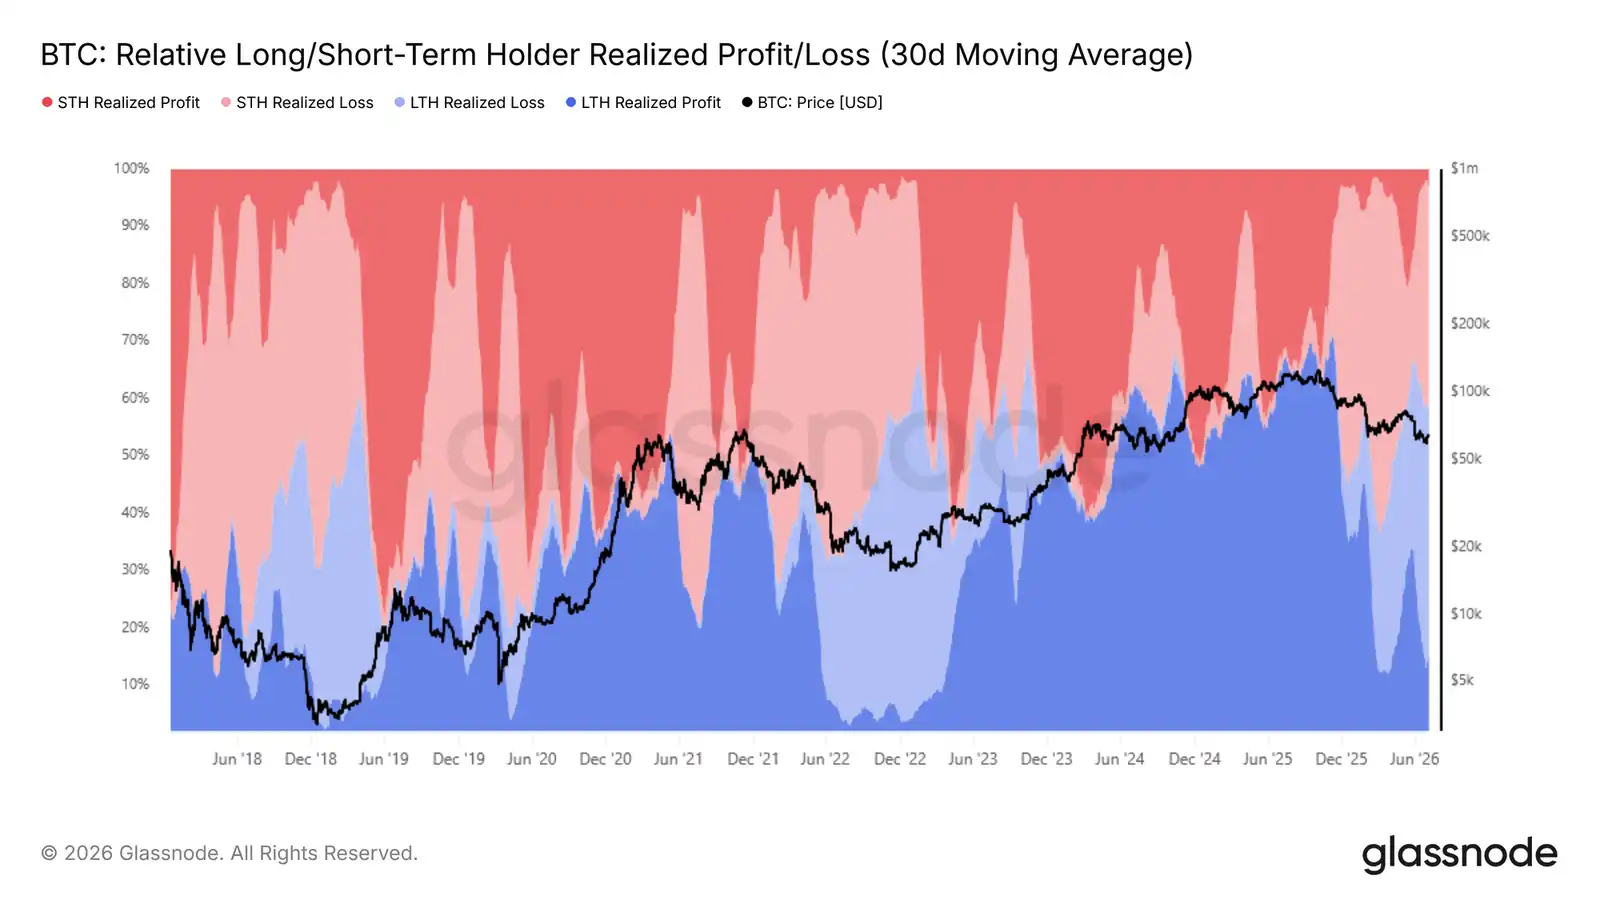
The market is constructing a cyclical bottom. The core question now is identifying the primary source of selling pressure. The relative indicator of profit/loss realization by long/short-term holders analyzes the distribution proportion of the entire market's on-chain realized profit/loss between these two holding groups, directly reflecting the scale share of each group's profit/loss realization.

After the price fell below the true market average, the 30-day moving average share of loss realization by long-term holders has climbed from around 15% in early February 2026 to the current 43%. Loss-driven selling pressure from this group has become the most dominant bearish force suppressing the price.

These investors mostly entered near the cycle highs. After enduring months of deep drawdowns, their confidence is gradually depleted, leading to concentrated exits. This coin structure directly explains why every recovery rally faces concentrated selling from deeply entrenched positions, preventing the price from solidifying above the upper bound of the current range.
Stop-Loss Selling Pressure Yet to Show Signs of Abating

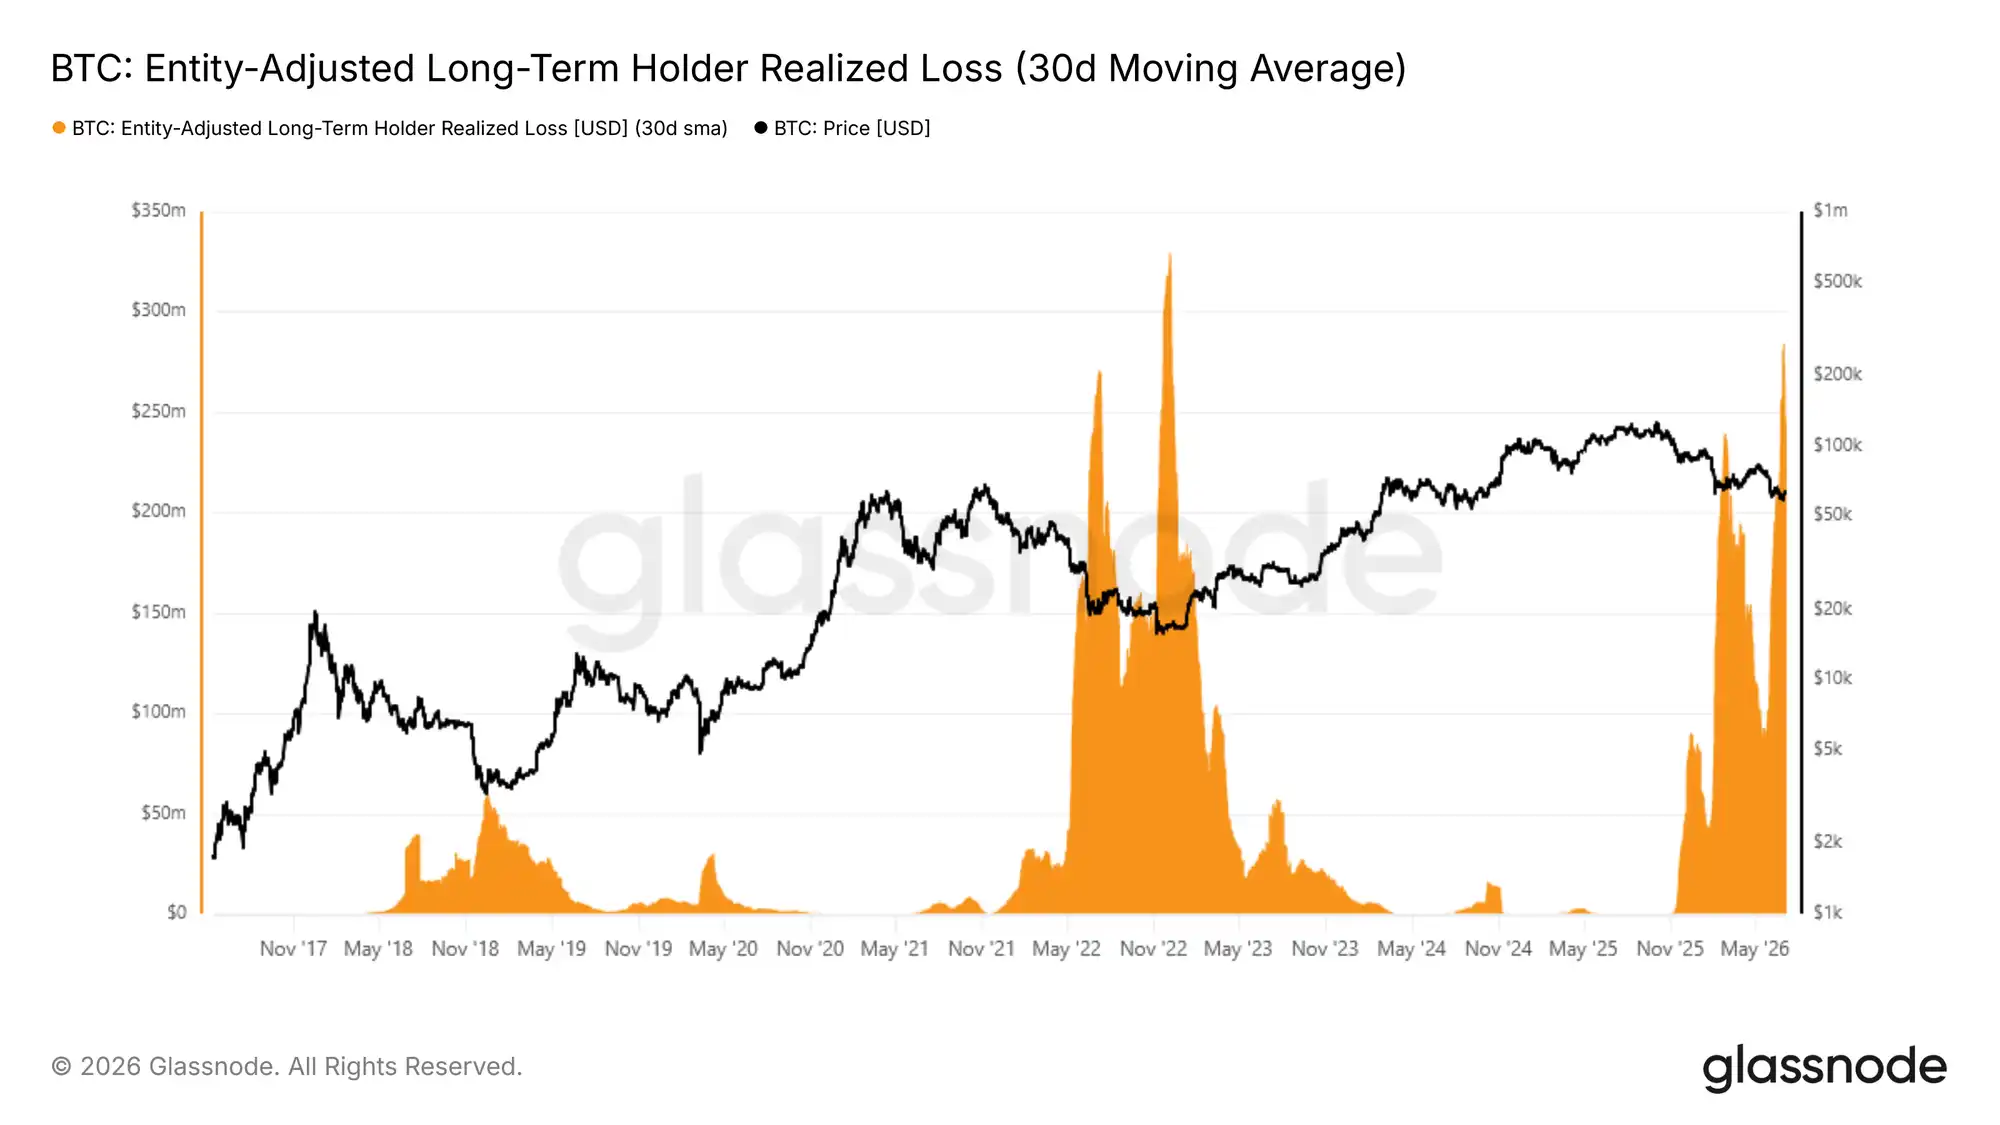
Long-term holder loss realization has become the market's primary downward pressure. The next key observation is whether this selling pressure begins to subside.

The entity-adjusted long-term holder realized loss indicator (30-day smoothed average) tracks the loss amount from sales by users holding coins for over 155 days, excluding internal address transfers, accurately reflecting genuine stop-loss exit behavior. This indicator recently hit a new daily peak, with daily loss realization volume around $280 million, the highest since December 2022, marking the second major wave of long-term holder stop-loss selling in this bear market.

The key difference is that after the first peak, selling pressure showed a temporary decline, whereas the current wave has yet to show a contraction in scale. Only when this indicator shows a clear downward trend will the market possess the foundational conditions for a shift towards a bull market. Its trajectory in the coming weeks to months will be the core signal for judging whether the market has truly completed selling pressure capitulation.
Off-Chain Markets

ETF Outflows Slow, But Outflow Trend Not Reversed

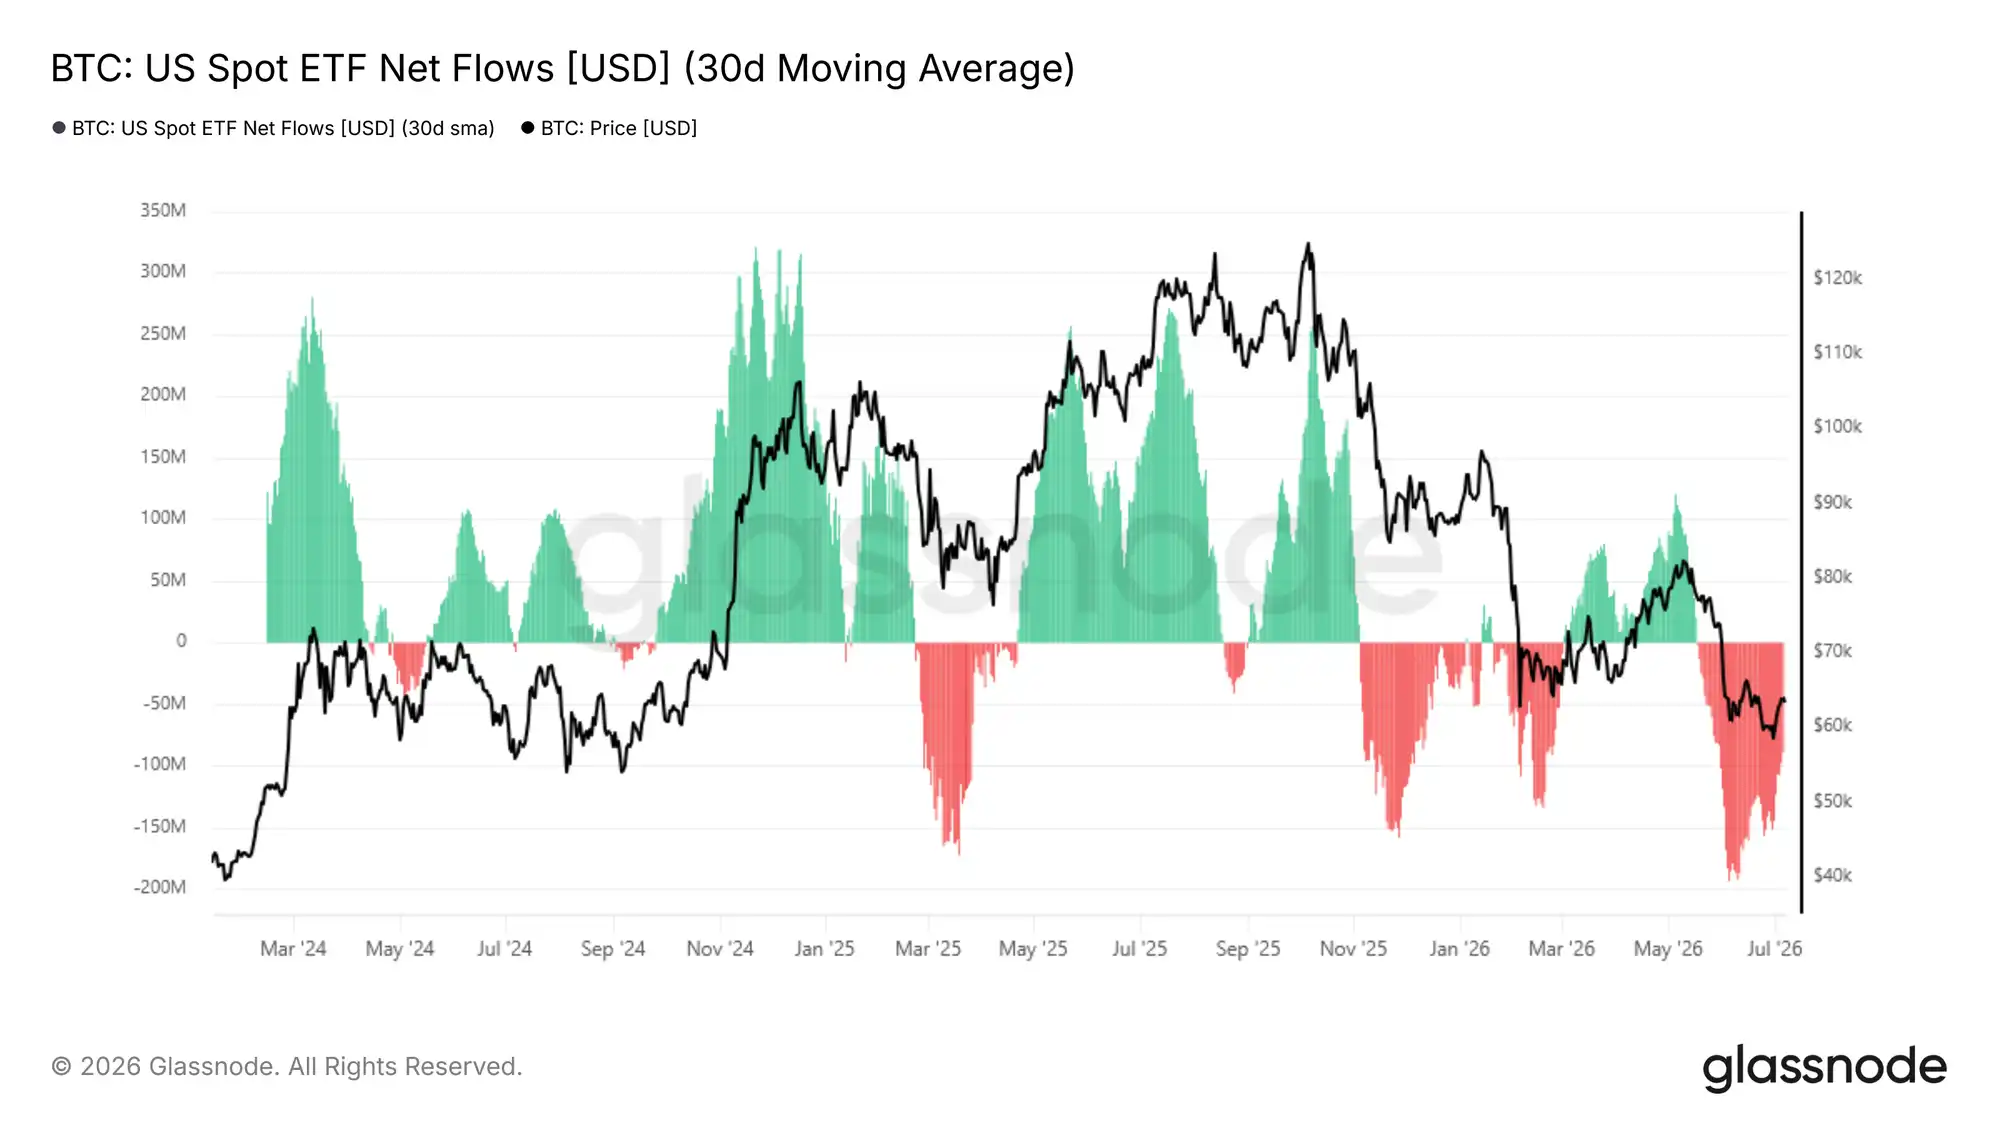
Shifting from on-chain to off-chain markets, spot ETF fund flows directly reflect institutional capital behavior. The 30-day moving average of ETF net flows indicates the daily net capital inflow/outflow from U.S. spot Bitcoin ETFs, smoothing out daily volatility to reveal underlying trends in institutional holdings.

Since mid-May 2026, this indicator entered a zone of monthly net outflows, with a daily outflow peak reaching $193 million in early June, now receded to a daily net outflow of $88.9 million. The moderation in outflow scale is a faint positive, but the market continues to see monthly capital outflows, and institutional buying demand has not stabilized. Only when the fund flow trend narrows consistently towards a balanced range can one reasonably anticipate a short-term expansionary rally.
Institutional Trading Volume Remains Sluggish

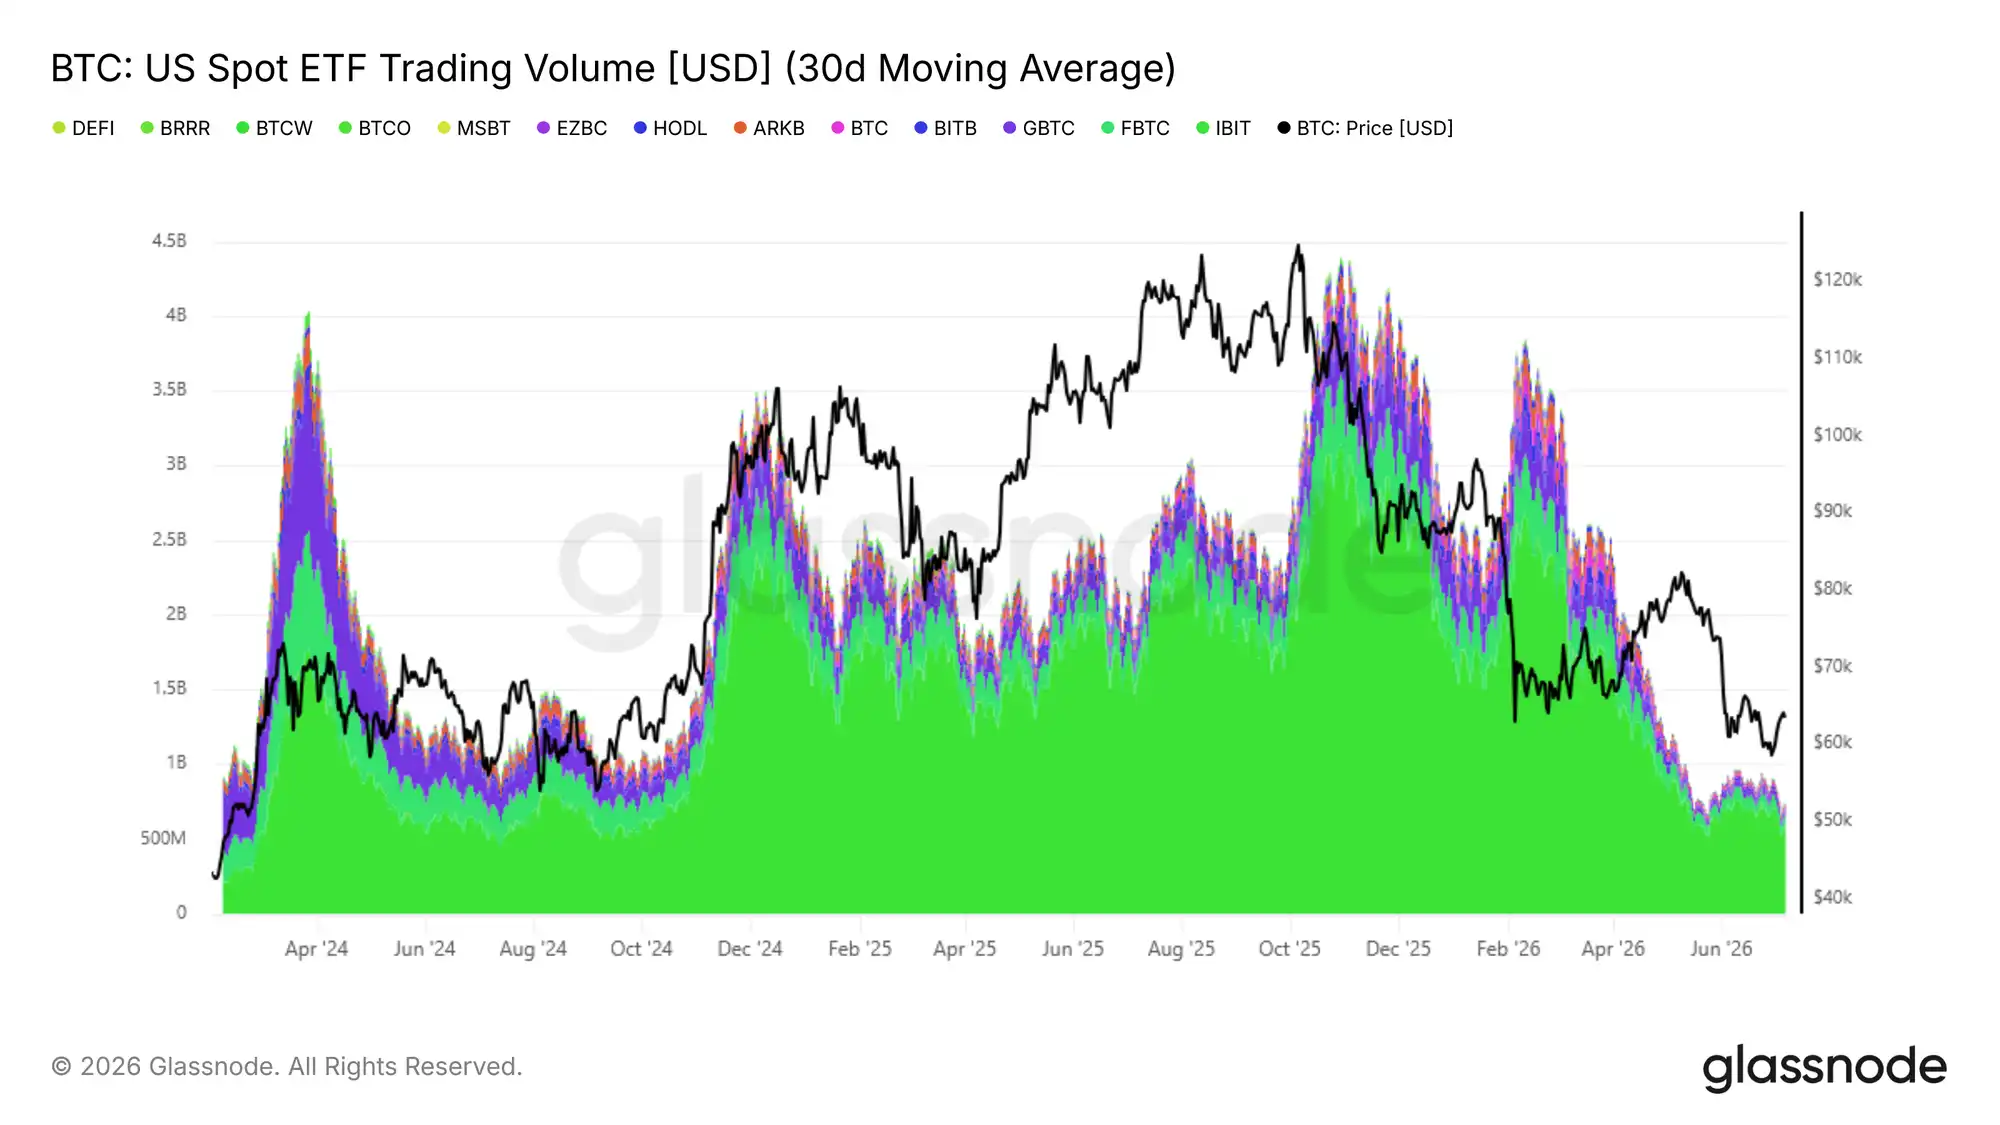
In addition to net flow data, U.S. spot ETF trading volume helps gauge the degree of institutional confidence recovery. The 30-day moving average of ETF daily trading volume currently fluctuates between $650 million and $950 million, a level comparable to Q4 2024, but also about 80% lower than the daily peak of $4.4 billion set in October 2025.

Current trading volume only represents basic institutional participation, remaining extremely low compared to bull market peaks, indicating that medium-to-long-term bullish confidence among ETF investors has not materially returned. Only when daily average trading volume shows sustained expansion *and* net outflow scale continuously narrows, with both signals appearing simultaneously, can institutional demand recovery be confirmed. Until both metrics improve in tandem, off-chain data aligns with on-chain indicators, suggesting the overall market remains in a bear market-dominated regime.
Derivatives Market

Short Covering, Positioning Shifts to Cautiously Bullish

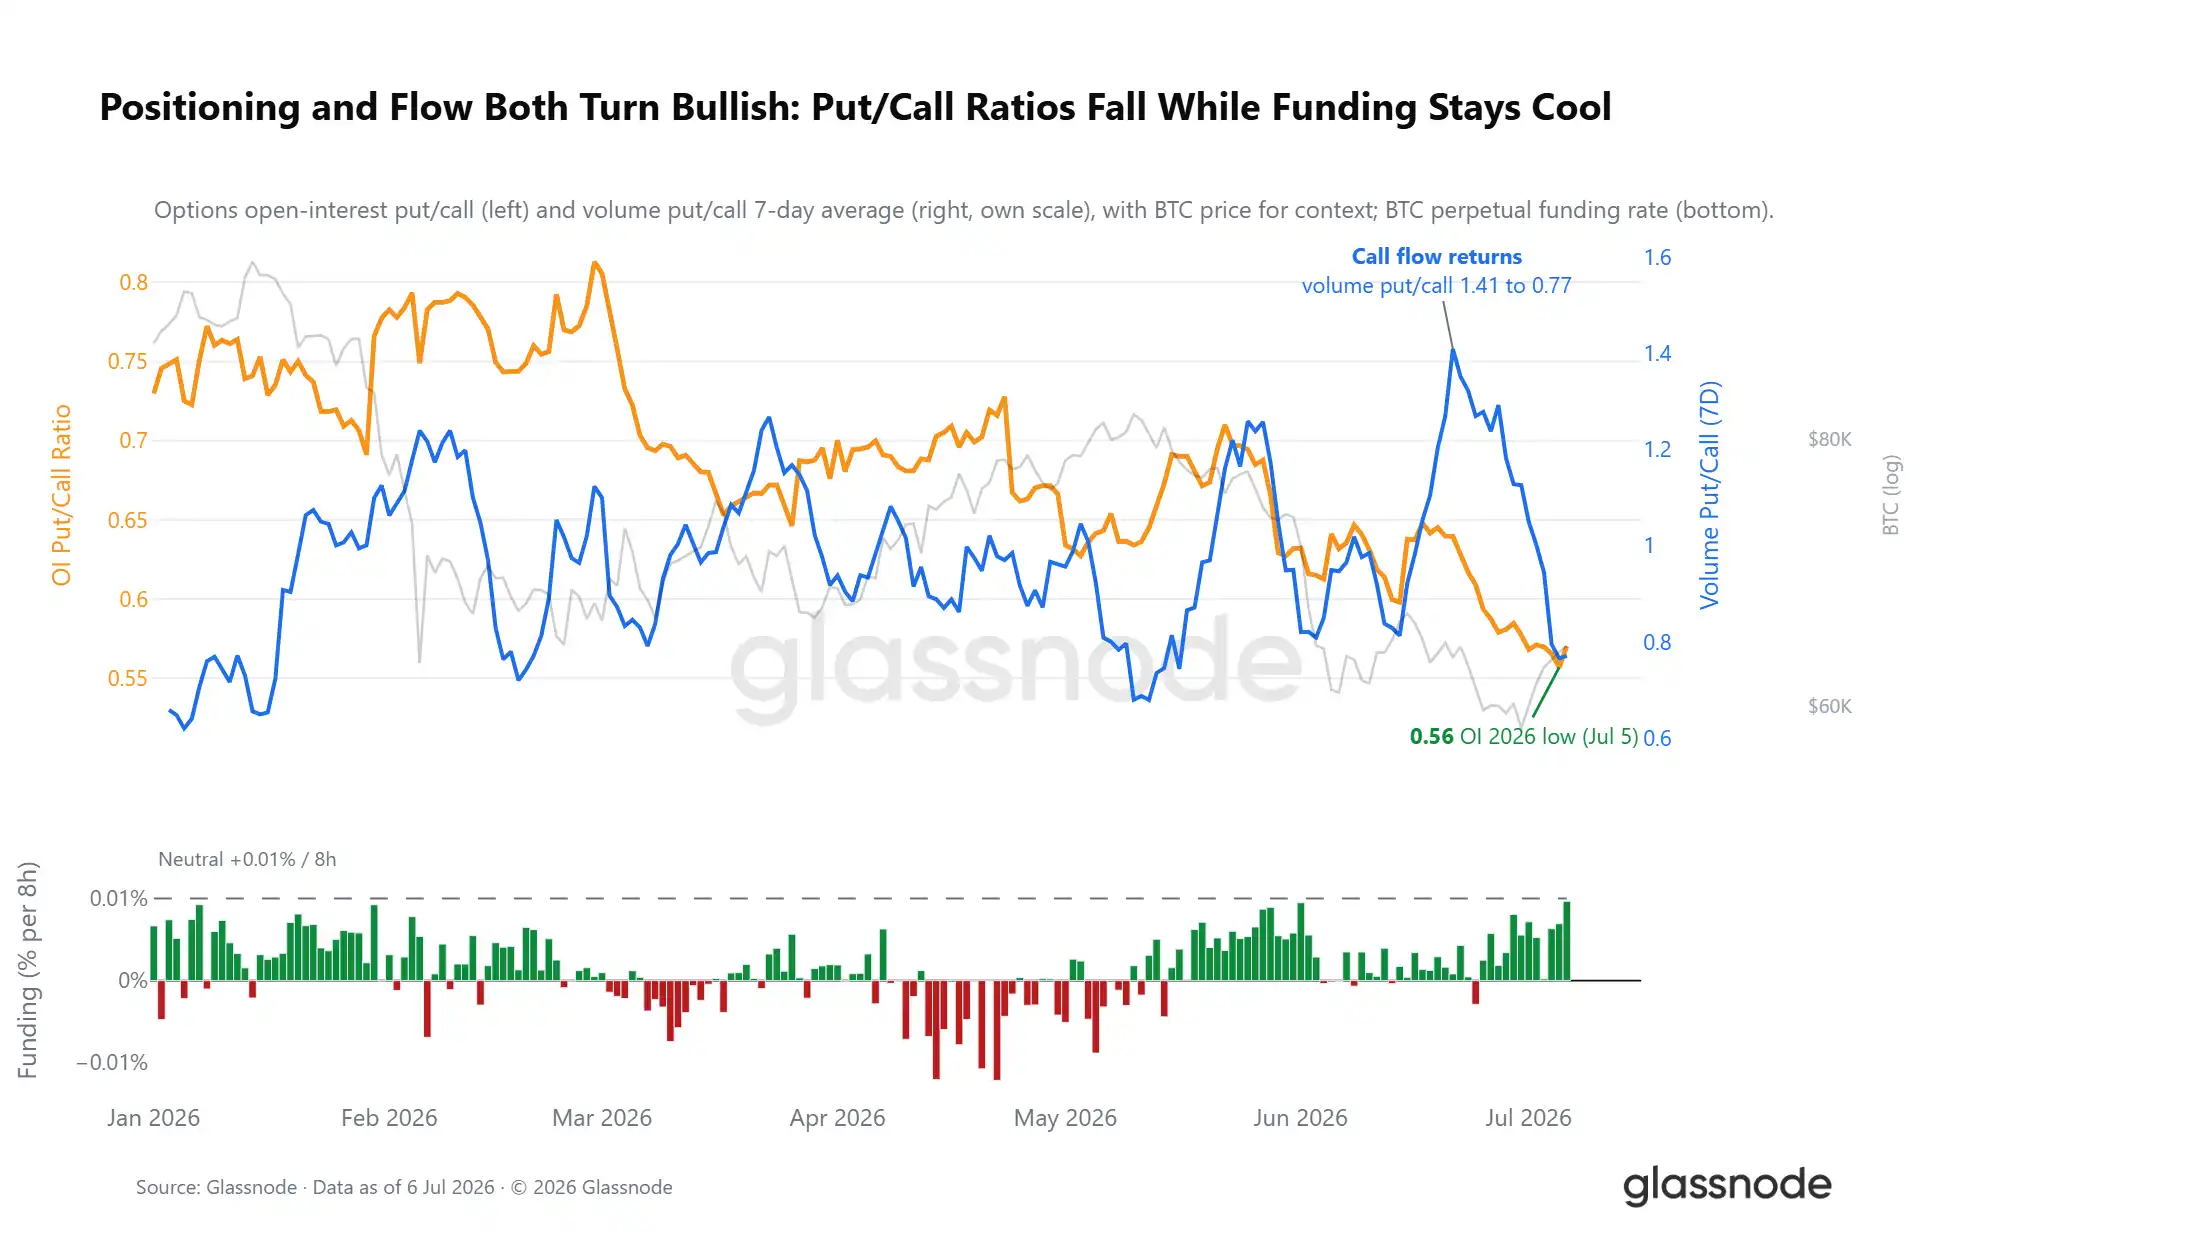
Despite the price action reflecting weak risk sentiment, derivatives positioning structure has already shown a reverse shift. The put/call open interest ratio has dropped to 0.56, the lowest level in 2026, meaning the market currently has one put contract for every two call contracts. Options trading flow corroborates this trend: two weeks ago during Bitcoin's second retest of lows, the market frantically bought puts for hedging, causing the put/call trading ratio to surge sharply; as call buying steadily returned, this ratio quickly declined, even though the spot price has only partially recovered its losses.

Perpetual swap funding rates also support the positioning shift. The average perpetual swap funding rate has long been below the 0.01% long-short equilibrium line, far from levels seen in crowded long trades. The derivatives market has completed its short risk clearance and has turned cautiously bullish overall amid external negative shocks, a stark contrast to the crowded short positioning structure before the previous major decline.
Options Skew Still Prices in Downside Risk

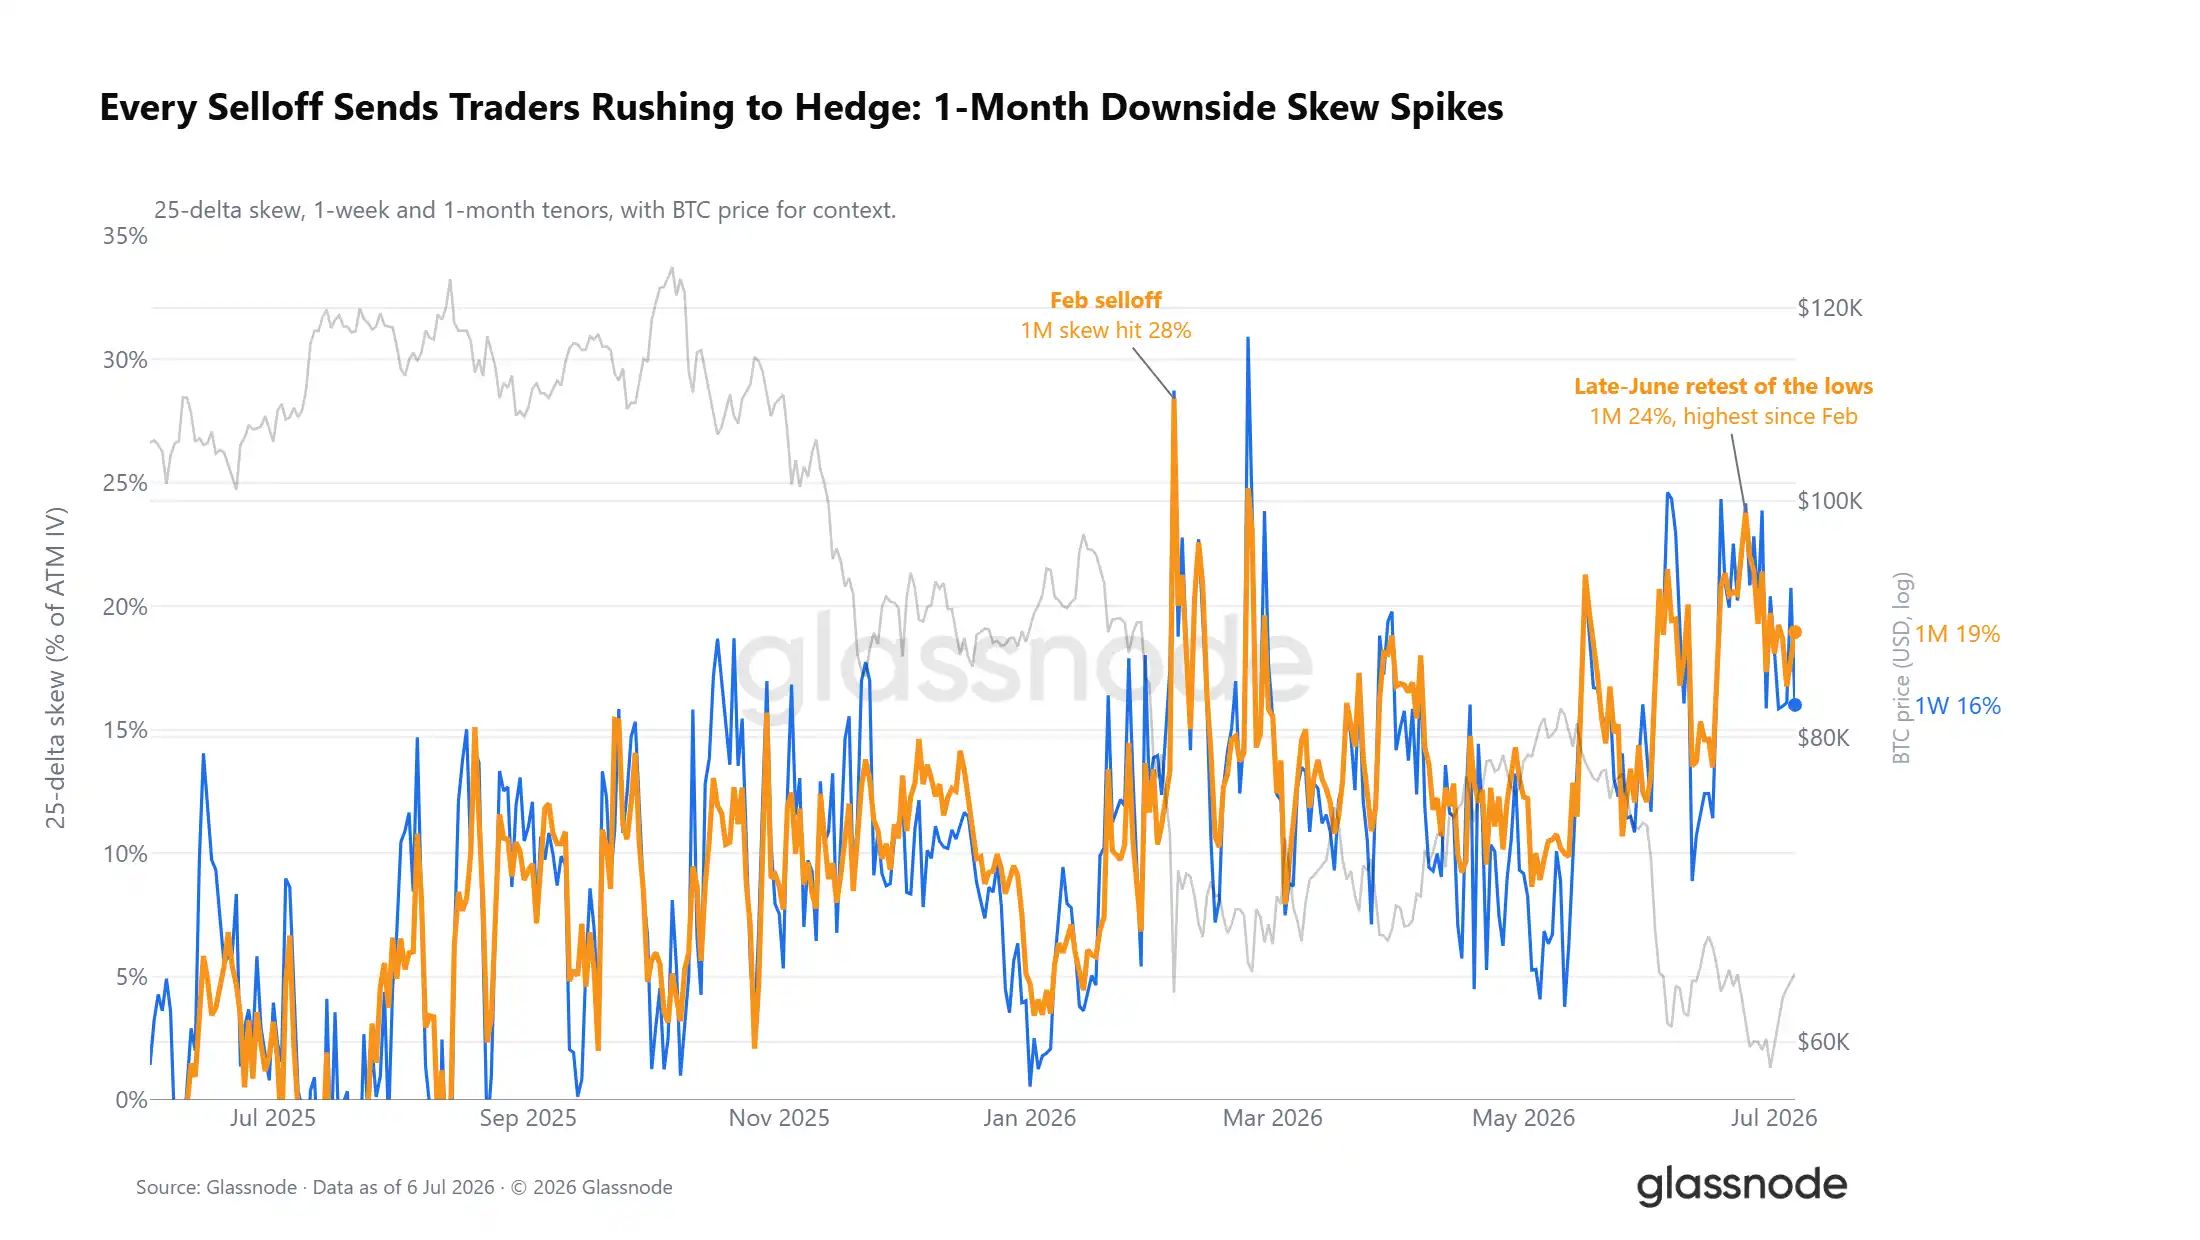
While overall positioning leans bullish, the options volatility skew sends an opposite signal. The 25-delta volatility skew indicator (premium for downside protection relative to upside gain) maintains a premium across all expiration dates. Every sell-off this year has pushed this premium higher, and at the end of June it surged to 24%, marking the strongest defensive sentiment for near-month contracts since the February crash. Even with the market leaning long, traders are still willing to pay a premium to buy downside hedging instruments.
Spot Price Deviates from Max Pain Price

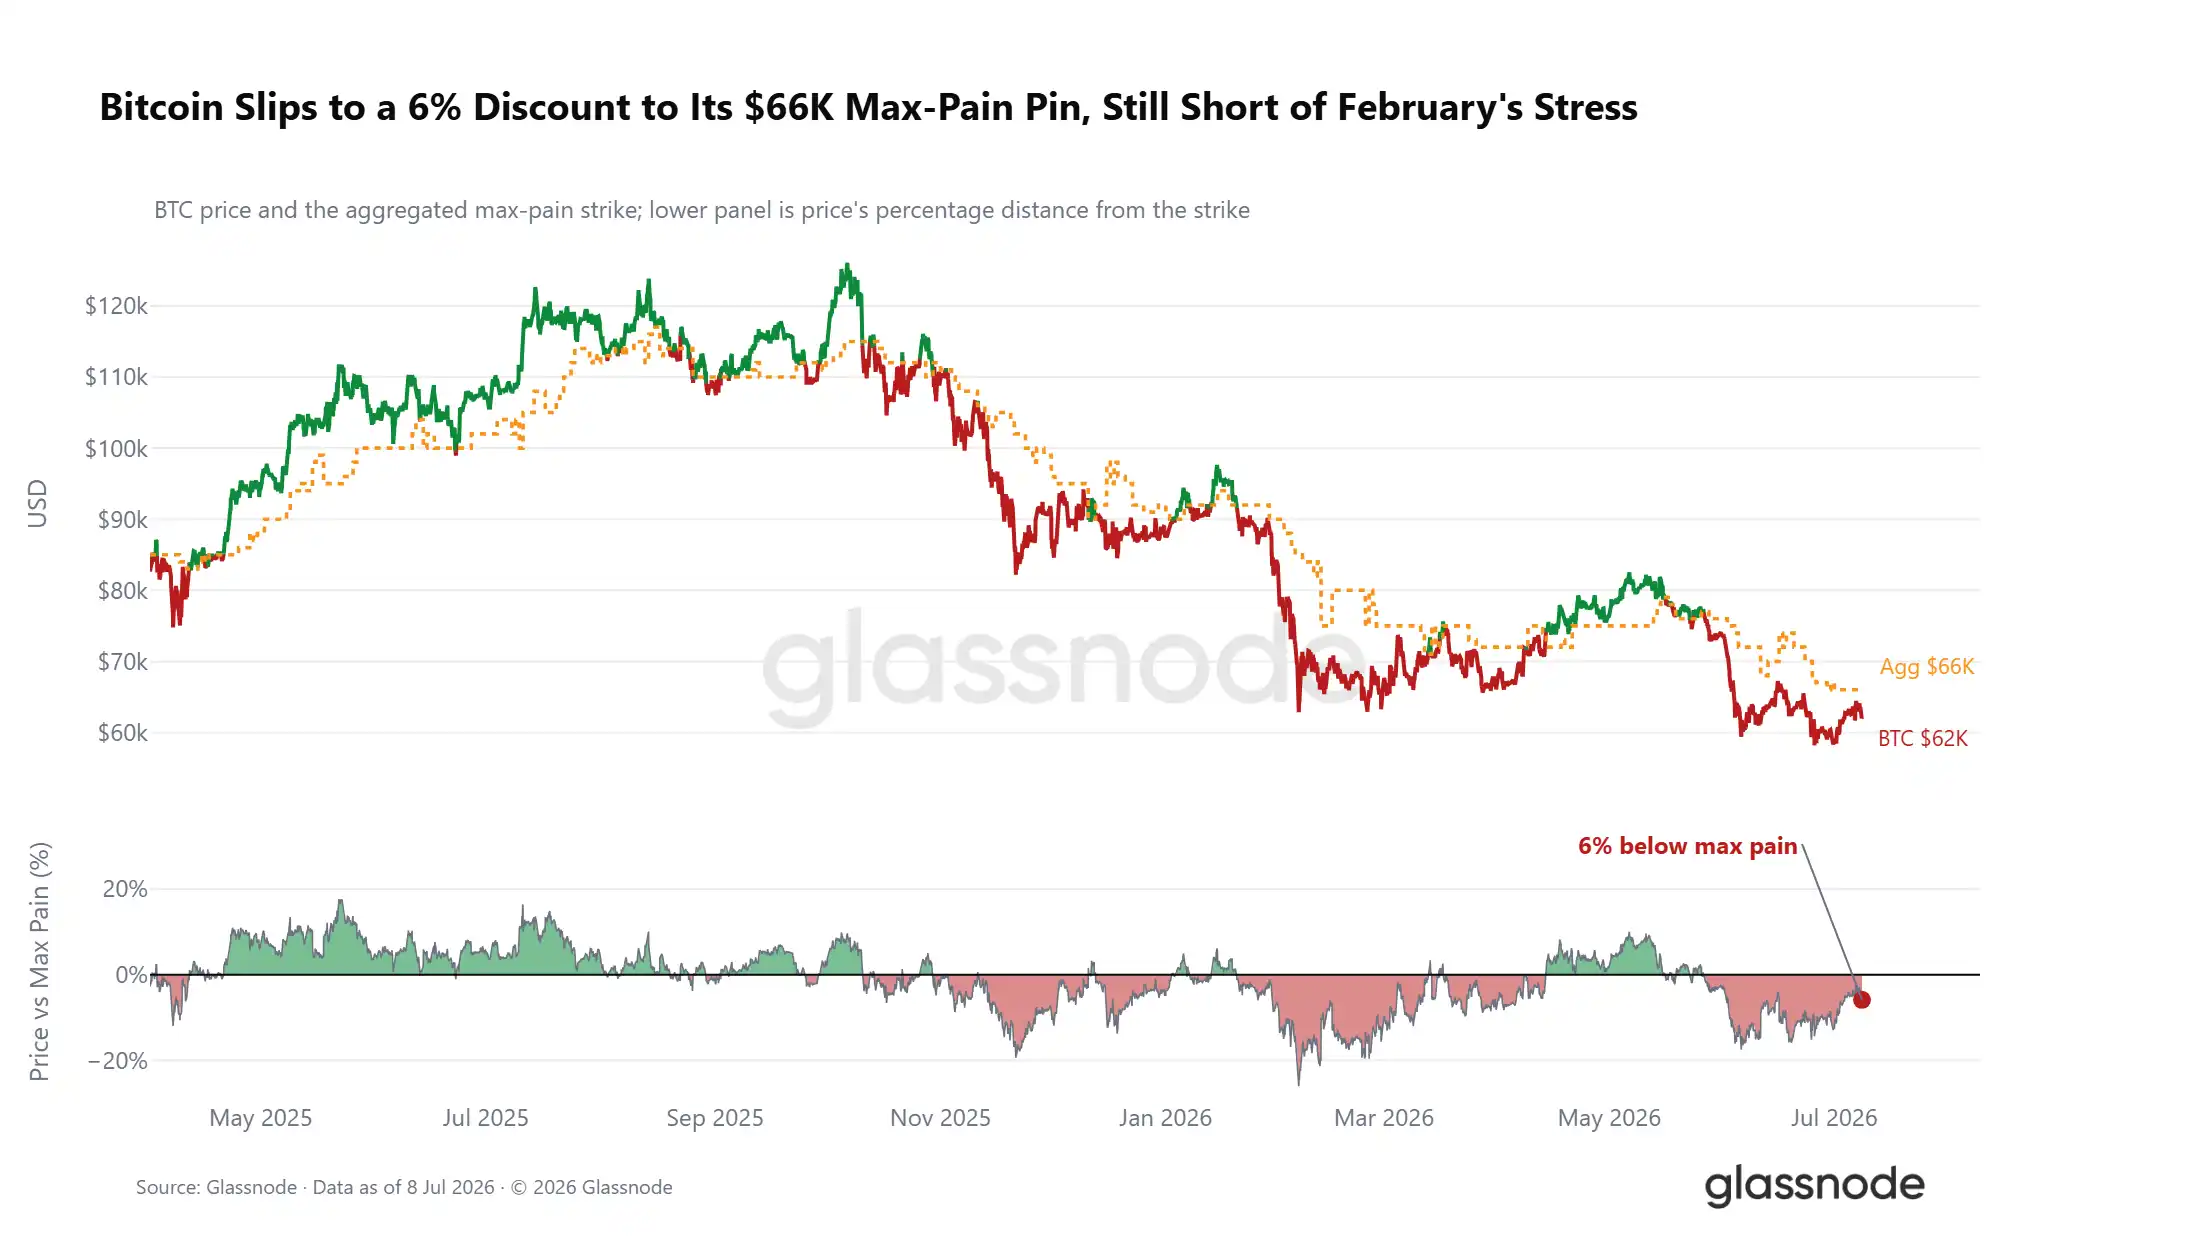
Beyond positioning and volatility skew, the relative position of the spot price to options market structure offers further clues. The current Bitcoin spot price is about 6% below the aggregate market max pain price of $66,000. The max pain price is the strike price at which the most open contracts expire worthless at expiration, and price action tends to gravitate towards this level before expiry.

This week's decline further widened the spread between spot and max pain, but the deviation is far from the extremes of the February crash, only residing in the middle of the 2026 price action range. Throughout the year, the max pain price has consistently acted as a gravitational center for price action, with the spot price oscillating around it, rarely deviating significantly for extended periods. If the price consistently holds above $66,000, short-term market signals would turn optimistic; if the spread widens further, it would reinforce the overall defensive trading sentiment in the options landscape.
Cost of Crash Hedging Continues to Decline

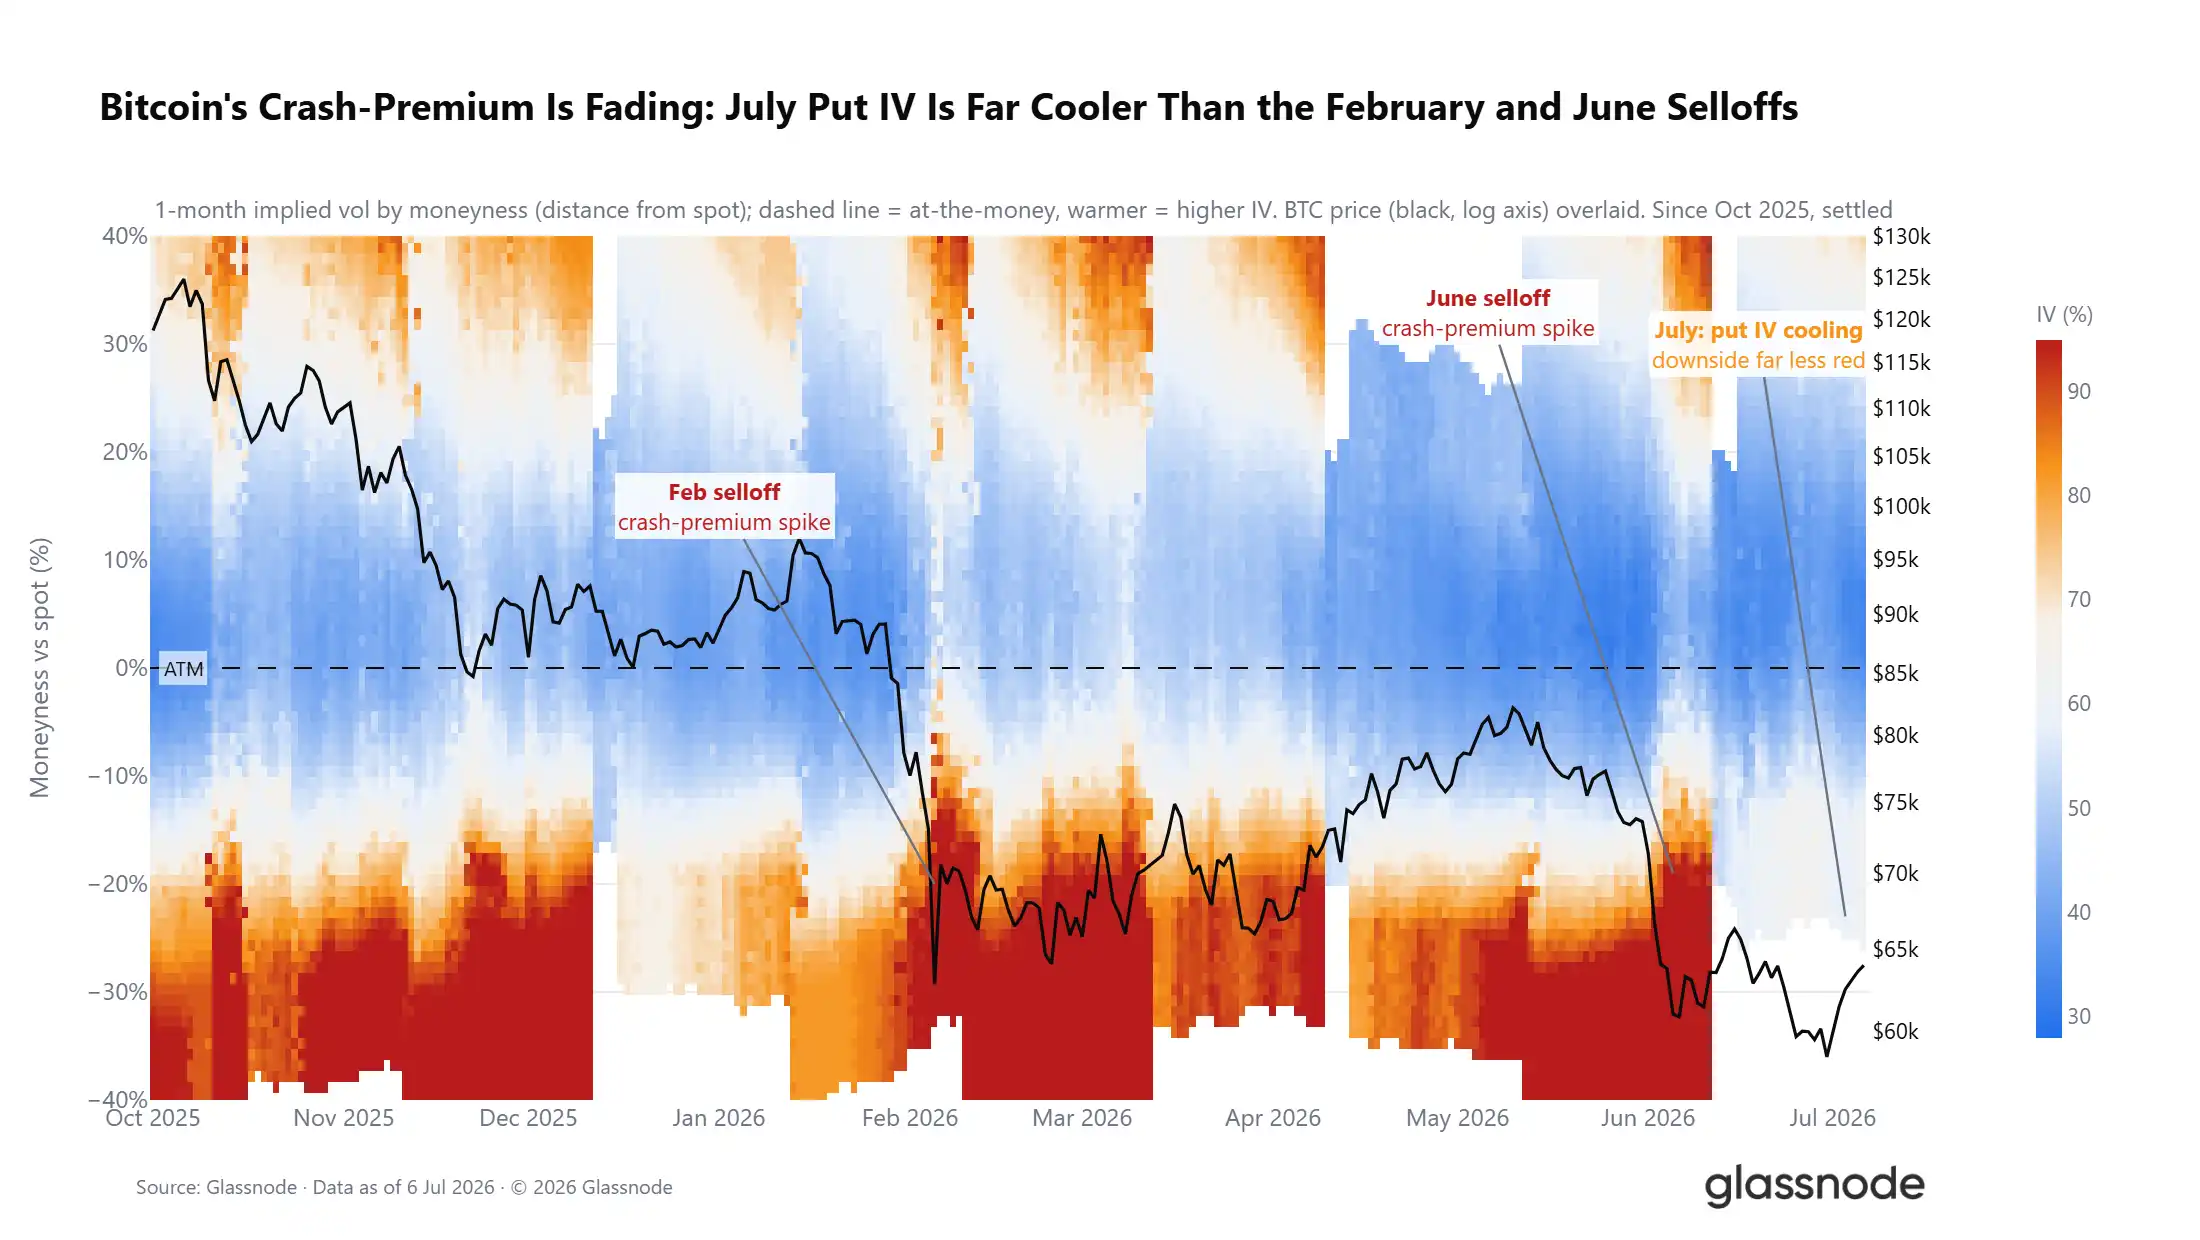
While signals from volatility skew and positioning diverge, the trend in absolute cost of hedging downside risk is clear. With the market's slight rebound, the pricing on the put side of the one-month volatility curve has shifted lower overall, with implied volatility for puts 5% below spot dropping significantly; the lowest pricing points on the volatility curve are concentrated in far out-of-the-money call options.
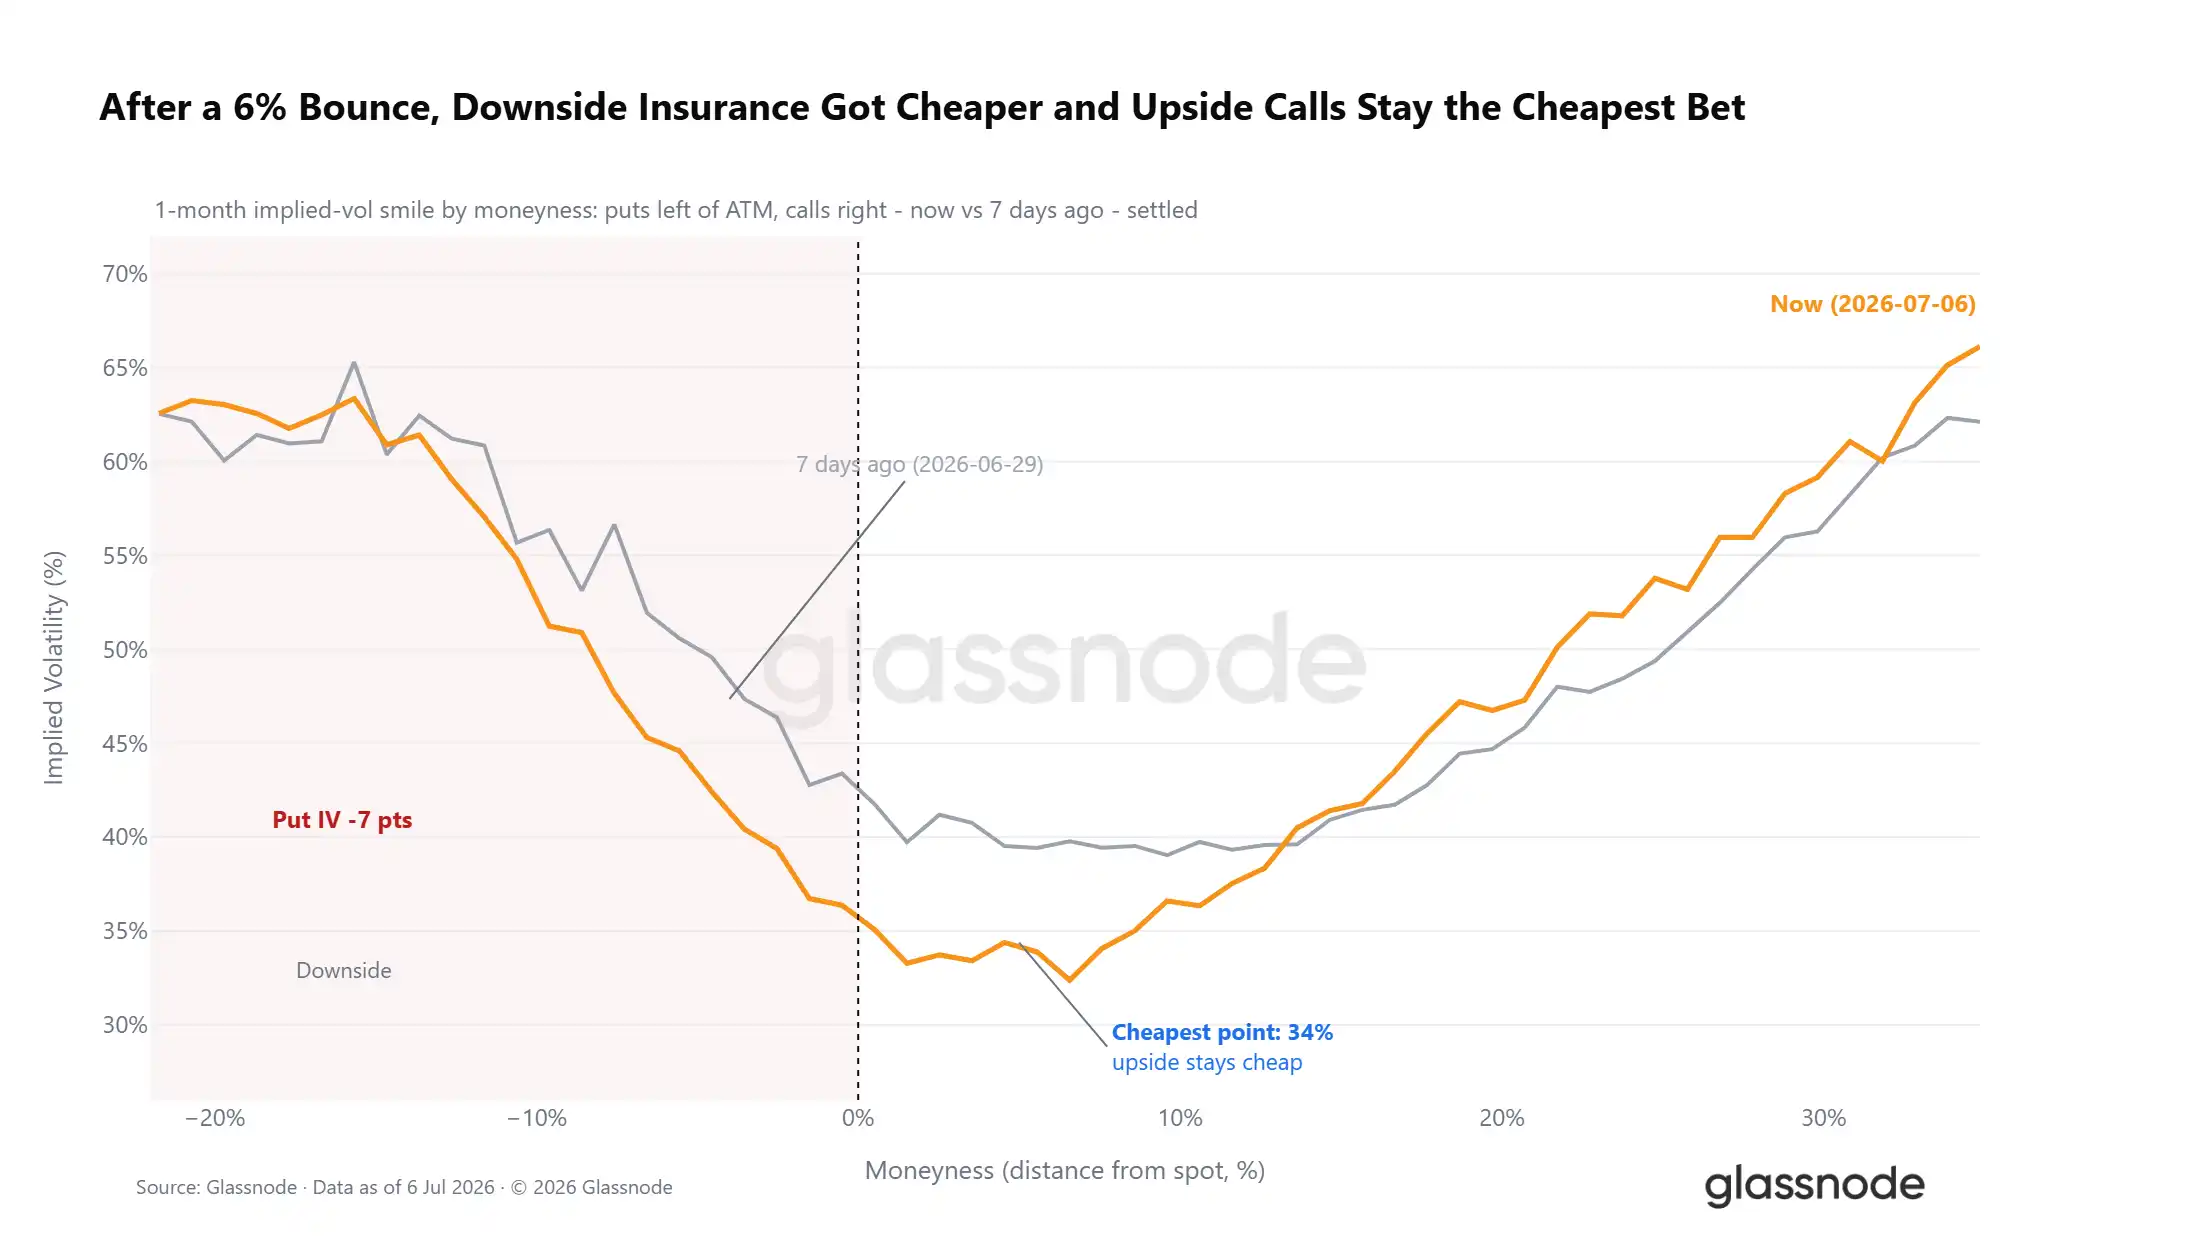
Overall defensive market sentiment persists, but the absolute cost traders pay to hedge against declines has noticeably decreased. Extending the time horizon makes this trend clearer: the volatility premium driven by extreme put hedging demand during the February and June crashes has gradually subsided entering July. The DVOL volatility index has fallen to a 12-month low, as the market enters a low-volatility regime. While cautious sentiment still dominates price action, hedging demand is gradually fading.
Summary

Integrating data from on-chain, off-chain, and derivatives dimensions, the market clearly exhibits late-stage bear market characteristics.

On-chain data shows a prolonged deep undervaluation cycle lasting five months continues, with long-term holder daily stop-loss realization volume rising to $280 million, indicating large-scale coin distribution is underway; however, a sustained decline in this stop-loss indicator is a necessary prerequisite for an effective market reversal.

Regarding off-chain data, ETF outflow scale has narrowed from its June peak but monthly net outflows persist; daily average trading volume is down 80% from the October 2025 peak, reflecting low institutional bullish confidence.

From a derivatives perspective, market positioning has shifted to cautiously bullish, with the put/call ratio hitting a yearly low; however, the volatility skew and options surface continue to price in downside risk.

Synthesizing all indicators, the foundational conditions required for market bottoming are all in place, but the core signals confirming a bottom have not yet appeared. Subsequent price action needs to meet three conditions: continuous cooling of long-term holder stop-loss selling pressure, stabilization of institutional fund flows, and price effectively holding above the true market average. Only on this basis will the probability of a shift into a bull market cycle significantly increase.


Trending Cryptos

Related Questions

QAccording to the Glassnode article, what are the three key signals that have not yet appeared, which are necessary to confirm a sustained Bitcoin market reversal?

AThe article states that for a sustained reversal, three key signals must appear: 1) A continued cooling-off of long-term holder sell-side pressure (realized losses). 2) A stabilization of institutional capital flows (ETF net flows turning positive or neutral). 3) The price effectively stabilizing above the Realized Price (true market mean).

QWhat does the 'long-term holder realized loss' metric indicate about the current market, and why is its trend crucial for a potential bullish turn?

AThe 'long-term holder realized loss' metric indicates that investors who bought near the cycle peak are capitulating and selling at a loss. This is currently the dominant source of selling pressure. Its trend is crucial because only when this metric shows a clear and sustained decline, signaling that this capitulation is exhausting, will the market have a foundation for a transition to a bullish cycle.

QHow does the performance of US spot Bitcoin ETFs reflect the current institutional sentiment, based on the data presented in the article?

AThe data shows institutional sentiment remains weak. While ETF daily net outflows have moderated from their June peak, they persist on a monthly basis. Furthermore, the average daily trading volume of ETFs has shrunk by approximately 80% compared to the October 2025 peak, indicating a lack of strong institutional buying conviction and participation.

QDespite a shift to a 'cautiously net long' positioning in derivatives, what signal from the options market suggests traders are still defensive?

AThe 25-delta volatility skew remains in positive territory across all maturities, meaning traders are willing to pay a premium for downside protection (put options) relative to upside potential (call options). This indicates that even with a net long bias, the market is still actively hedging against potential price declines.

QWhat is the significance of Bitcoin's price trading below both the Realized Price and the Short-Term Holder Cost Basis for an extended period, as mentioned in the article?

ABitcoin trading below both the Realized Price (the average price at which all coins last moved) and the Short-Term Holder Cost Basis for nearly five months signifies a period of deep undervaluation. Historically, such prolonged periods of accumulation below key on-chain cost bases have formed the foundation for major cycle bottoms, presenting long-term value opportunities.

Related Reads

330 Days Later, Nexperia China Management Team Makes a Major Announcement: What Have They Brought?

Nexperia China's management team announced a major new product launch 330 days after their supply chain was disrupted. The company has established a fully localized, closed-loop supply chain in China and is now releasing over 100 new products, including SGT T2X automotive-grade MOSFETs and HCS high-speed logic ICs, all manufactured on a 12-inch wafer platform. The supply disruption in late 2025 severed wafer supply from overseas, forcing Nexperia China to rebuild its production capabilities domestically. Moving to the 12-inch platform offers significant advantages: improved cost efficiency with per-chip costs dropping 10-30%, better performance consistency with parameter variations narrowing to ~5%, and higher, more stable yields. A key achievement is the development of the world's first 12-inch Bipolar platform, reaching small-scale production in just 11 months, showcasing the speed and capability of China's semiconductor supply chain. The company is backing its production ramp with competitive pricing and guaranteed supply. Several logic ICs and power MOSFETs have seen price reductions of 20-30% compared to last year's highs. To ensure direct and transparent customer access, Nexperia China has launched its own e-commerce platform for real-time inventory, pricing, and ordering. CEO Zhang Qiuming emphasized that this transformation is about "protection"—protecting customers, the industry, employees, and the continuity of globalization itself. By building a resilient, China-based manufacturing hub, Nexperia aims to provide a stable, high-quality supply for the global market, moving forward with a "China for China, China for Global" strategy.

marsbit21m ago

330 Days Later, Nexperia China Management Team Makes a Major Announcement: What Have They Brought?

marsbit21m ago

Zcash Price Surge Enhances Its Advantage Over Bitcoin in Mining Revenue and AI High-Performance Computing

According to analysis by The Energy Mag, Bitmain's Z15 Pro miner for Zcash cryptocurrency generated approximately $727.30 in gross revenue per megawatt-hour of electricity as of Monday, which is about 3.3 times higher than the estimated industry average for high-performance computing (HPC) at $222.73 per MWh. This marks a significant increase in the mining advantage of Zcash over HPC, from about $150 per MWh in late June to over $500 currently. The performance gap compared to Bitcoin mining hardware like the S23 Pro also widened substantially. The surge is driven primarily by a sharp price increase in Zcash (ZEC), which rose roughly 70% in seven days to trade around $890, setting what analysts consider a practical all-time high based on more liquid trading history. Bitcoin also saw gains of over 20%, rising above $77,000, but its mining revenue growth was far less pronounced than Zcash's. The broader cryptocurrency rally was initially fueled by the U.S. Treasury's decision to expand long-term bond purchases, which lowered yields and weakened the dollar, prompting investors to shift towards alternative assets like gold and cryptocurrencies. Regulatory developments, including former President Trump's push for the Clarity Act and outlined lighter rules for digital asset firms, provided additional momentum. A subsequent short squeeze, with over $4 billion in bearish crypto positions liquidated, further amplified upward pressure. Upcoming U.S. economic data and Federal Reserve Chair Kevin Warsh's speech at the Jackson Hole symposium are seen as key tests. Hawkish signals on inflation could strengthen the dollar and Treasury yields, potentially reversing some of the liquidity-driven crypto gains, while a softer stance may support further demand for risk assets.

cryptonews.ru26m ago

Zcash Price Surge Enhances Its Advantage Over Bitcoin in Mining Revenue and AI High-Performance Computing

cryptonews.ru26m ago

Trading

Spot

Hot Articles

What is $BITCOIN

DIGITAL GOLD ($BITCOIN): A Comprehensive Analysis Introduction to DIGITAL GOLD ($BITCOIN) DIGITAL GOLD ($BITCOIN) is a blockchain-based project operating on the Solana network, which aims to combine the characteristics of traditional precious metals with the innovation of decentralized technologies. While it shares a name with Bitcoin, often referred to as “digital gold” due to its perception as a store of value, DIGITAL GOLD is a separate token designed to create a unique ecosystem within the Web3 landscape. Its goal is to position itself as a viable alternative digital asset, although specifics regarding its applications and functionalities are still developing. What is DIGITAL GOLD ($BITCOIN)? DIGITAL GOLD ($BITCOIN) is a cryptocurrency token explicitly designed for use on the Solana blockchain. In contrast to Bitcoin, which provides a widely recognized value storage role, this token appears to focus on broader applications and characteristics. Notable aspects include: Blockchain Infrastructure: The token is built on the Solana blockchain, known for its capacity to handle high-speed and low-cost transactions. Supply Dynamics: DIGITAL GOLD has a maximum supply capped at 100 quadrillion tokens (100P $BITCOIN), although details regarding its circulating supply are currently undisclosed. Utility: While precise functionalities are not explicitly outlined, there are indications that the token could be utilized for various applications, potentially involving decentralized applications (dApps) or asset tokenization strategies. Who is the Creator of DIGITAL GOLD ($BITCOIN)? At present, the identity of the creators and development team behind DIGITAL GOLD ($BITCOIN) remains unknown. This situation is typical among many innovative projects within the blockchain space, particularly those aligning with decentralized finance and meme coin phenomena. While such anonymity may foster a community-driven culture, it intensifies concerns about governance and accountability. Who are the Investors of DIGITAL GOLD ($BITCOIN)? The available information indicates that DIGITAL GOLD ($BITCOIN) does not have any known institutional backers or prominent venture capital investments. The project seems to operate on a peer-to-peer model focused on community support and adoption rather than traditional funding routes. Its activity and liquidity are primarily situated on decentralized exchanges (DEXs), such as PumpSwap, rather than established centralized trading platforms, further highlighting its grassroots approach. How DIGITAL GOLD ($BITCOIN) Works The operational mechanics of DIGITAL GOLD ($BITCOIN) can be elaborated on based on its blockchain design and network attributes: Consensus Mechanism: By leveraging Solana’s unique proof-of-history (PoH) combined with a proof-of-stake (PoS) model, the project ensures efficient transaction validation contributing to the network's high performance. Tokenomics: While specific deflationary mechanisms have not been extensively detailed, the vast maximum token supply implies that it may cater to microtransactions or niche use cases that are still to be defined. Interoperability: There exists the potential for integration with Solana’s broader ecosystem, including various decentralized finance (DeFi) platforms. However, the details regarding specific integrations remain unspecified. Timeline of Key Events Here is a timeline that highlights significant milestones concerning DIGITAL GOLD ($BITCOIN): 2023: The initial deployment of the token occurs on the Solana blockchain, marked by its contract address. 2024: DIGITAL GOLD gains visibility as it becomes available for trading on decentralized exchanges like PumpSwap, allowing users to trade it against SOL. 2025: The project witnesses sporadic trading activity and potential interest in community-led engagements, although no noteworthy partnerships or technical advancements have been documented as of yet. Critical Analysis Strengths Scalability: The underlying Solana infrastructure supports high transaction volumes, which could enhance the utility of $BITCOIN in various transaction scenarios. Accessibility: The potential low trading price per token could attract retail investors, facilitating wider participation due to fractional ownership opportunities. Risks Lack of Transparency: The absence of publicly known backers, developers, or an audit process may yield skepticism regarding the project's sustainability and trustworthiness. Market Volatility: The trading activity is heavily reliant on speculative behavior, which can result in significant price volatility and uncertainty for investors. Conclusion DIGITAL GOLD ($BITCOIN) emerges as an intriguing yet ambiguous project within the rapidly evolving Solana ecosystem. While it attempts to leverage the “digital gold” narrative, its departure from Bitcoin's established role as a store of value underscores the need for a clearer differentiation of its intended utility and governance structure. Future acceptance and adoption will likely depend on addressing the current opacity and defining its operational and economic strategies more explicitly. Note: This report encompasses synthesised information available as of October 2023, and developments may have transpired beyond the research period.

2.1k Total ViewsPublished 2025.05.13Updated 2025.05.13

What is $BITCOIN

Discussions

Welcome to the HTX Community. Here, you can stay informed about the latest platform developments and gain access to professional market insights. Users' opinions on the price of BTC (BTC) are presented below.

活动图片