Entering early January 2026, the market showed signs of seller exhaustion, creating an opportunity for a price rebound towards the upper boundary of the current trading range. However, this rally comes with elevated risk as prices approach the ~$98k zone, where recent investors have formed active 'breakeven' selling pressure around their cost basis.
Core Insights
· On-chain structure remains fragile: Price hovers near key cost basis levels, lacking sustained confirmation of conviction from long-term holders.
· Supply overhang persists: Recent buyers face overhead resistance, limiting the sustainability of any advance and making rallies prone to sell-offs.
· Spot flows turn positive: Selling pressure on major exchanges has eased, but buying remains selective, not broad-based.
· Treasury inflows are patchy: Treasury activity is sporadic and event-driven, not yet forming a coordinated buying trend, with limited impact on overall demand.
· Derivatives participation is low: Futures volume is contracting, leverage use is cautious, and the market is in a low-engagement state.
· Options market sees only short-term pressure: Short-term implied volatility reacted to risk events, while medium-to-long-term volatility remains stable.
· Hedging demand spikes then normalizes: The surge in the Put/Call Volume Ratio has subsided, indicating risk aversion was tactical.
· Dealer gamma positioning is net short: This weakens mechanical support for price stability and increases market sensitivity to liquidity shocks.
On-Chain Deep Dive
Over the past two weeks, the anticipated technical rebound has largely played out, with price stalling below the Short-Term Holder cost basis after touching resistance, once again confirming substantial overhead selling pressure. This report will focus on the structure and behavior of this 'overhead' supply to reveal emerging seller dynamics.
Technical Rebound Meets Resistance
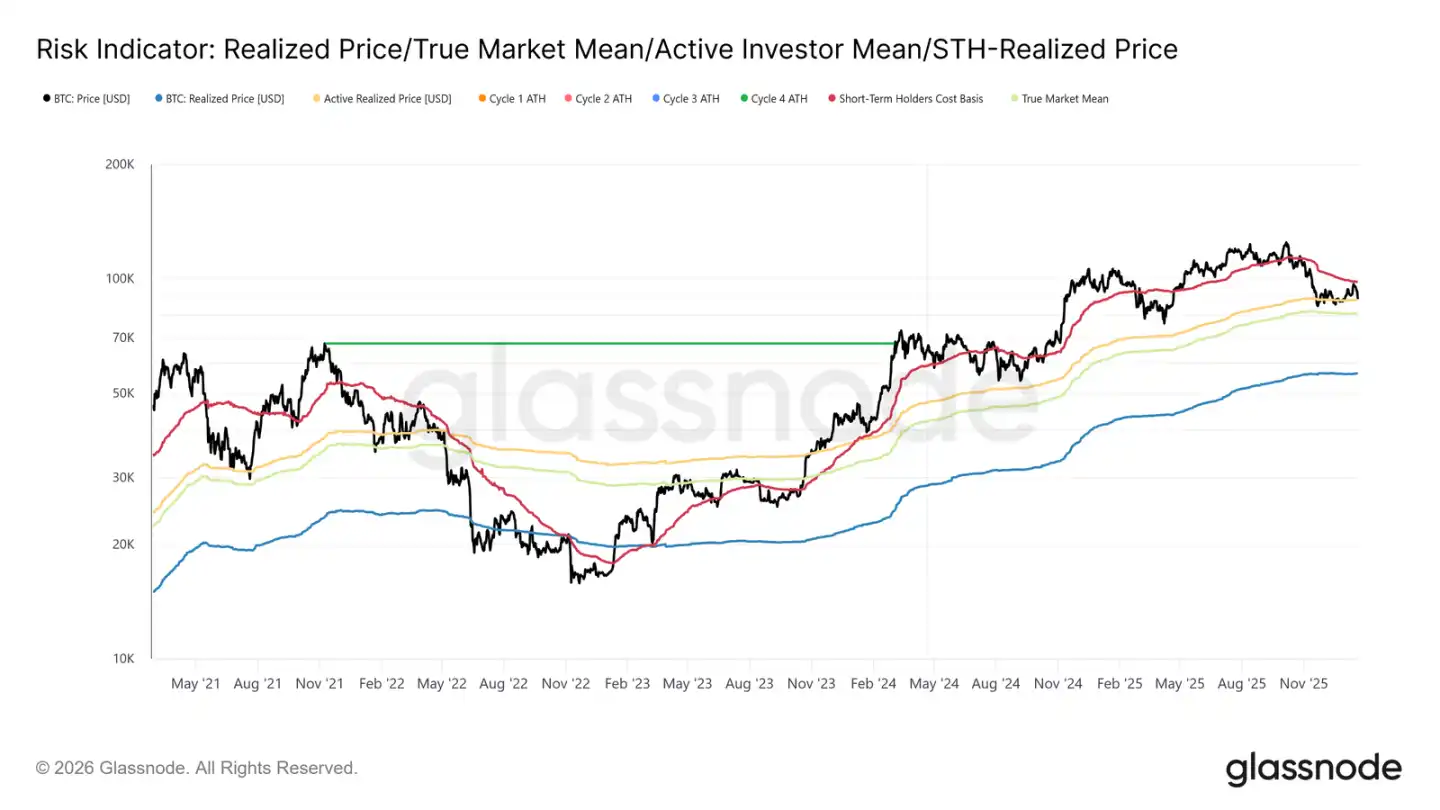
A clear narrative has emerged: the market has been in a mild bearish phase. Its lower bound is supported by the ~$81.1k Realized Mean, while the upper bound is capped by the average cost basis of Short-Term Holders. This range creates a fragile equilibrium where downside pressure is absorbed, but upside attempts are repeatedly sold into by investors who bought between Q1 and Q3 2025.
Entering early January 2026, the exhaustion of seller momentum opened a window for price to rebound towards the range high. However, this rally is at high risk as prices near the ~$98k zone, where recent investors show increased willingness to sell around their breakeven point.
The recent rejection around ~$98.4k (the STH cost basis) mirrors the market structure seen in Q1 2022. Back then, the market repeatedly failed to decisively break above the cost basis of recent buyers, leading to a prolonged consolidation period. This similarity underscores the fragile nature of the current recovery attempt.
Overhead Supply Pressure Remains
Building on the observation of price rejection at key cost levels, a closer look at the on-chain supply distribution provides clearer insight into why upward momentum has repeatedly faltered.
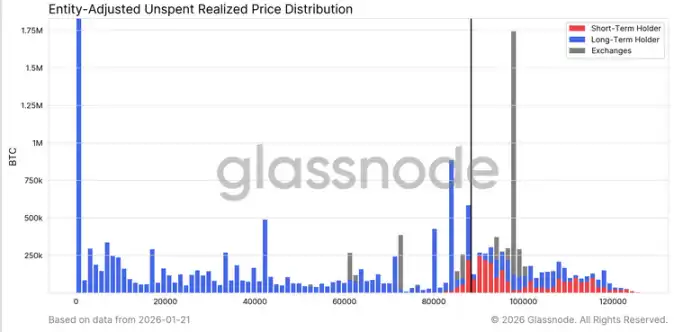
The URPD (Unrealized Profit/Loss Distribution) chart clearly illustrates why the excess supply above $98k remains the primary force capping near-to-mid-term rallies. The recent rebound partially filled the 'vacuum zone' between ~$93k and $98k, primarily through early buyers distributing to new entrants, forming a new cluster of Short-Term Holder supply.
However, the supply distribution above $100k reveals a broad and dense supply zone, with these coins gradually aging into Long-Term Holder status. This undigested 'overhead' supply is a persistent source of selling pressure, likely keeping price suppressed below the $98.4k (STH cost basis) and $100k psychological levels. Thus, a significant and sustained acceleration in demand momentum is required for a decisive breakout.
Long-Term Holders Also Present Resistance
Expanding the view from Short-Term Holders to longer-term holdings, we find the same structural constraints persist.
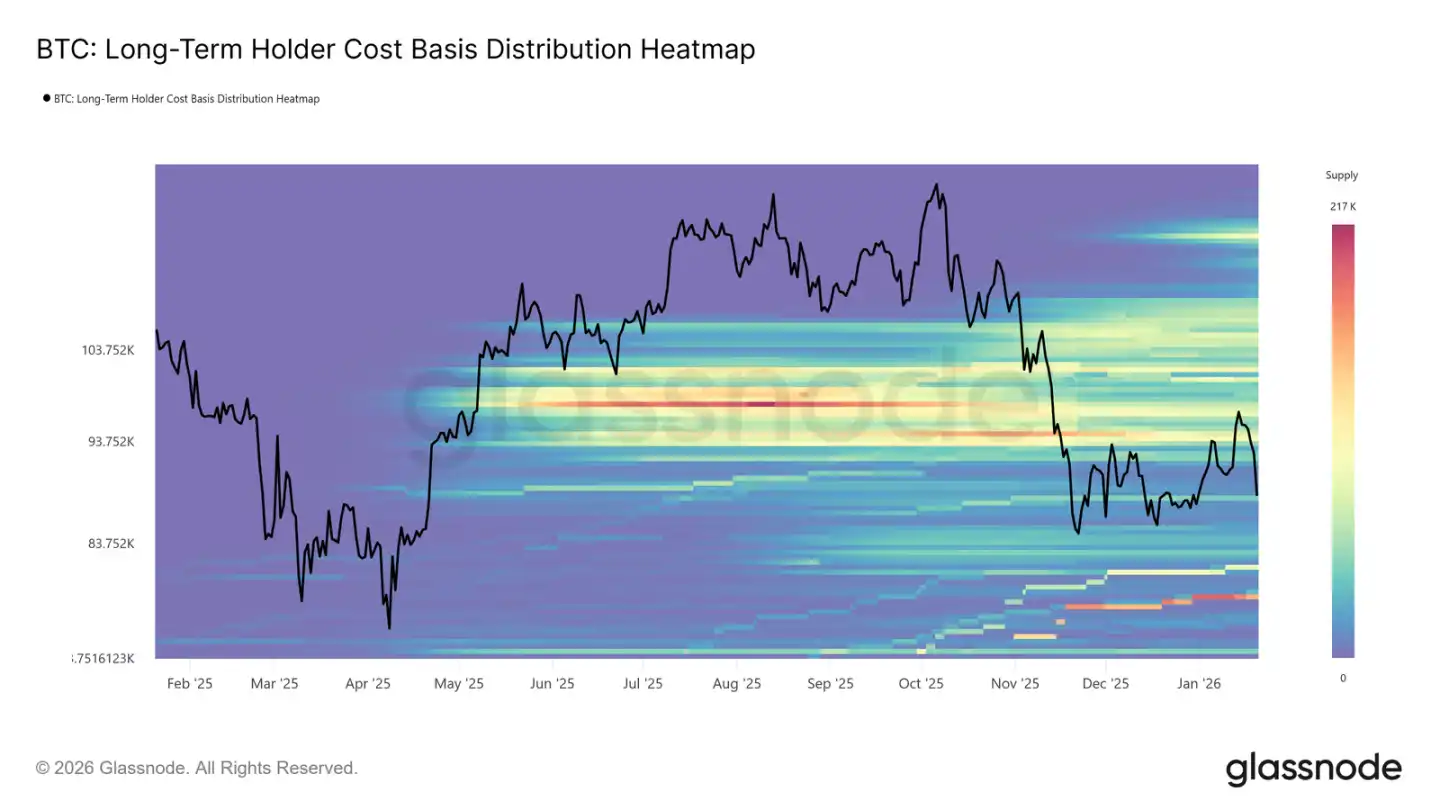
The Long-Term Holder cost basis distribution heatmap shows a dense cluster of long-term coin acquisition costs above the current spot price. This zone represents a significant source of potential seller liquidity when price rallies towards these historical entry levels.
Long-Term Holders will remain a potential source of resistance until new, sufficiently strong demand emerges to absorb this overhead supply. Therefore, upside potential is likely to remain capped, and any rally vulnerable to renewed selling, until this 'overhead' supply is thoroughly digested.
Rally Meets Profit-Taking and Stop-Loss Selling
Going further, we can identify which investor cohorts were actively distributing (for profit or stop-losses) during the recent push towards ~$98k, thus capping the price.
Realized Losses broken down by coin age show that loss-taking was dominated by the 3-6 month cohort, followed by the 6-12 month holders. This pattern is characteristic of 'pain capitulation,' particularly from those who bought above $110k and are now exiting as price approaches their cost basis. This behavior reinforces seller pressure around key recovery levels.
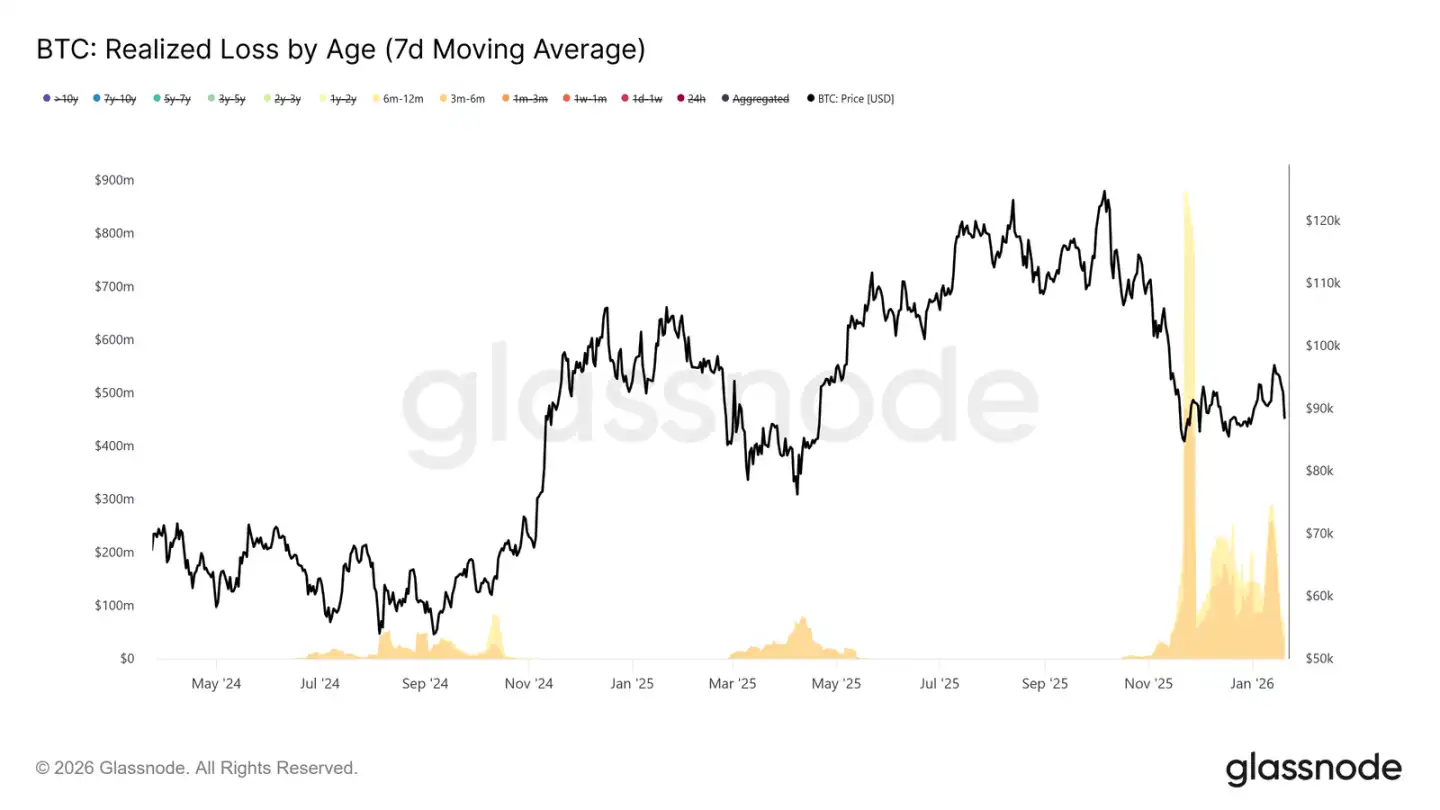
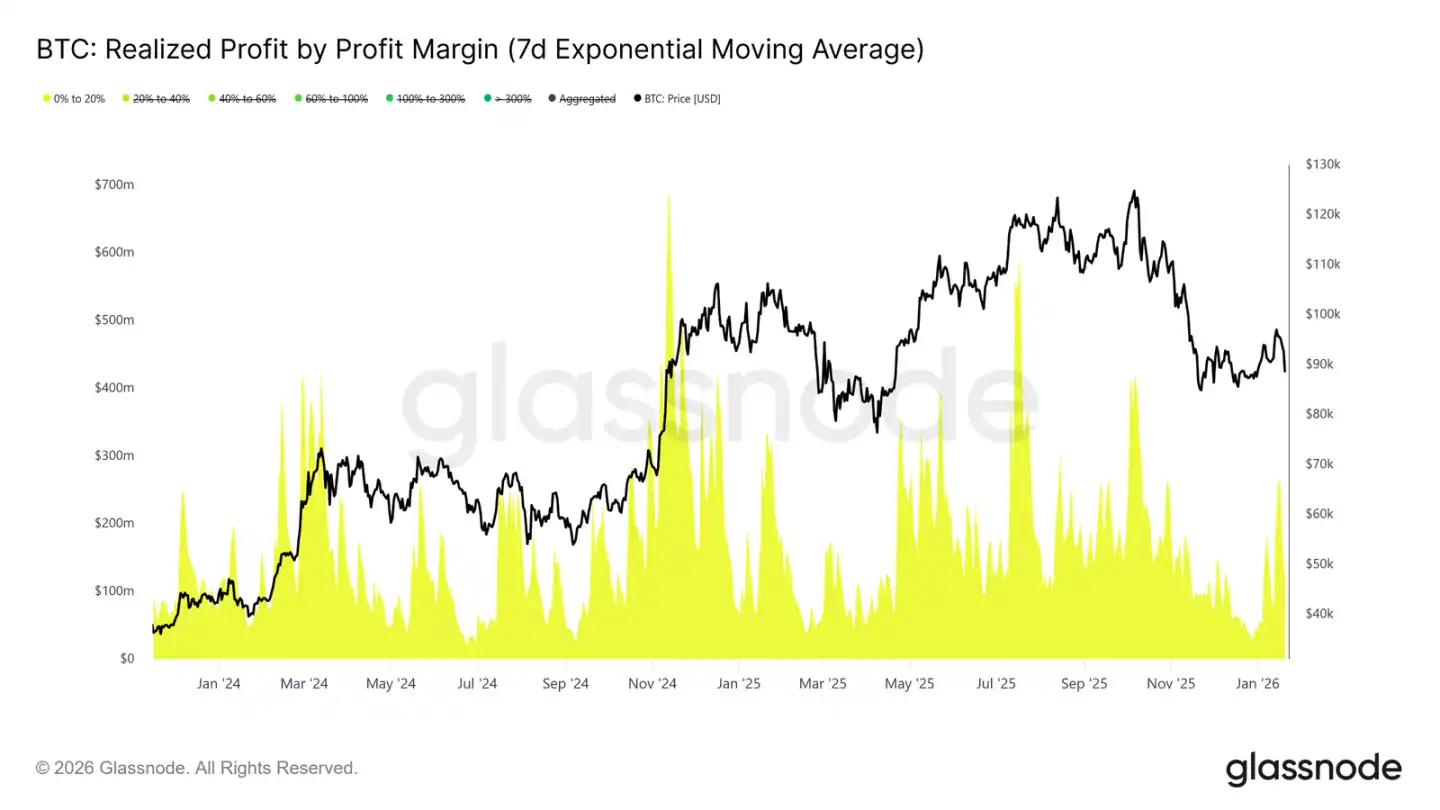
Concurrently, Realized Profits segmented by profit margin show a notable increase in the proportion of profit-taking within the 0% to 20% margin bracket. This highlights the influence of 'breakeven sellers' and short-term swing traders who tend to exit upon modest gains rather than waiting for trend continuation.
This behavior is common during market transitions where investor conviction is fragile, prioritizing capital preservation and tactical profits. This increase in low-margin selling continuously undermines upward momentum as supply is released around cost basis.
Off-Chain Market Watch
Spot Flows Turn Positive
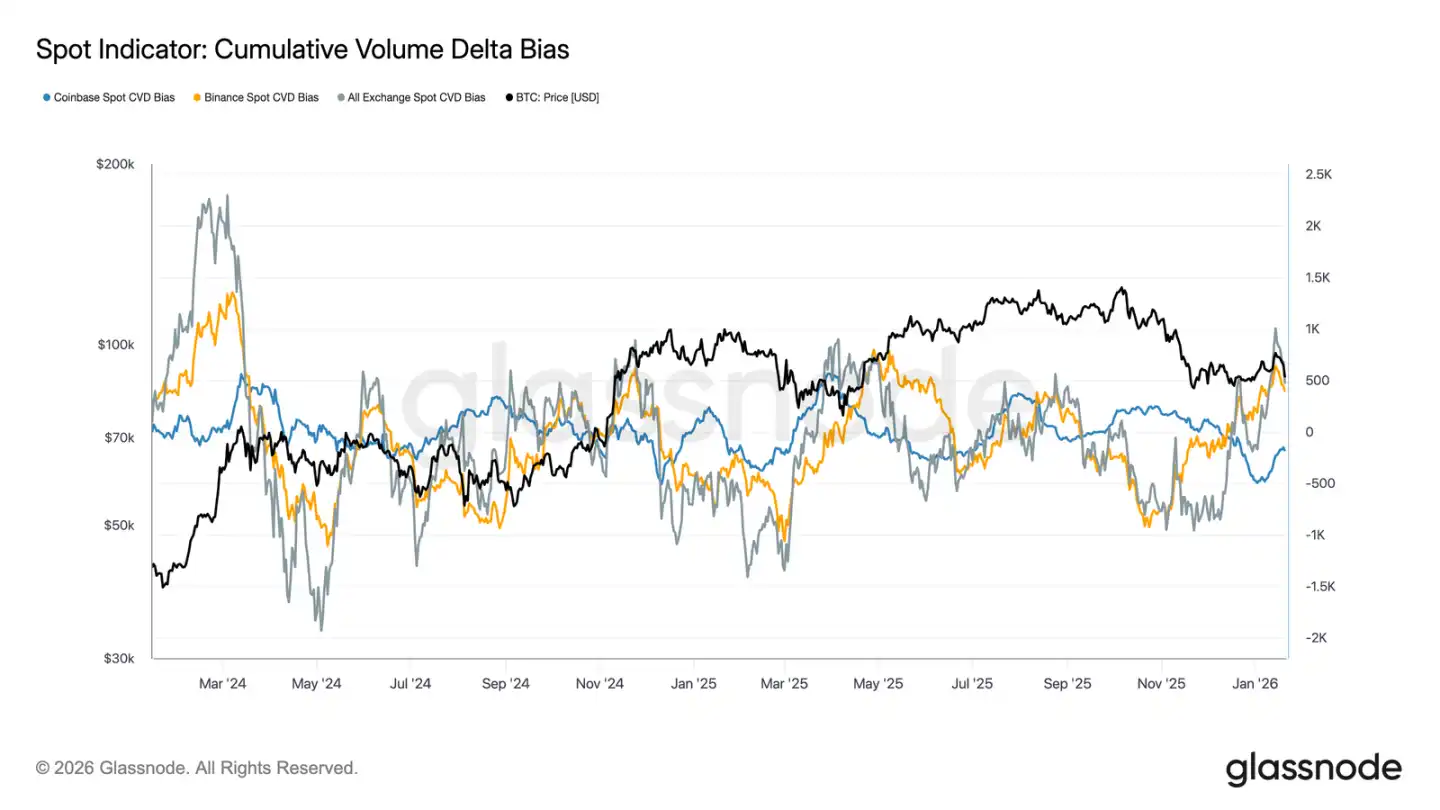
Spot market behavior has improved following the recent decline. The Binance and Exchange Composite CVD (Cumulative Volume Delta) metrics have flipped back to net buying, indicating spot participants are starting to re-accumulate rather than sell into strength, contrasting with the persistent selling pressure seen in earlier consolidation phases.
Coinbase, which had been a primary source of sell pressure during the range-bound trading, has also seen a significant slowdown in its net selling pace. The abatement of selling from Coinbase helps reduce overhead supply, stabilizing price action and supporting the recent bounce.
Although spot participation hasn't yet shown the sustained, aggressive buying typical of a trending expansion phase, the shift back to net buying on major platforms marks a positive improvement in the underlying spot market structure.
Digital Asset Treasury Inflows Remain Patchy
Recent net flows for digital asset treasuries remain patchy and uneven, characterized by isolated event-driven activity rather than broad trend buying. While there have been notable buying spikes from individual companies over the past few weeks, overall corporate demand has not yet entered a sustained accumulation mode.
Overall, digital asset treasury flows are oscillating narrowly around the zero line, indicating most corporate treasuries are currently in a wait-and-see or opportunistic mode, not systematically accumulating. This contrasts with earlier phases where multiple corporations bought in concert, driving trend acceleration.
Overall, the latest data shows corporate treasuries are only a marginal, selective source of demand, with an intermittent impact that is not yet decisive for overall price dynamics.

Derivatives Markets Are Quiet
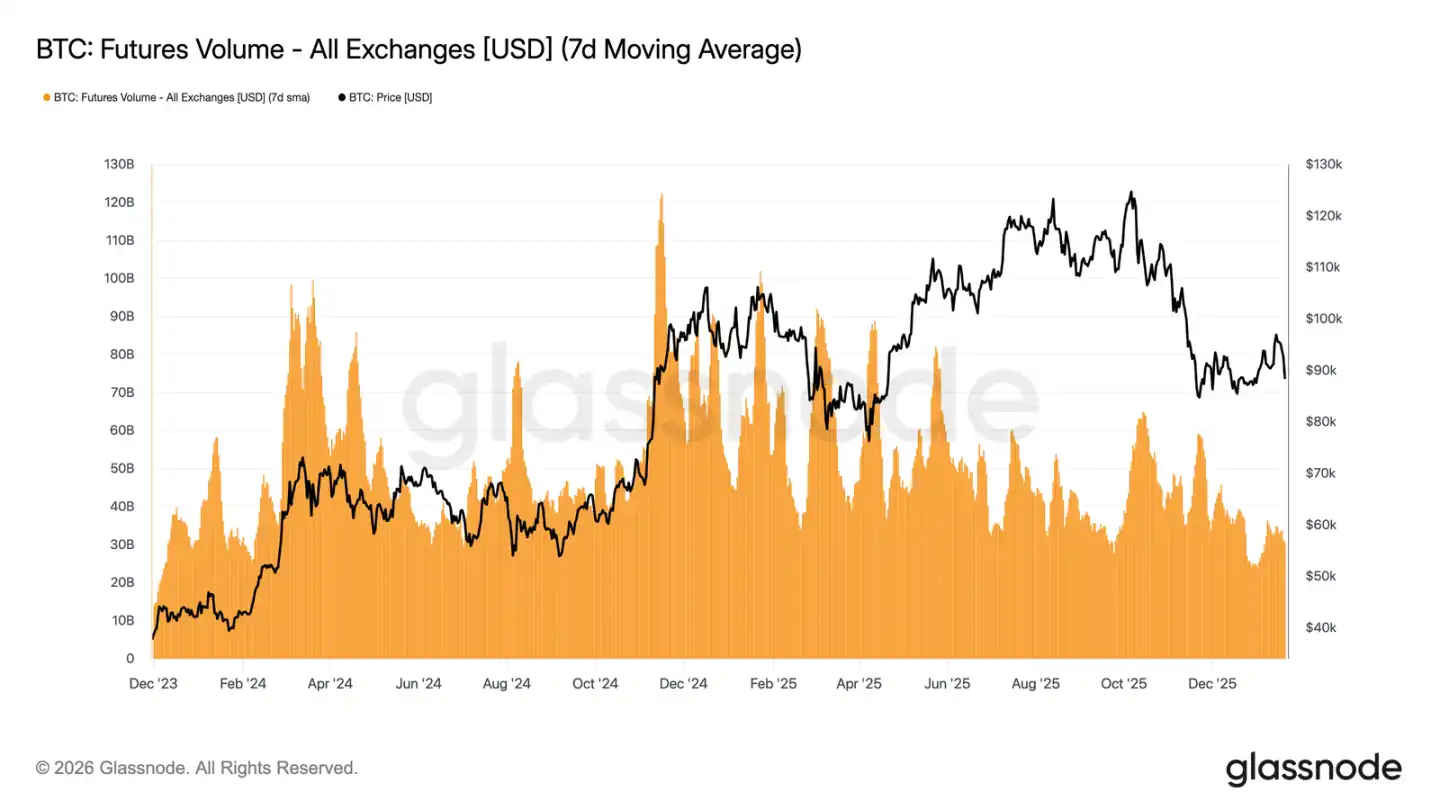
Bitcoin futures' 7-day moving average volume continues to contract, remaining well below levels typically associated with trending markets. The recent price volatility has not been accompanied by a meaningful expansion in volume, highlighting the low participation and lack of confidence in the derivatives market.
The current market structure suggests recent price action is more driven by sparse liquidity than aggressive positioning. Adjustments in Open Interest also lack concurrent volume growth, reflecting more the adjustment and rebalancing of existing risk rather than the deployment of new leverage.
In summary, the derivatives market is currently in a low-engagement 'quiet' state with sparse speculative interest. This 'ghost market' characteristic means the market could be very sensitive to any recovery in trade volume, but its influence on price discovery is currently limited.
Implied Volatility Spikes Only Short-Term
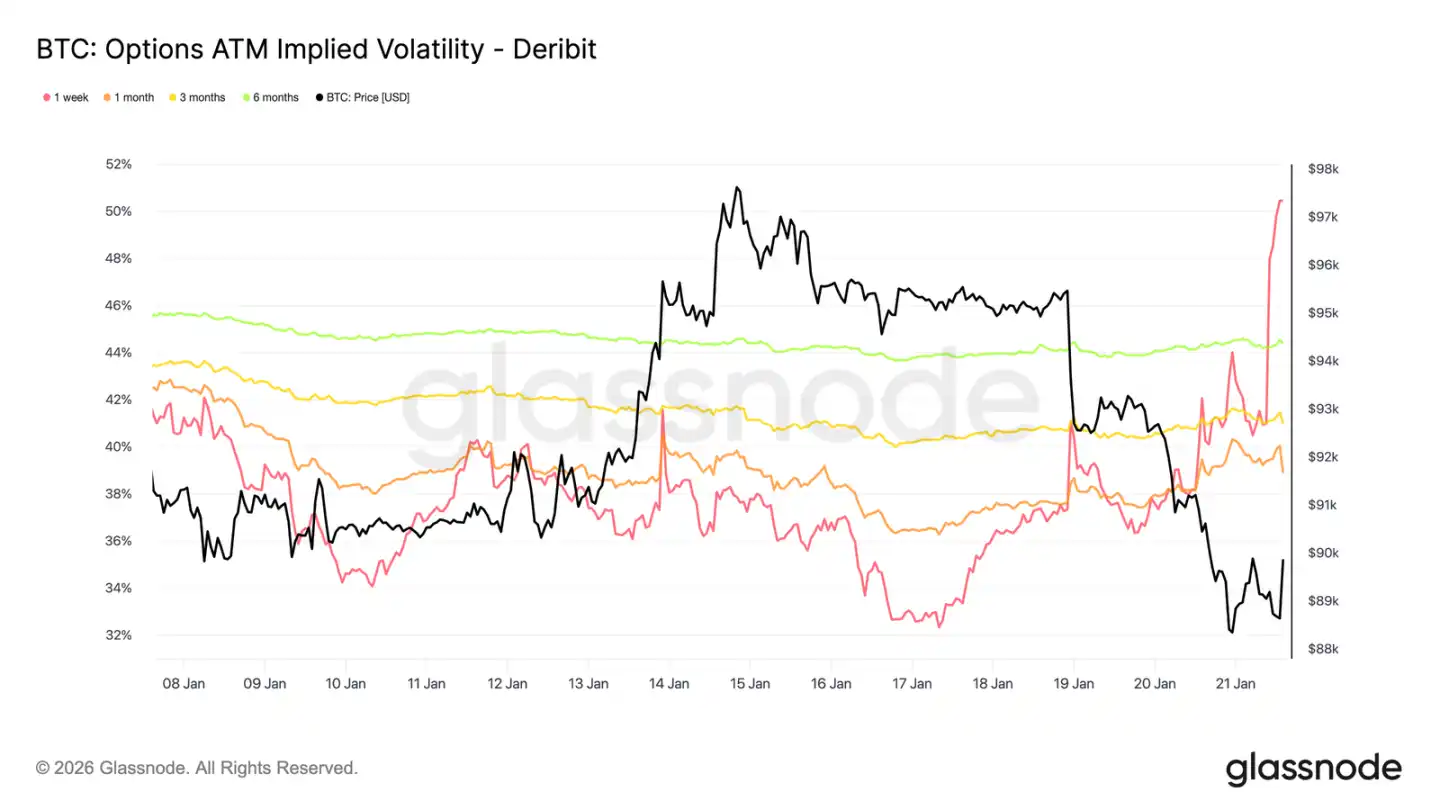
The spot sell-off triggered by macro and geopolitical news only stimulated a rise in short-term volatility. Since Sunday's drop, 1-week implied volatility rose by over 13 volatility points, while 3-month implied volatility rose only ~2 points, and 6-month implied volatility barely moved.
This acute steepening at the very front of the volatility curve indicates traders are engaging tactically, not reassessing the medium-term risk structure. Only short-term vol adjusted, reflecting event-driven uncertainty, not a shift across the volatility complex.
The market is pricing transient risk, not lasting turmoil.
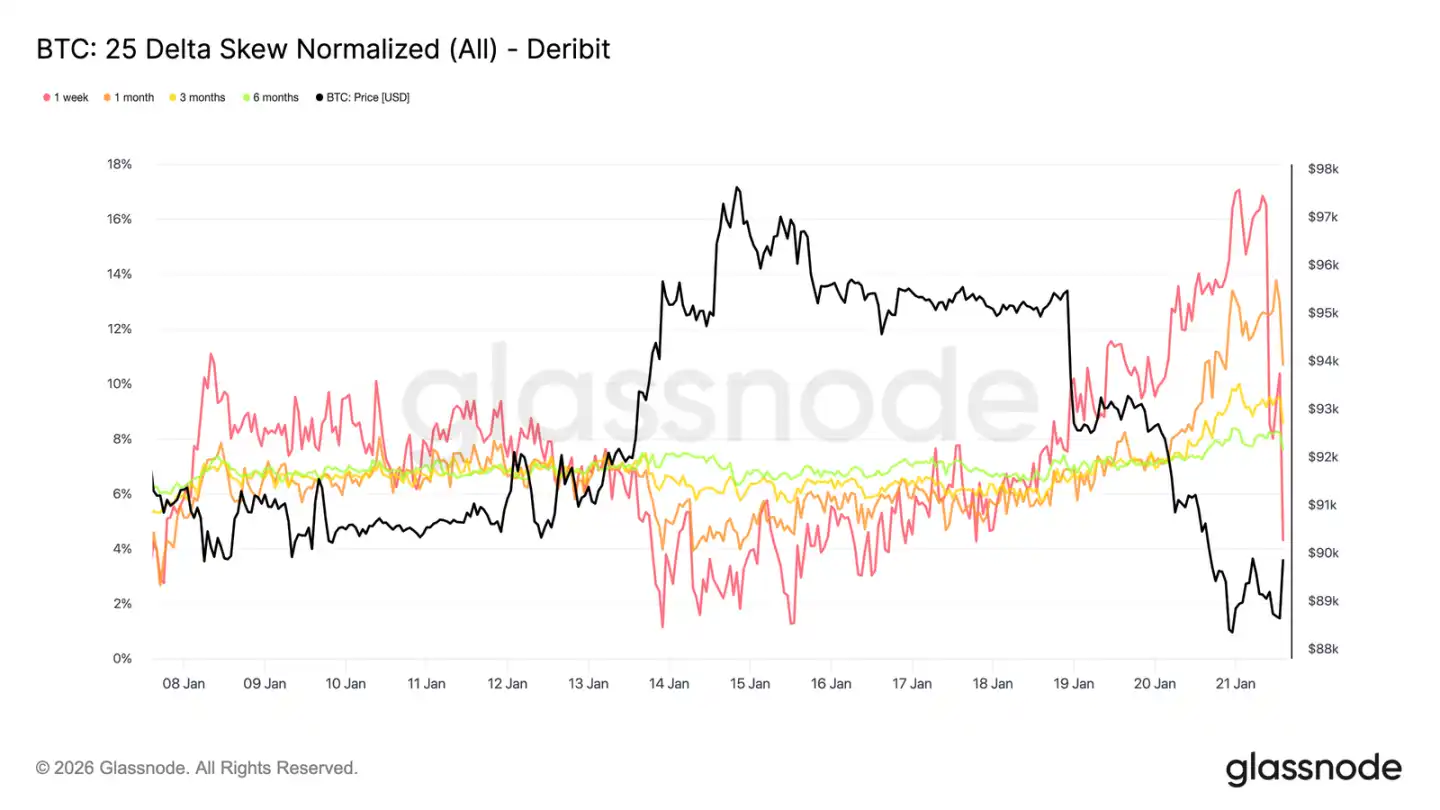
Short-Dated Skew Experiences Wild Swings
Similar to at-the-money volatility, short-dated skew also dominated this adjustment. The 1-week 25 Delta skew, which was near equilibrium a week ago, has sharply pivoted to a 'puts richer' state.
Since last week, this skew measure has moved ~16 volatility points towards puts, reaching a put premium of nearly 17%. The 1-month skew also reacted, while longer-dated skews, already in put territory, only deepened slightly.
Such a violent skew inversion often accompanies local extremes where the market is over-positioned and the prevailing trend is difficult to sustain. As the market digested the impact of Davos-related commentary, the downside premium was partially taken profit on, and skew began retracing rapidly.
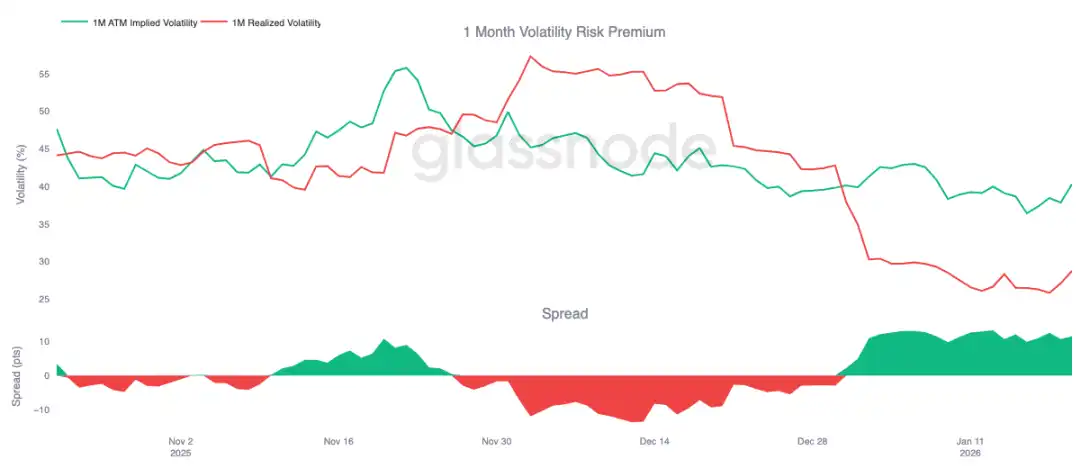
Volatility Risk Premium Holds High
The 1-month Volatility Risk Premium has held in positive territory since the start of the year. Despite implied volatility being at historically absolute lows, its pricing remains consistently higher than actual realized volatility. In other words, options remain 'expensive' relative to the price volatility actually occurring.
The Volatility Risk Premium captures the difference between implied and realized volatility. A positive premium means option sellers are compensated for assuming volatility risk. This creates a favorable environment for 'short vol' strategies – holding short gamma positions can generate returns as long as realized vol remains contained.
This dynamic is self-reinforcing, suppressing volatility. As long as selling volatility is profitable, more participants will join, keeping implied vol suppressed. As of Jan 20, the 1-month vol spread sits at ~11.5 volatility points in favor of sellers, which speaks volumes about the continued friendliness of the environment for selling volatility.
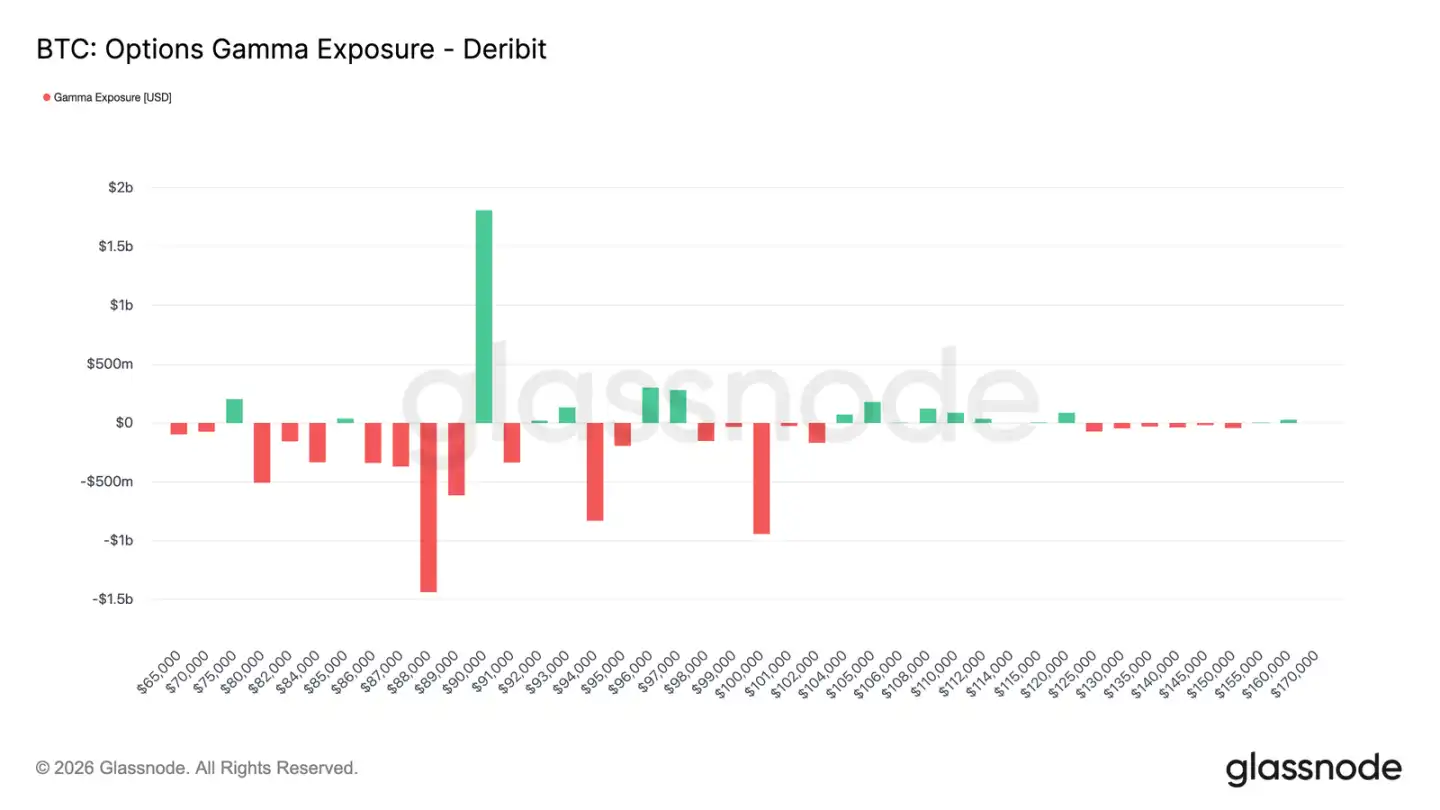
Dealer Positioning Flips Net Short
Dealer gamma positioning is a key structural force influencing short-term price action. Recent flow data shows investors actively bought downside protection, leaving dealers net short gamma below $90k. Concurrently, some investors financed this by selling upside calls, leaving dealers net long gamma above $90k.
This creates an asymmetric setup: Below $90k, dealers are net short gamma, meaning price declines could be self-accelerating due to their hedging activity (selling futures or spot). Above $90k, dealers' net long gamma acts as a stabilizer, as rallies trigger their hedging buys, dampening the move.
Thus, price action below $90k is likely to remain fragile, while the $90k level itself becomes a key friction point. A decisive and sustained break above this level would require sufficient market momentum and confidence to digest the dealer hedging flows and push their gamma exposure to higher strikes.
Conclusion
The Bitcoin market remains in a state of low participation, with current price action stemming more from 'reduced selling pressure' than 'aggressive buying.' On-chain data continues to reveal issues of supply overhang and fragile structural support. Spot flows, while improved, have not yet translated into a sustained buying trend.
Institutional demand remains cautious, with treasury flows stabilizing around the zero line and activity dominated by sporadic trades. Derivatives markets are quiet, with futures volume contraction and constrained leverage use, collectively creating a low-liquidity environment where price is hypersensitive to slight positioning changes.
The options market also reflects this restraint. Volatility repricing was confined to the short term, hedging demand has normalized, and elevated volatility risk premiums continue to anchor overall vol levels.
Overall, the market appears to be quietly building a base. The current consolidation stems not from overheated participation but from a temporary pause in investor conviction, as they await the next catalyst capable of inspiring broad engagement.