Ethereum Shows Signs Of Strength With Stronger Network Activity Supporting Growth

bitcoinistPublished on 2026-05-14Last updated on 2026-05-14

Abstract

Despite a slight price pullback, Ethereum's fundamentals show strength, driven by robust network activity and transaction growth. The altcoin has broken out of a multi-year consolidation phase, suggesting potential for significant upward movement. Over 7.33 million ETH (6% of supply) is locked on corporate balance sheets, and Ethereum's inflation rate is now lower than Bitcoin's post-Merge. Network performance is surging, with transaction volumes on the mainnet and Layer 2 solutions reaching all-time highs. Ethereum maintains a dominant 55-60% share of the Total Value Locked (TVL) in DeFi since mid-2022, reinforced by deep collateral markets and proven resilience. It hosts 50% of all stablecoin market capitalization and over 60% of tokenized real-world assets, indicating strong institutional trust and sticky capital. Experts note the fundamentals are aligning with the positive technical chart setup, strengthening investor conviction in Ethereum's long-term value.

While the price of Ethereum may have slightly pulled back, the underlying structure and fundamentals continue to show signs of strength. At the same time, the ETH network is demonstrating robust performance as transaction activity sees a steady increase across the blockchain.

Growing Network Strength Pushes Ethereum Back Into Focus

Ethereum’s recent upward momentum in the past few days is not only seen in its price action. This renewed strength is being observed across the ETH ecosystem as the network’s performance surges, which is triggering fresh momentum in the market.

During the period, there has been rising transaction activity, stronger on-chain engagement, and continued growth in key sectors that appear to be strengthening investors’ conviction in the network’s long-term value.

After examining the ETH chart in the monthly time frame, Leon Waidmann, a market expert and head of research at Lisk, revealed that the altcoin is currently exhibiting a trend that has caught the attention of the market. The chart shows a three-year sideways consolidation in a clean range supported by a breakout. Specifically, the momentum indicator at the bottom just broke out of its multi-year base.

ETH has been ranging since 2023, and building energy at the base of the structure. After a period of building strength, the altcoin has broken above the multi-year resistance, which has created a classic accumulation before a major move.
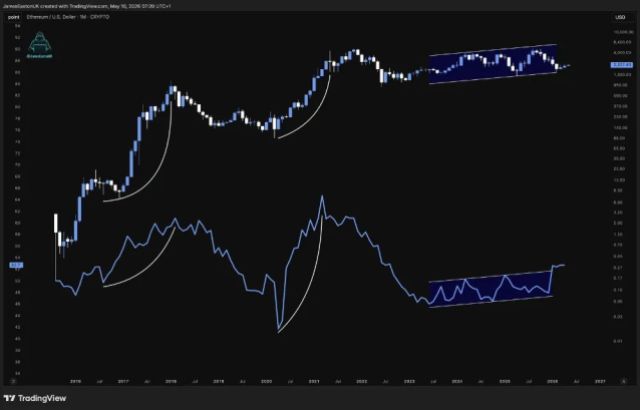
Source: Chart from Leon Waidmann on X

Consolidation phases are sometimes a positive reaction as they can precede upside movement. Waidmann noted that the longer the consolidation phase, the bigger the move out of it will be. What makes this period interesting is the increased network performance that is coinciding with the current momentum.

As stated by the expert, over 7.33 million ETH, representing 6% of all ETH supply, are locked on corporate balance sheets. Furthermore, inflation across the ETH ecosystem is currently lower than that of Bitcoin since the introduction of the Merge update. Other significant achievements include the surge in transactions on the ETH mainnet and layer 2 solutions, reaching new all-time highs. “The fundamentals are catching up, and the chart is setting up,” Waidmann added.

ETH Dominating DeFi And Lending

Etherealize has shared a recent report from Galaxy Research regarding Ethereum. In the report, the platform’s VP Research noted that ETH’s TVL market share has held remarkably steady at roughly 55% to 60% since mid-2022. The ETH network is witnessing notable liquidity, reinforcing its dominance in lending and DeFi.

This is due to the depth of its collateral markets, oracle infrastructure, and surviving multiple market crashes. Such development leads to the creation of a trust premium that newer chains cannot quickly replicate, particularly for the largest allocators whose risk tolerance is the lowest.

Also, stablecoin issuance on the network has skyrocketed to 50% of all stablecoin market cap, and over 60% of all tokenized real-world assets are issued on ETH. According to the platform, this is possibly some of the stickiest capital on Ethereum because institutional RWA issuers select a chain after months of legal examination, custodian integration, and compliance sign-off.

ETH trading at $2,301 on the 1D chart | Source: ETHUSDT on Tradingview.com

Trending Cryptos

Related Questions

QDespite a slight price pullback, what shows signs of strength for Ethereum according to the article?

AThe underlying structure and fundamentals of Ethereum, particularly the robust network performance and steady increase in transaction activity, show signs of strength.

QWhat key on-chain metrics are strengthening investor conviction in Ethereum's long-term value?

ARising transaction activity, stronger on-chain engagement, and continued growth in key sectors are strengthening investor conviction.

QWhat did analyst Leon Waidmann note about Ethereum's multi-year consolidation phase on the monthly chart?

AHe noted that the longer the consolidation phase, the bigger the move out of it will be, describing it as a classic accumulation before a major move.

QWhat is Ethereum's approximate TVL (Total Value Locked) market share in DeFi since mid-2022, as cited in the Galaxy Research report?

AEthereum's TVL market share has held remarkably steady at roughly 55% to 60% since mid-2022.

QWhat specific achievements highlight Ethereum's dominance in stablecoins and tokenized real-world assets (RWAs)?

AStablecoin issuance on Ethereum is 50% of the total market cap, and over 60% of all tokenized real-world assets are issued on the network.

Related Reads

Mass Production Timelines Shift Collectively, Is Glass Substrate Facing Its First Major Test?

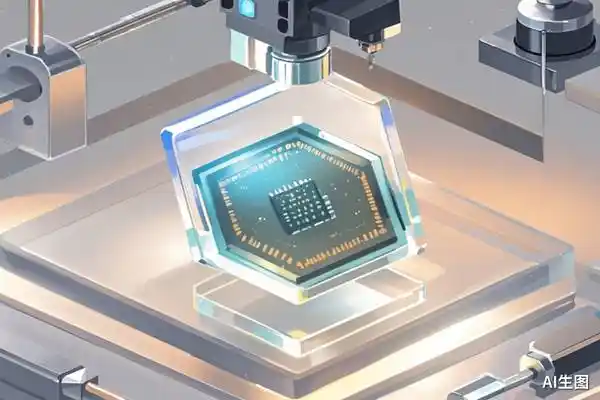
The article discusses the shift in the glass substrate industry from initial announcements to practical delivery and reliability testing. In mid-to-late 2026, key developments include Intel and Lens Technology advancing AI-era glass substrate packaging cooperation, Avaco launching a TGV pilot line in South Korea, and reports that Samsung Electro-Mechanics is facing delays, potentially pushing mass production beyond 2028. The core challenge has moved from material comparisons to rigorous customer reliability certifications, focusing on thermal cycling, humidity resistance, and stable electrical performance post-processing. Samsung Electro-Mechanics' reported delay, linked to client sample reliability bottlenecks, reflects a broader industry trend where timelines are being adjusted. Other players like SKC/Absolics, LG Innotek, and DNP are also targeting initial supply systems or pilot lines between 2027-2028, with mainstream adoption potentially post-2030. The delays highlight that the current hurdle is supply-side technical maturity—particularly achieving stable yields and passing client certifications—rather than a lack of demand driven by AI and HPC. The collaboration between Intel and Lens Technology focuses on establishing design and verification standards. Meanwhile, Japanese firms like Shinko Electric and DNP are progressing with multi-layer wiring and stress control. Chinese panel makers, led by BOE, are rapidly entering with automated pilot lines and customer testing. On the material side, companies like Corning are exploring glass substrates for co-packaged optics (CPO), potentially offering an earlier application path than core substrates. Ultimately, the central barrier is TGV (Through Glass Via) yield, currently around 60-70%, lower than organic substrates, with higher costs due to glass brittleness and process complexity. The industry's current phase represents its first major test in transitioning from lab R&D to volume manufacturing, with success hinging on overcoming these yield and certification challenges.

marsbit9m ago

Mass Production Timelines Shift Collectively, Is Glass Substrate Facing Its First Major Test?

marsbit9m ago

Crypto Bull Is Back, Which Assets Bounced the Hardest?

The cryptocurrency market experienced a significant surge last week, with Bitcoin rallying over 26% to nearly $79,500, its strongest weekly gain since March 2023, fueling discussions of a renewed bull market. This rebound highlighted several key market dynamics. First, short-term directional shifts are increasingly tied to U.S. policy cycles. The rally was driven by two major catalysts: the U.S. Treasury's announcement to increase long-term bond buybacks, easing macro liquidity pressures, and former President Trump's push for clearer crypto legislation, boosting regulatory certainty and risk appetite. Second, Bitcoin spot ETFs solidified their role as a leading market indicator. In the week ending August 21, U.S. Bitcoin and Ethereum spot ETFs saw a combined net inflow of $2.6 billion, the highest since October 2025, signaling strong institutional re-entry. Third, the rally followed a clear capital rotation pattern: Bitcoin's breakout ignited broader gains, with Ethereum (up nearly 30%), major altcoins, and meme coins sequentially posting larger percentage increases. Analysis of the top performers among the top 50 altcoins by market cap revealed the week's biggest gainers: ENA (Ethena) led with a 100.75% surge, fueled by a Coinbase partnership. It was followed by PUMP (Pump.fun, up 88-99%), STX (Stacks, up 82-94%), TRUMP (Official Trump, up 79-91%), and ZEC (Zcash, up 75.15%), which uniquely reached a new all-time high. Meme coins like BOME on Solana also saw explosive gains, exemplifying the high-risk, high-reward sentiment. The rally illustrated a clear path: Bitcoin set the stage, major coins like Ethereum led the charge, and altcoins/meme coins delivered the most explosive returns, mapping the gradient of returning market enthusiasm.

marsbit22m ago

Crypto Bull Is Back, Which Assets Bounced the Hardest?

marsbit22m ago

Wuhan is About to Witness Its Largest IPO in History

Wuhan is poised for its largest-ever IPO as Yangtze Memory Technologies Co., Ltd. (YMTC) has officially applied for a listing on the Shanghai Stock Exchange's STAR Market, seeking to raise 33 billion yuan. The domestic leader in 3D NAND flash memory chips completed its IPO辅导 (tutoring) process in a record three months, with market expectations valuing the company at 300 billion yuan or higher. YMTC's roots trace back to 2006 with the founding of Wuhan Xinxin. After surviving the global financial crisis and periods of operational difficulty, the company was formally established in 2016 through a joint investment involving Tsinghua Unigroup, the National Integrated Circuit Industry Investment Fund (the "Big Fund"), and local Hubei government funds. With a distinct "national team" background, its major shareholders include provincial and municipal state-owned assets committees and the Big Fund. Based in Wuhan's Optics Valley (East Lake High-tech Development Zone), YMTC's potential listing highlights the region's rise as a tech hub. Optics Valley is already home to 72 listed companies and has ambitious plans to exceed 100 by 2030. The zone recently established four industry-focused母基金 (mother funds) totaling 18 billion yuan to further boost sectors like integrated circuits and optoelectronics. YMTC's IPO would complete the "Optics Valley Seven Stars," a group of leading local optoelectronic and communication giants.

marsbit22m ago

Wuhan is About to Witness Its Largest IPO in History

marsbit22m ago

Trading

Spot

Hot Articles

Discussions

Welcome to the HTX Community. Here, you can stay informed about the latest platform developments and gain access to professional market insights. Users' opinions on the price of ETH (ETH) are presented below.

活动图片