Ethereum rebounds: Can ETH clear $2.2K as U.S. demand grows?

AmbcryptoPublished on 2026-03-06Last updated on 2026-06-15

Abstract

Ethereum rebounds from the $1,800–$1,900 support zone as U.S. demand strengthens, with $2,200 emerging as the first key test for the recovery.

Ethereum’s [ETH] decline through late January and February pushed price sharply toward the $1,924–$1,801 support zone, where selling pressure finally slowed.

As price briefly spiked near $1,801, buyers stepped in aggressively, defending the yellow support level and preventing a deeper breakdown.

Soon after, the price stabilized near $1,924, a historically validated level that has repeatedly attracted demand. Meanwhile, the RSI recovered to 51.48, at press time, signaling that bearish momentum has faded while buyers gradually regain control.

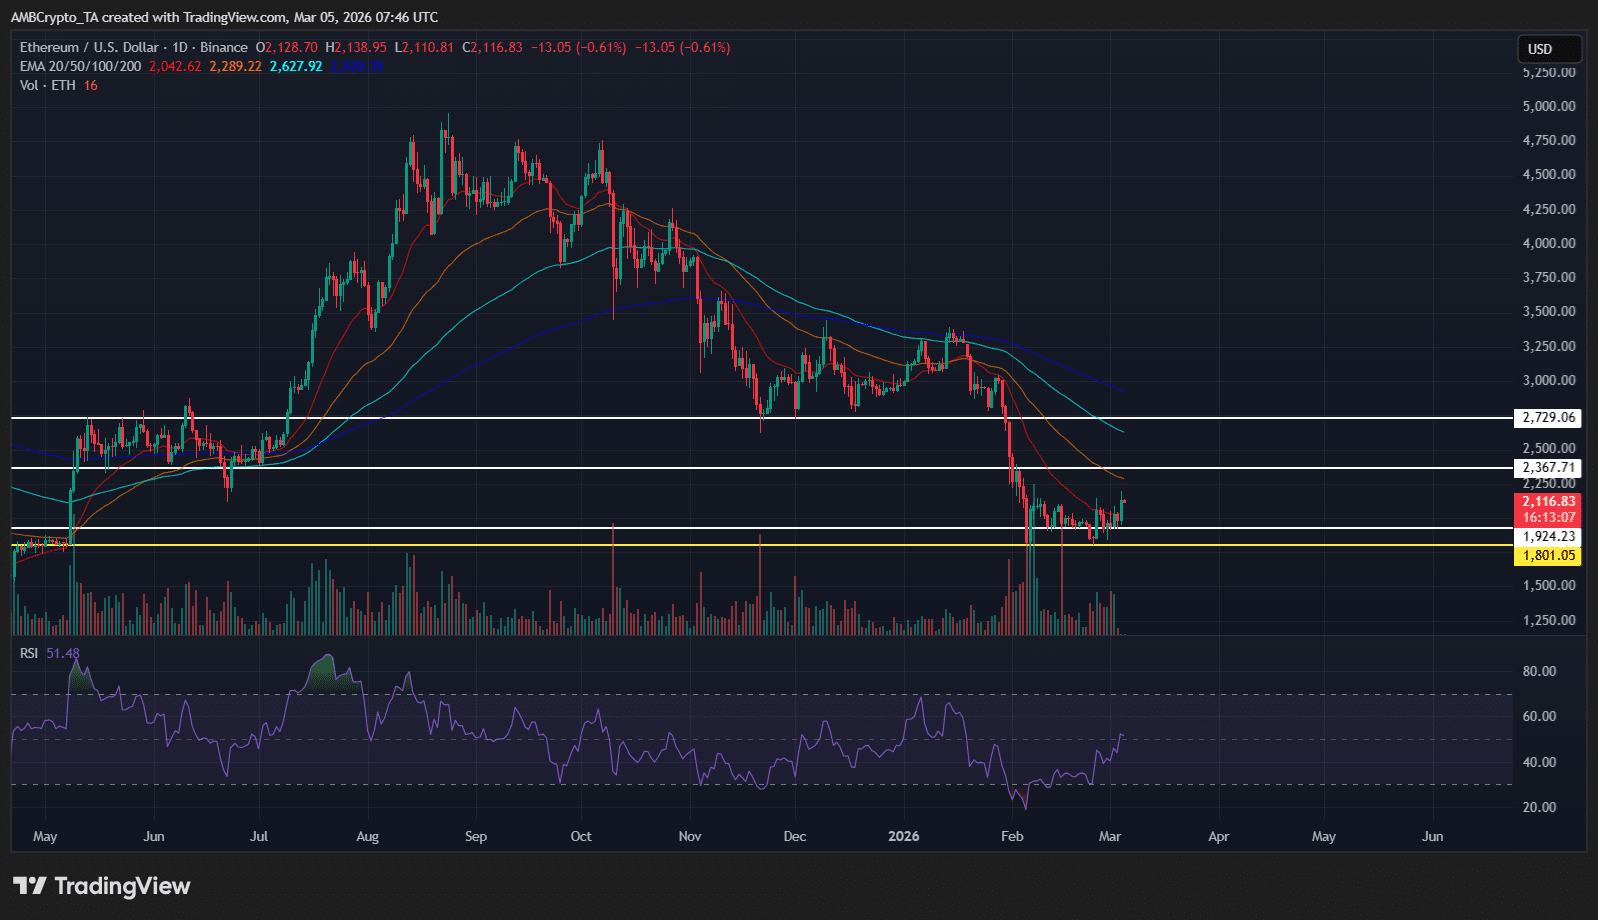
However, Ethereum still trades below major trend indicators. The 20-day EMA neared $2,042, and the 50-day EMA, around $2,289 continue acting as dynamic resistance, showing that sellers remain active during rebounds.

As the recovery unfolds, traders are now watching the $2,111–$2,150 resistance cluster, where the recent bounce approaches the upper boundary of a developing bearish pennant structure.

If buyers reclaim this zone, momentum could extend toward $2,250–$2,300. Meanwhile, failure here may send the price back toward $1,900 to retest the defended accumulation floor.

U.S. buying pressure supports Ethereum’s recovery

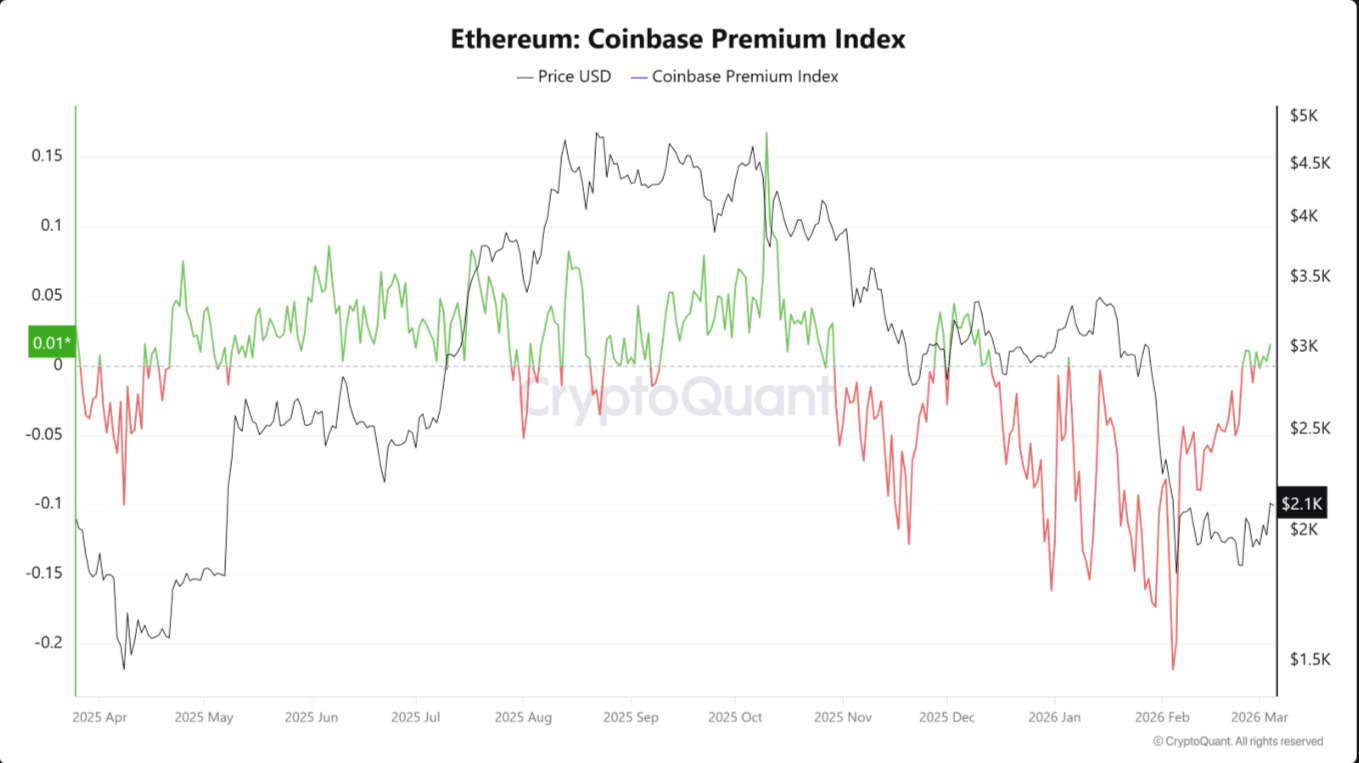
After Ethereum’s rebound from the $1,850–$1,900 demand zone, spot and exchange-flow signals indicate who supported the move.

First, the Coinbase Premium Index has shifted back into positive territory near +0.01, showing ETH has traded slightly higher on U.S. venues. As this premium holds, it suggests steady spot bidding rather than a one-off retail spike.

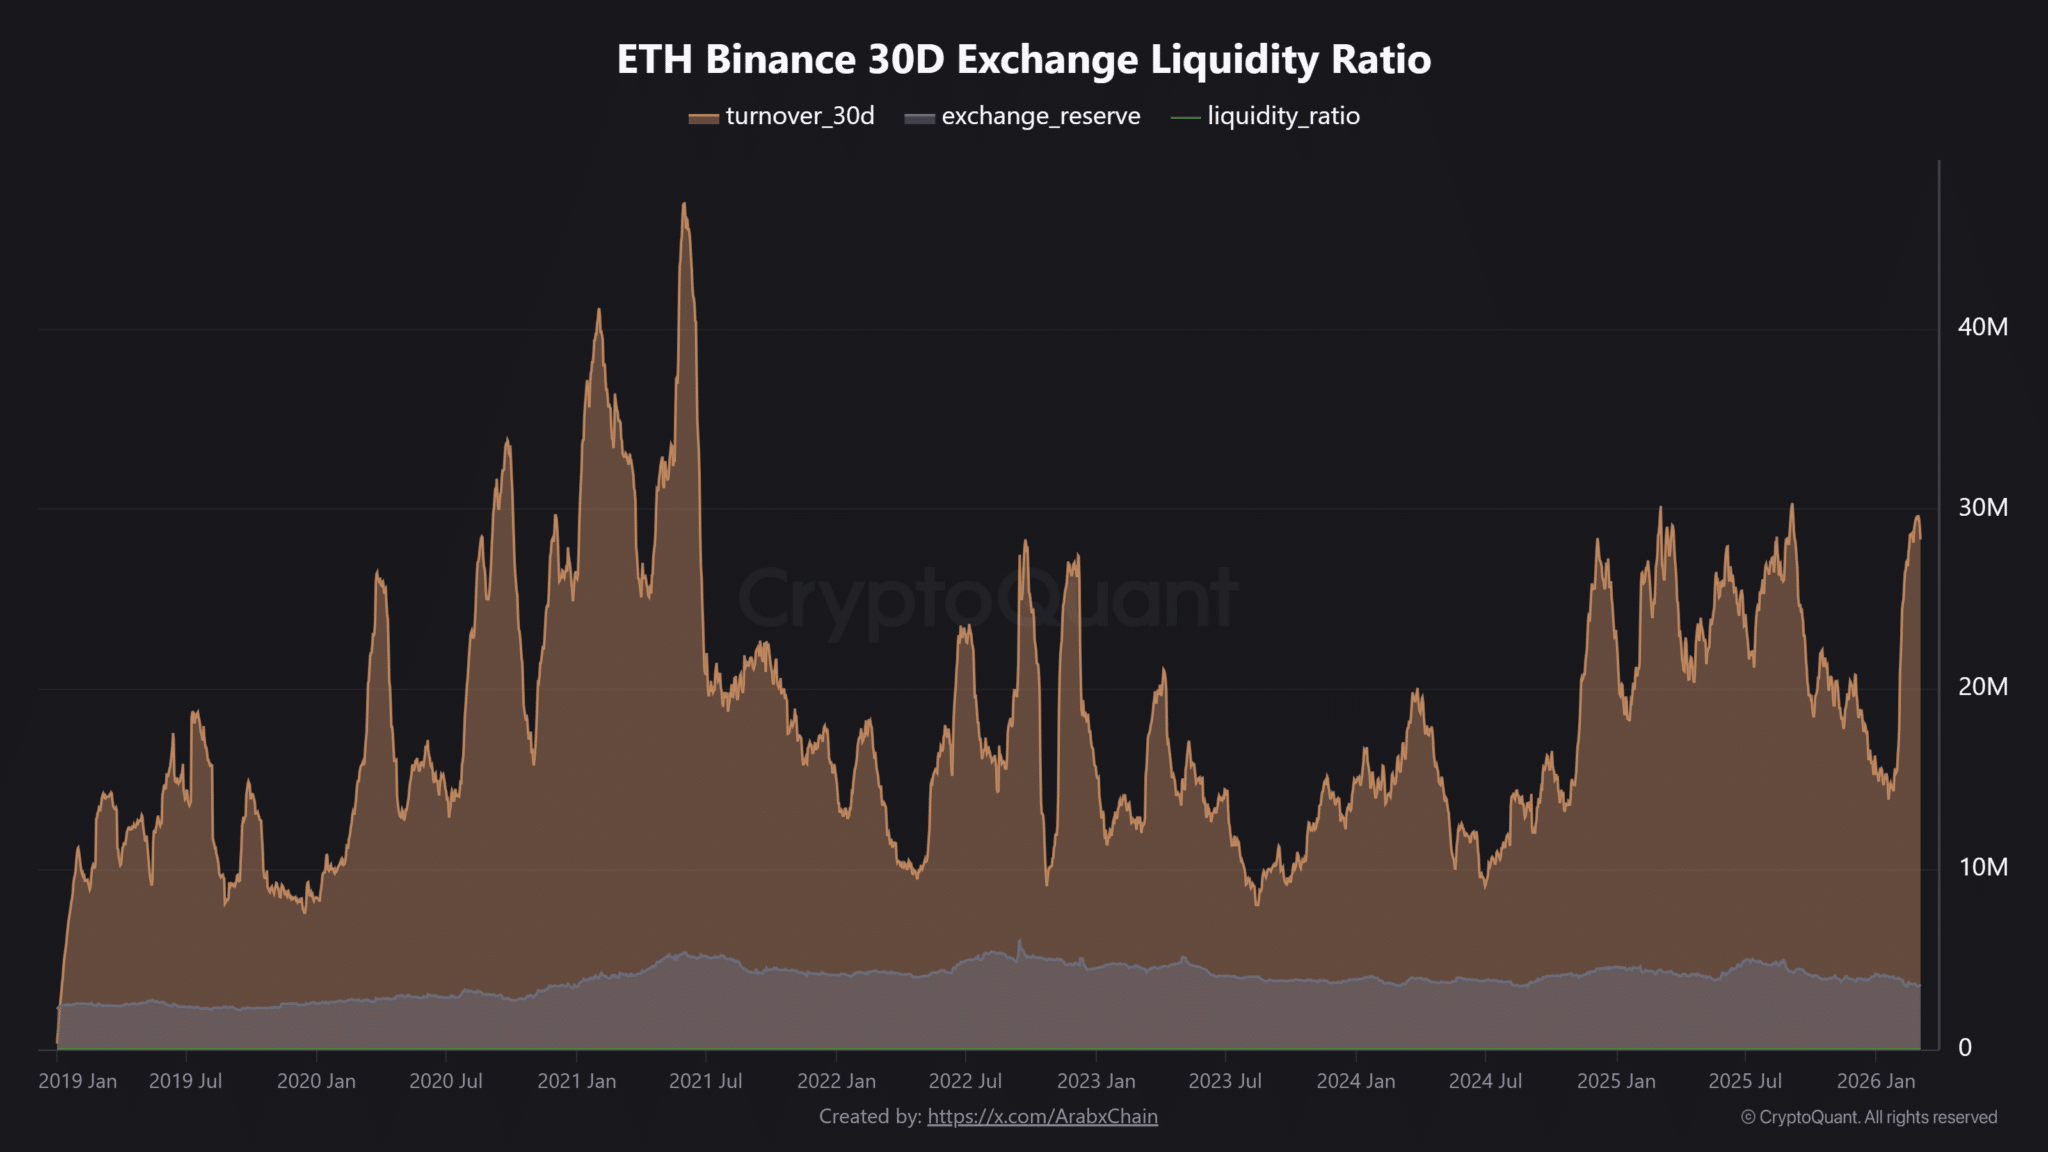
Meanwhile, CEX activity has also accelerated, which fits the rebound’s volatility regime. The 30-day ETH turnover jumped to roughly 29.6 million ETH, the highest since September.

At the same time, CEX reserves sat near 3.5 million ETH as of writing, meaning the market recycled the available supply multiple times. This lifted the Liquidity Ratio to about 8.47, reflecting intense repositioning and higher speculative churn.

Taken together, fast turnover can reflect short-term trading or derivatives collateral use, while a sustained positive Coinbase premium implies persistent U.S. demand.

If the premium continues rising while the price holds above key supports, institutional accumulation becomes a stronger explanation than retail-driven speculation.

Ethereum rebound faces first structural test!

Ethereum traded near $2,128 at press time while consolidating above the $1,900 support region, where buyers recently absorbed the February sell-off.

This stabilization followed a sharp wick into the $1,700–$1,850 demand zone, signaling aggressive accumulation near the cycle’s lower boundary.

Meanwhile, Fibonacci retracement levels now define the recovery structure, with the first major resistance at the 61.8% level around $2,603, often seen as critical for trend reversals.

As the price approaches this zone, sellers may attempt to defend the broader bearish structure.

Above that, the 50% retracement around $2,985 represents the midpoint of the entire decline and could act as the next major upside objective.

If momentum continues strengthening, the price may eventually test the 38.2% level near $3,368, where a larger supply historically emerges.

At the same time, downside protection remains concentrated near $1,900, while the deeper $1,700–$1,850 zone serves as the key structural floor.

Maintaining this support keeps the current rebound intact while higher Fibonacci levels determine the recovery’s strength.

Related Reads

The Value Distribution of Stablecoins

**Summary: The Value Distribution of Stablecoins** The article argues that stablecoins are evolving from mere trading tools into broader channels for dollar access. It divides the stablecoin ecosystem into four layers to analyze how value is distributed: 1. **Issuance Layer:** Mints stablecoins, holds reserve assets, and captures the spread between reserve yield and user costs (e.g., Tether, Circle). This layer currently earns the largest profit margin. 2. **Infrastructure Layer:** Connects stablecoins to the traditional financial system, handling fiat on/off-ramps, banking integration, compliance (KYC/AML), and asset management (e.g., Bridge, BVNK). This is the "unglamorous" but critical work, building the essential bridges between crypto and real-world finance. 3. **Acquiring/Distribution Layer:** Integrates stablecoins into merchant systems, manages payment flows, and provides enterprise financial software (e.g., Stripe, Coinbase). They act as the access point for businesses. 4. **Application Layer:** The end-users and businesses that ultimately use stablecoins for payments, settlements, or as a store of value. They benefit from convenience but have little pricing power. The core thesis is that while the issuance layer currently dominates profits, the often-overlooked **infrastructure layer holds significant long-term potential**. The real challenge and barrier to mass adoption is not the on-chain transfer of stablecoins (which is simple), but the complex "last mile" integration into existing business workflows, banking systems, and regulatory frameworks across different countries. Companies in this layer are currently in a "land grab" phase, investing heavily to build networks, secure bank partnerships, and establish compliance pathways. While their position is currently pressured by the profitable issuers above and distribution platforms below, the article suggests that if stablecoins become a default financial rail for businesses, the infrastructure providers who have done the hard work of integration will ultimately gain strong pricing power and become entrenched, essential players.

marsbit1h ago

The Value Distribution of Stablecoins

marsbit1h ago

The Value Distribution of Stablecoins

The Value Distribution of Stablecoins The article argues that stablecoins are evolving from a mere trading tool into a broad "dollar channel." It analyzes the industry's value chain through four layers: 1. **Issuance Layer (e.g., Tether, Circle):** The top layer that mints stablecoins, holds reserve assets, and captures the thickest interest rate spread. 2. **Infrastructure Layer (e.g., Bridge, BVNK):** Connects stablecoins to the traditional financial system, handling critical but complex "dirty work" like fiat on/off-ramps, banking integration, compliance (KYC/AML), and cross-border settlement. 3. **Acquiring/Distribution Layer (e.g., Stripe, Coinbase):** Embeds stablecoins into merchant systems, manages payment flows, and integrates with enterprise software. 4. **Application Layer:** End-users and businesses that ultimately use stablecoins for payments, settlement, or storing value. The author posits that while the issuance layer currently captures the most profit, the most overlooked and potentially critical layer is infrastructure. The core challenge for stablecoin adoption isn't the on-chain transfer (which is simple), but bridging the gap between blockchain and the real-world financial system. This involves solving practical problems for businesses: fiat conversion, reconciliation, tax handling, and user onboarding. Infrastructure companies are currently in a difficult "land-grab" phase—building networks, securing banking relationships, and achieving compliance country-by-country. They face pressure from both the profitable issuance layer above and distribution platforms below. However, the author suggests this layer is building a crucial moat. Once stablecoins become a default business rail, the infrastructure players who have done the hard work of integration may gain significant, durable value and pricing power.

链捕手1h ago

The Value Distribution of Stablecoins

链捕手1h ago

How to Do Research Well: Deliberately Practice the Real Skills That Matter

No one truly teaches you how to do research. You're often given a desk, a pre-selected problem, and vague instructions to "create something new." Consequently, many people reverse-engineer the job based on visible outputs—papers, posts, announcements—learning only how to *appear* like a researcher rather than how to *become* one. True research capability is built from stacking small, trainable skills, nearly all of which can be developed through deliberate practice. **Pick Your Own Problem:** Most researchers absorb problems from advisors or trends, lacking the underlying reasoning. Choosing a problem you genuinely care about, as John Schulman advises, leads to original work. Develop "taste" like a muscle: predict experiment outcomes, guess paper results from methods, and track which findings remain important over time. **Upgrade Your Inputs:** Relying on shared reading lists (arXiv hot lists, filtered group chats) leads to unoriginal conclusions. Undervalued old literature often holds crucial insights (e.g., MoE, LSTM, backpropagation). Richard Sutton's "The Bitter Lesson" or Claude Shannon's 1952 talk on creative thinking are more predictive than lengthy modern surveys. Breadth matters as much as depth: draw from neuroscience, mechanism design, hardware knowledge, and honest statistics. Read papers directly, especially appendices and limitations sections. **Write Everything Down:** As Paul Graham noted, writing exposes flaws in seemingly mature ideas. Writing is the cheapest defense against self-deception. Following Feynman's principle, Darwin programmatically wrote down facts contradicting his theory to combat memory bias. Maintain a detailed log of hypotheses, setups, predictions, results, and updated understandings. Reviewing past logs fosters essential humility.

marsbit3h ago

How to Do Research Well: Deliberately Practice the Real Skills That Matter

marsbit3h ago

Trading

Spot
Futures

Hot Articles

Discussions

Welcome to the HTX Community. Here, you can stay informed about the latest platform developments and gain access to professional market insights. Users' opinions on the price of ETH (ETH) are presented below.

活动图片