Ethereum Holds $3,000 as Whales Accumulate: Key Resistance and Support Levels to Watch

bitcoinistPublished on 2026-01-22Last updated on 2026-01-22

Abstract

Ethereum has stabilized above $3,000 after a recent sell-off, with large holders accumulating around 290,000 ETH worth approximately $360 million during the dip. Despite this, market sentiment remains cautious, as the smart money index has not yet signaled a strong upward move, and derivatives data show negative funding rates and increased demand for downside protection. Technically, ETH is trading within a symmetrical triangle, with key resistance near $3,050 and $3,146–$3,164. A break below the triangle’s lower boundary around $2,910 could lead to a decline toward $2,610.

Ethereum (ETH) has stabilized above the $3,000 mark after a sharp sell-off earlier this week, as large holders increased their exposure during the dip. The recovery follows a volatile period in which ETH briefly fell below key technical levels, triggering liquidations and renewed caution across the broader crypto market.

On January 22, Ethereum was trading around $3,003, up roughly 1.3% over 24 hours. The rebound came after ETH dropped nearly 13% between January 19 and 21, touching the $2,900 area for the first time in four weeks.

That decline coincided with heightened macro uncertainty, ETF outflows, and the liquidation of over $480 million in bullish leveraged positions.

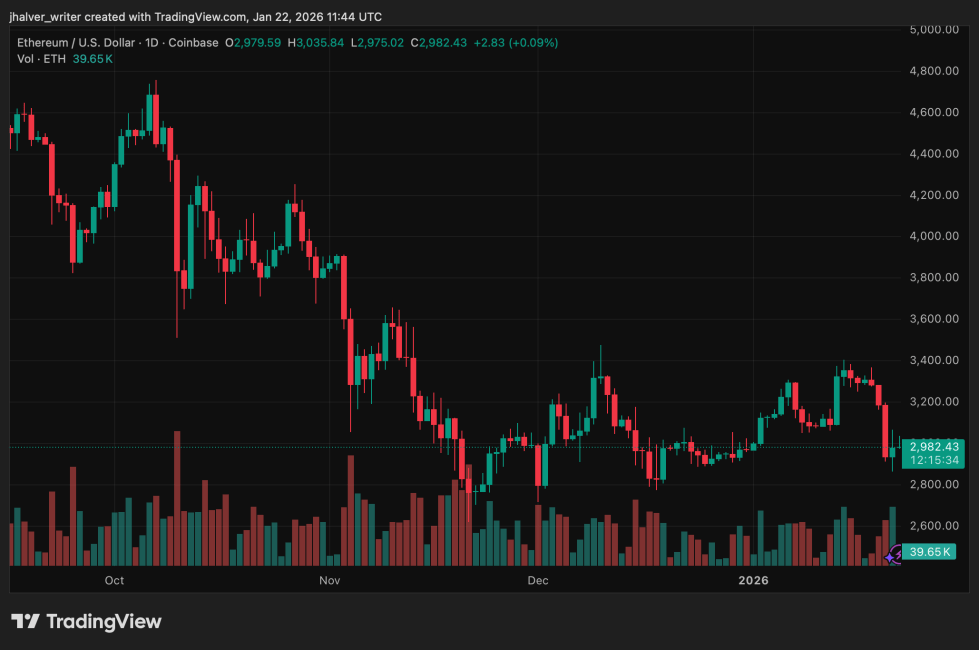
ETH's price trends to the downside on the daily chart. Source: ETHUSD on Tradingview

Ethereum Accumulation Contrasts With Cautious Positioning

On-chain data shows that large Ethereum holders accumulated aggressively during the recent downturn. Whale balances increased by roughly 290,000 ETH over a two-day period, representing purchases worth close to $360 million at current prices.

This behavior suggests that some long-term investors view the recent pullback as a buying opportunity. However, other indicators point to a more cautious stance among experienced traders.

The smart money index remains below its signal line, a level that has historically been crossed ahead of stronger upside moves. In previous instances, such confirmations preceded double-digit gains, but no such signal has emerged so far.

Derivatives data support this wait-and-see approach. ETH perpetual futures funding rates briefly turned negative, indicating reduced confidence among leveraged traders. Options markets have also shown increased demand for downside protection after repeated rejections near the $3,400 level over the past two months.

Technical Structure Highlights Tight Trading Range

From a technical perspective, Ethereum is trading within a symmetrical triangle on the daily chart.

Momentum indicators show a bullish divergence, the relative strength index has formed higher lows while the price made lower lows between November and mid-January. This pattern suggests that selling pressure may be weakening, though confirmation is still lacking.

The immediate level to watch on the upside is $3,050, a former support zone that ETH lost during the recent sell-off. A sustained daily close above this level would indicate short-term stabilization.

Above that, the $3,146–$3,164 range represents a dense supply zone, where approximately 3.4 million ETH have been accumulated. This area is expected to act as a strong resistance.

Related Reading: Bitcoin Took Top Spot In 2025 Crypto Payments, Litecoin Third-Most Used: CoinGate

On the downside, failure to hold the triangle’s lower boundary near $2,910 could open the door to a deeper move toward the $2,610 support area.

Cover image from ChatGPT, ETHUSD chart on Tradingview

Related Reads

Dialogue with a Macro Analyst: AI Drains All Liquidity from U.S. Stocks, $40K Bitcoin is the True Bottom

In a recent discussion, macro strategist Luke Groman, founder of FFT LC, presented a sobering analysis of current markets. He argues that while the S&P 500 hits new highs, this is largely driven by just seven AI stocks, which are "sucking all the oxygen and liquidity out of the room." Bitcoin, which he calls the "last working smoke alarm for liquidity," is signaling trouble, having entered a difficult period. Groman explains that the AI boom is fueled by accounting practices that front-load revenue, creating an illusion of high profits while cash is being depleted. He warns this cycle could reverse sharply when construction slows. His base case is that stocks will rise in dollar terms but fall significantly when measured in gold or Bitcoin, highlighting that long-term US Treasury futures have already lost 90% of their value against gold over the past decade. He points to major structural risks, including China's dominance in rare earths—a small commodity market underpinning trillions in tech stock value—and the prolonged closure of the Strait of Hormuz, which he calls a "Suez Moment" for the US. This, combined with a shift towards a "no ticky, no washy" proof-of-work system for settling trade (using gold, not trust), signals deeper systemic distrust. Regarding US debt, Groman notes that historically, all 58 countries that reached a 130% debt-to-GDP ratio defaulted, primarily through inflation. The US crossed this threshold in 2020. He also highlights a contradiction in the AI narrative: if it's as transformative as claimed, it must destroy white-collar jobs, threatening half of US tax revenue—a reality at odds with the "no job loss" messaging from tech leaders. On Bitcoin, Groman sold most of his position near the top and hasn't fully re-entered. Citing technical analysis from Northstar Bad Charts, he suggests a potential bottom around $40,000 could materialize in Q3 or Q4. He concludes that while he may be labeled a doomsayer, his view is simply realistic, grounded in historical precedents and current macro pressures.

marsbit2h ago

Dialogue with a Macro Analyst: AI Drains All Liquidity from U.S. Stocks, $40K Bitcoin is the True Bottom

marsbit2h ago

Trading

Spot
Futures

Hot Articles

Discussions

Welcome to the HTX Community. Here, you can stay informed about the latest platform developments and gain access to professional market insights. Users' opinions on the price of ETH (ETH) are presented below.

活动图片