Interview with Robinhood Executive: Meme + Tokenized US Stocks as "Barbell" Customer Acquisition Strategy, All Business Lines Achieve Hundreds of Millions in Revenue
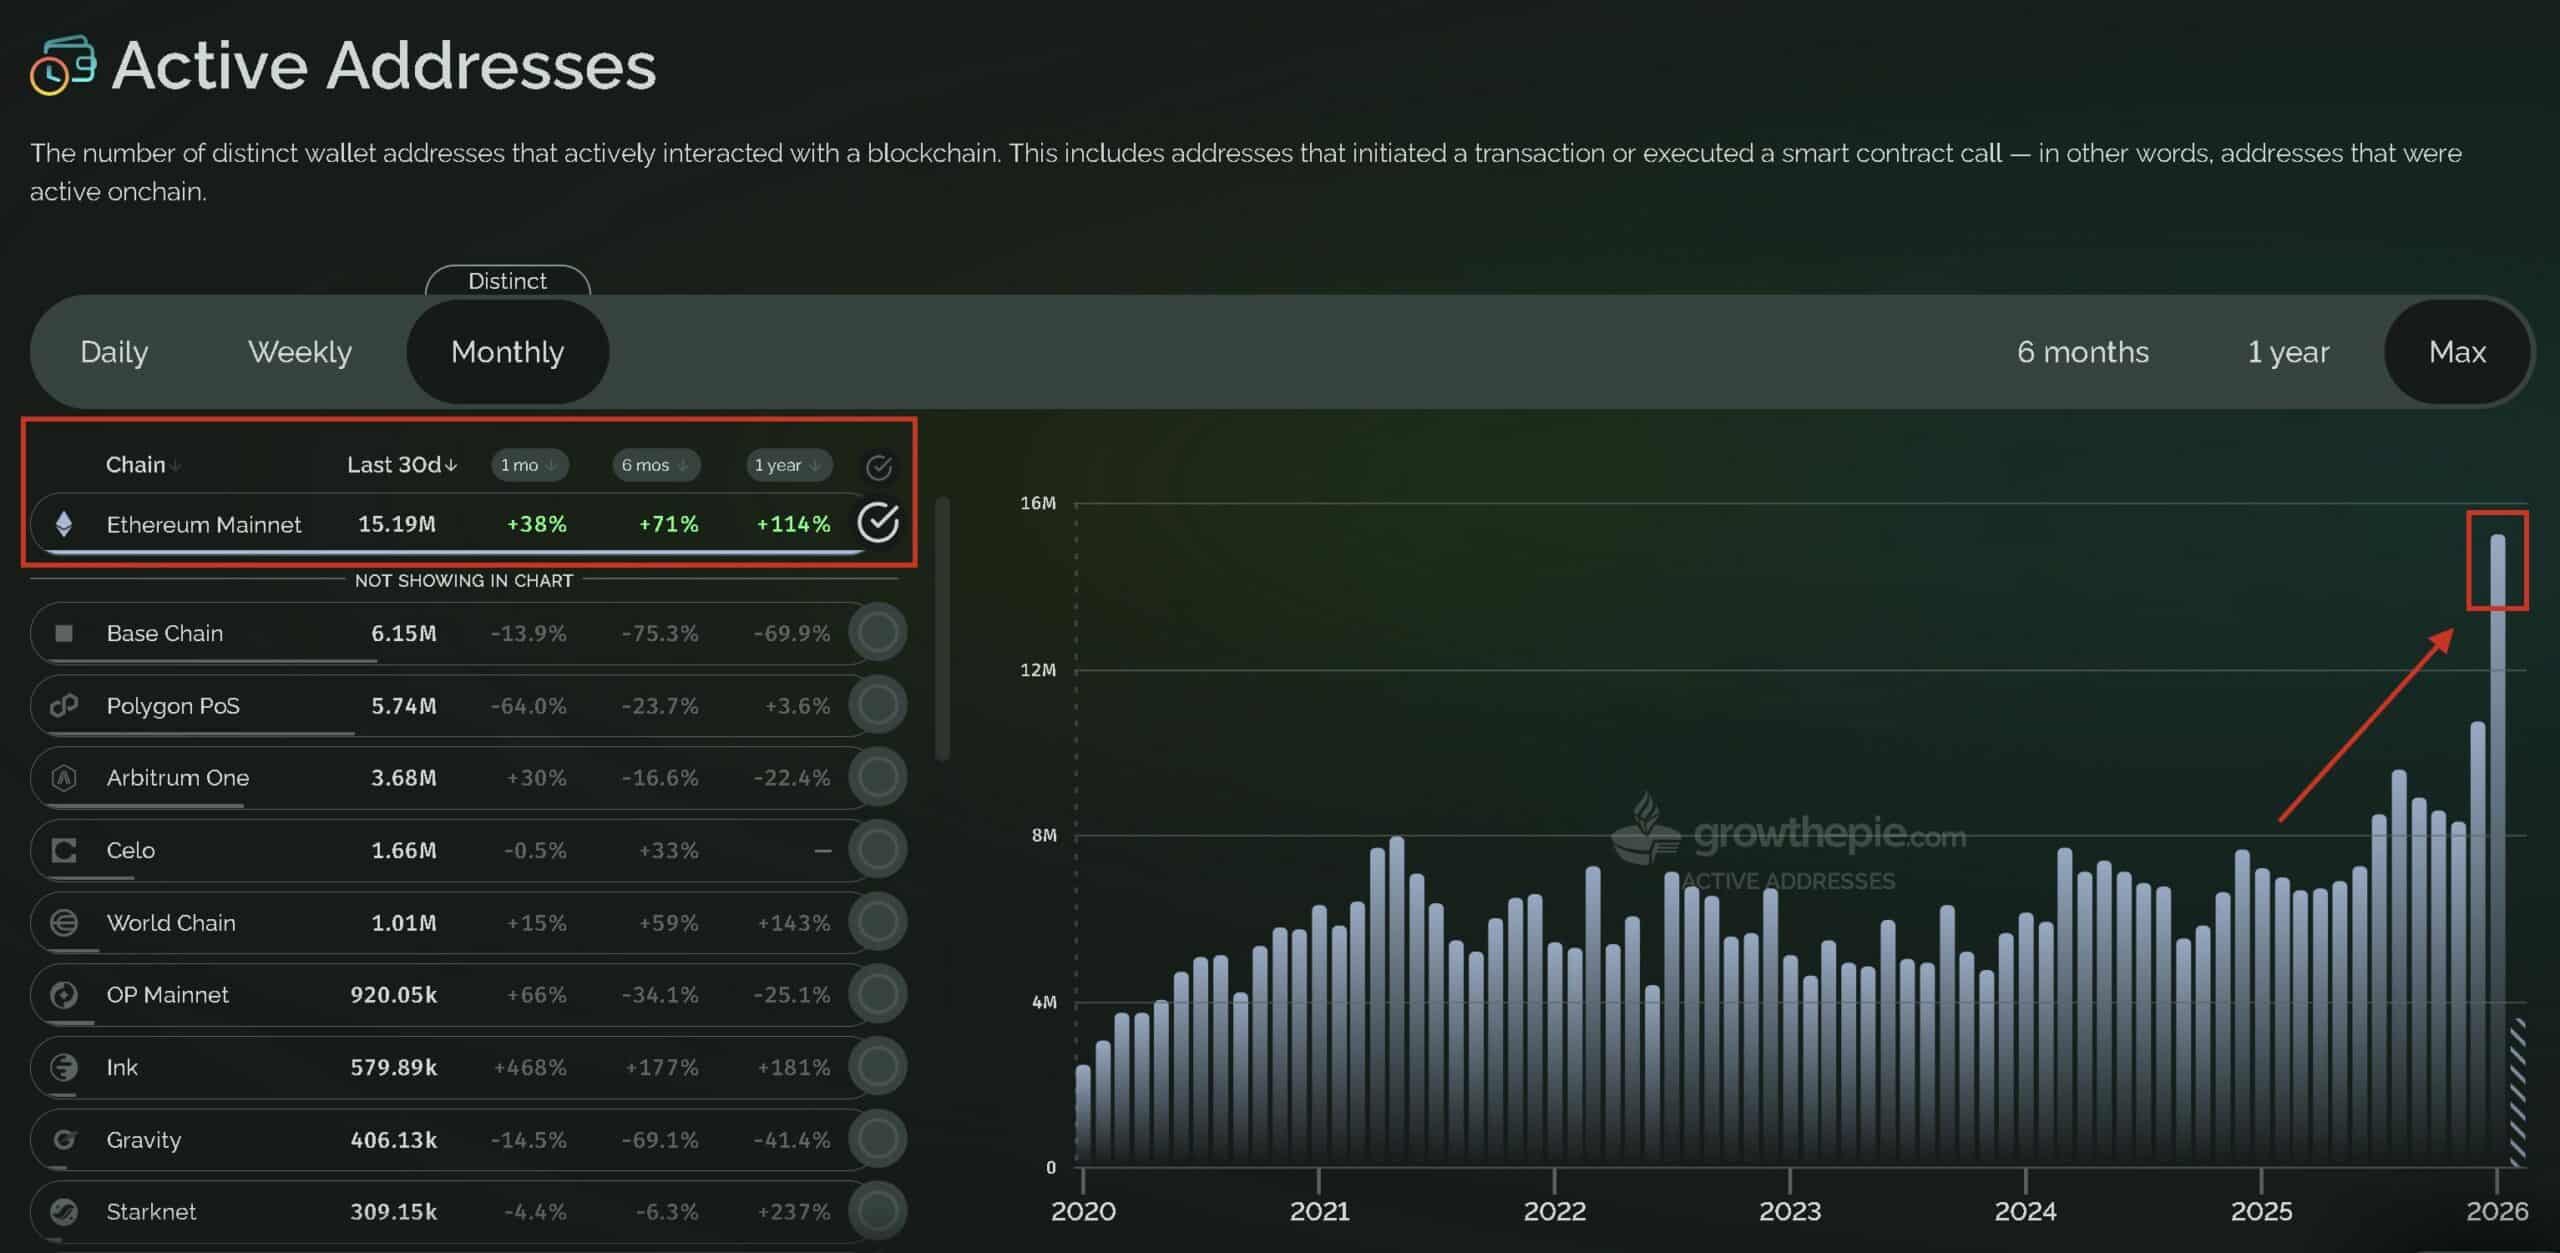
Interview with Robinhood executive Johann Kerbrat reveals the company's "barbell" customer acquisition strategy for its new Robinhood Chain, combining meme tokens with tokenized stocks. Three weeks after mainnet launch, the chain has seen over $3B in weekly DEX volume and 105M transactions. Kerbrat explains the logic behind the permissionless chain: meme tokens attract DeFi users, while tokenized real-world assets (RWA), currently over 90 US stocks and ETFs accessible in 120+ countries, serve global users. The goal is to bring Robinhood's 27 million funded accounts on-chain by simplifying DeFi with a user-friendly interface, exemplified by features like Robinhood Earn which offers yield without requiring wallet management.
Built on Arbitrum's technology stack for its speed, low cost, and Ethereum's security, the chain focuses on financial products like Earn, spot trading, and perpetuals. Kerbrat downplays direct competition with platforms like Base, emphasizing the goal of expanding the overall market for on-chain assets. He details selective partnerships (e.g., Morpho, Lighter) based on compliance, unique UX, and differentiation. While regulatory clarity is pending for US perpetuals, the expansion continues via Bitstamp in Europe.
Finally, Kerbrat positions Robinhood as a "super app" integrating stocks, options, crypto, banking, and AI trading, with all major business lines generating hundreds of millions in revenue. For the chain, current priority is driving adoption over maximizing gas fee revenue.
marsbit1h ago